Download to read offline

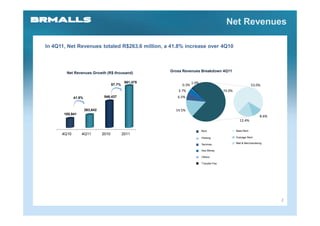
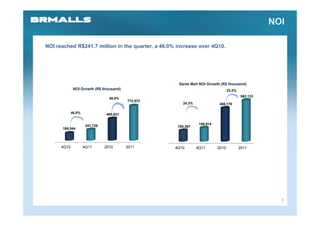
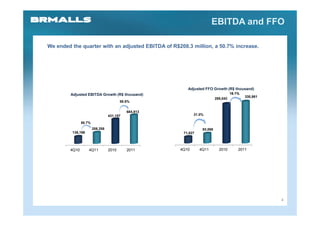
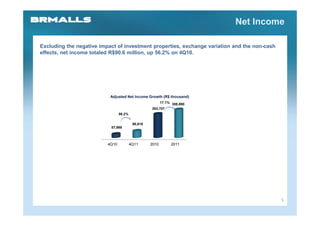
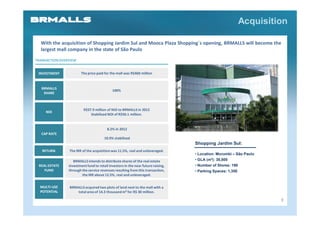
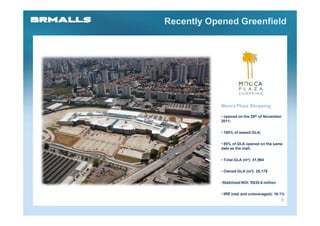
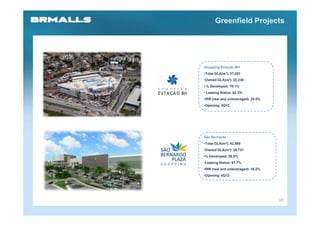
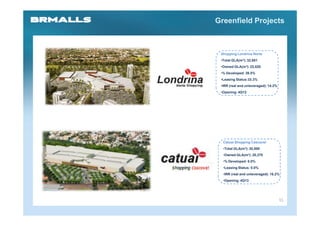

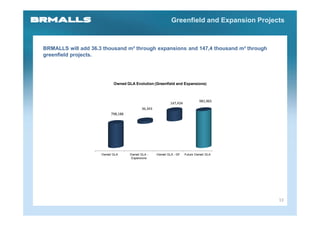
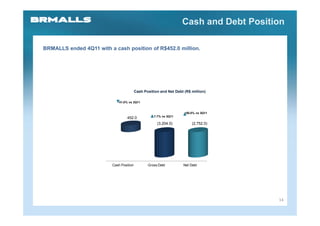

The document summarizes BRMALLS' financial results for 4Q11. Net revenues increased 41.8% to R$263.6 million driven by rent growth. NOI increased 46% to R$241.7 million and adjusted EBITDA rose 50.7% to R$208.3 million. BRMALLS also acquired Shopping Jardim Sul for R$460 million and recently opened the new mall Mooca Plaza Shopping. BRMALLS continues developing its greenfield projects including Shopping Estação BH, São Bernardo, Londrina Norte, and Catuaí Shopping Cascavel.


