Applications of flow cytometry to clinical microbiology
•
5 likes•2,732 views

This document provides an overview of the applications of flow cytometry to clinical microbiology. It discusses how flow cytometry can be used for the direct detection of bacteria, fungi, parasites and viruses through detection of antigens or nucleic acids. It also describes how flow cytometry can be applied to serological diagnosis and antimicrobial susceptibility testing. The document outlines how flow cytometry allows for rapid analysis and monitoring of infections and antimicrobial therapy. In conclusion, it discusses the benefits flow cytometry provides for clinical microbiology and its future potential.

More Related Content
What's hot
What's hot (20)
Similar to Applications of flow cytometry to clinical microbiology
Similar to Applications of flow cytometry to clinical microbiology (20)
More from LAB IDEA
More from LAB IDEA (20)
Recently uploaded
Recently uploaded (20)
Applications of flow cytometry to clinical microbiology
- 1. CLINICAL MICROBIOLOGY REVIEWS, Apr. 2000, p. 167–195 Vol. 13, No. 2 0893-8512/00/$04.00 0 Copyright © 2000, American Society for Microbiology. All Rights Reserved. Applications of Flow Cytometry to Clinical Microbiology† ´ ´ ALBERTO ALVAREZ-BARRIENTOS,1,2 JAVIER ARROYO,1,3 RAFAEL CANTON,1,4 ´ ´ ´ CESAR NOMBELA,1 AND MIGUEL SANCHEZ-PEREZ1,2* Departamento de Microbiologı II, Facultad de Farmacia,1 Centro de Citometrı de Flujo y Microscopı Confocal,2 ´a ´a ´a and Centro de Secuenciacion Automatizada de DNA,3 Universidad Complutense de Madrid, and Servicio de ´ Microbiologı del Hospital Ramon y Cajal, Carretera Colmenar,4 Madrid, Spain ´a ´ INTRODUCTION .......................................................................................................................................................167 TECHNICAL BASIS OF FLOW CYTOMETRY ....................................................................................................168 FLOW CYTOMETRY AND MICROBIOLOGY, A LONG TIME TOGETHER ...............................................169 General Applications of Flow Cytometry to Microbiology ................................................................................171 APPLICATIONS OF FLOW CYTOMETRY TO CLINICAL MICROBIOLOGY .............................................173 Direct Detection ......................................................................................................................................................173 Bacteria ................................................................................................................................................................173 Fungi.....................................................................................................................................................................174 Parasites...............................................................................................................................................................174 Viruses ..................................................................................................................................................................174 (i) Detection and quantification of viral antigens......................................................................................174 (ii) Detection and quantification of viral nucleic acids.............................................................................176 Serological Diagnosis .............................................................................................................................................177 Bacteria ................................................................................................................................................................177 Fungi.....................................................................................................................................................................178 Parasites...............................................................................................................................................................178 Viruses ..................................................................................................................................................................178 ANTIMICROBIAL EFFECTS AND SUSCEPTIBILITY TESTING BY FLOW CYTOMETRY......................179 Antibacterial Agents ...............................................................................................................................................179 Measurement of bacterial susceptibility..........................................................................................................179 Measurement of antimycobacterial drug susceptibility.................................................................................182 Intracellular bacterial pathogens .....................................................................................................................182 Postantibiotic effect.............................................................................................................................................183 Antifungal Agents ...................................................................................................................................................183 Factors Affecting Bacterial and Fungal Susceptibility Testing ........................................................................184 Antiparasite Susceptibility.....................................................................................................................................184 Antiviral Susceptibility...........................................................................................................................................185 HSV.......................................................................................................................................................................185 CMV......................................................................................................................................................................185 HIV........................................................................................................................................................................185 Poliovirus .............................................................................................................................................................186 Antiviral drugs: mechanisms of action ............................................................................................................186 MONITORING OF INFECTIONS AND ANTIMICROBIAL THERAPY ..........................................................186 CONCLUDING REMARKS AND FUTURE PERSPECTIVES ...........................................................................188 ACKNOWLEDGMENTS ...........................................................................................................................................188 REFERENCES ............................................................................................................................................................188 INTRODUCTION detection of specific antibodies have been widely used for the diagnosis of viral infections (181). These methods are sensitive Microbiology in general and clinical microbiology in partic- and specific, but, again, the time required for virus isolation is ular have witnessed important changes during the last few quite long and is governed by viral replication times. Addition- years (82). An issue for microbiology laboratories compared with other clinical laboratories is the relative slowness of de- ally, serological assays on serum from infected patients are finitive reports. Traditional methods of bacteriology and my- more useful for determining chronic than acute infections. cology require the isolation of the organism prior to identifi- Life-threatening infections require prompt antimicrobial ther- cation and other possible testing. In most cases, culture results apy and therefore need rapid and accurate diagnostic tests. are available in 48 to 72 h. Virus isolation in cell cultures and Procedures which do not require culture and which detect the presence of antigens or the host’s specific immune response have shortened the diagnostic time. More recently, the emer- * Corresponding author. Present address: Catedratico de Microbio- gence of molecular biology techniques, particularly those logı Dto. di Microbiologı y Genetica, Edificio Departamental, Cam- ´a, ´a based on nucleic acid probes combined with amplification pus Miguel de Unamuno, Universidad de Salamanca, 37007 Sala- manca, Spain. Phone: 34-923 294400. Fax: 34-923 224876. E-mail: techniques, has provided speediness and specificity to micro- misanper@gugu.usal.es. biological diagnosis (139). These techniques have led to a † We dedicate this review to Luis Carrasco. revolutionary change in many of the traditional routines used 167
- 2. 168 ´ ALVAREZ-BARRIENTOS ET AL. CLIN. MICROBIOL. REV. of these situations. In bacteremia and bacteriuria, FCM would not only rapidly detect organisms responsible for the infection but would also initially identify the type of microorganism on the basis of its cytometric characteristics. Although FCM offers a broad range of potential applications for susceptibility test- ing, a major contribution would be in testing for slow-growing microorganisms, such as mycobacteria and fungi (108, 163, 262). Results are obtained rapidly, frequently in less than 4 h; when appropriately combined with the classical techniques, FCM may offer susceptibility results even before the microor- ganism has been identified. The most outstanding contribution offered by FCM is the detection of mixed populations, which may respond to antimicrobial agents in different ways (331). This technique could also be applied to study the immune response in patients, detect specific antibodies (27, 133), and FIG. 1. Light-scattering and fluorescence signal production at the flow cell analysis point of the flow cytometer. From Purdue Cytometry CD-ROM vol. 1 monitor clinical status after antimicrobial treatments (58, 244). (adapted with permission of the publisher). Moreover, when properly applied, FCM can be adjusted to use defined parameters that avoid subjectivity and aid the clinical microbiologist in the interpretation of specific results, partic- ularly in the field of rapid diagnosis. in clinical microbiology laboratories. Results are offered quickly, the diagnosis of emerging infections has become eas- ier, and unculturable pathogens have been identified (109). TECHNICAL BASIS OF FLOW CYTOMETRY On the other hand, the current organization of clinical mi- FCM is an analytical method that allows the rapid measure- crobiology laboratories is now subject to automation and com- ment of light scattered and fluorescence emission produced by petition, both overshadowed by increasing costs (282, 339). suitably illuminated cells. The cells, or particles, are suspended Increased use of automation in clinical microbiology laborato- in liquid and produce signals when they pass individually ries is best exemplified by systems used for detecting bactere- through a beam of light (Fig. 1). Since measurements of each mia, screening of urinary tract infections, antimicrobial suscep- particle or cell are made separately, the results represent cu- tibility testing, and antibody detection. To obtain better mulative individual cytometric characteristics. An important sensitivity and speed, manufacturers continuously modify all analytical feature of flow cytometers is their ability to measure these systems. Nevertheless, the equipment needed for all multiple cellular parameters (analytical flow cytometers). these approaches is different, and therefore the initial costs, Some flow cytometers are able to physically separate cell sub- both in equipment and materials, are high. sets (sorting) based on their cytometric characteristics (cell Flow cytometry (FCM) could be successfully applied to most sorters) (Fig. 2). The scattered light (intrinsic parameters) and FIG. 2. Scheme of optic (dichroic mirrors and bandpass filters) and illumination (laser) systems of a flow cytometer with six parameters detected (size, granularity, and four fluorescences) by separate photomultiplier tubes (except size, which can be detected by photodiode or a PMT tube) and sorting capacity. From Purdue Cytometry CD-ROM vol. 1 (adapted with permission of the publisher).
- 3. VOL. 13, 2000 FLOW CYTOMETRY IN CLINICAL MICROBIOLOGY 169 fluorescence emissions of each particle are collected by detec- that allows the analysis of the huge amount of information tors and sent to a computer, where the distribution of the produced by multiparameter data acquisition. The analytical population with respect to the different parameters is repre- software permits the study and independent analysis of a par- sented. Scattered light collected in the same direction as the ticular subpopulation. Besides all the statistical information, incident light is related to cell size, and scattered light collected the data can be represented in several different ways: mono- at an angle of 90° gives an idea of the particle complexity. This parametric histograms, biparametric histograms, and three- parameter is related to cell surface roughness and the number dimensional representations (Fig. 3). There is a growing mar- of organelles present in the cell. Size and complexity are con- ket of commercial FCM software. Free software can also be sidered intrinsic parameters since they can be obtained without downloaded from the Internet, where it is possible to find having to stain the sample. To obtain additional information, information about all the fields related to FCM (cytometry samples can be stained using different fluorochromes. Fluoro- network sites, http://nucleus.immunol.washington.edu/ISAC chromes can be classified according to their mechanism of /network_sites.html; JCSMR flow cytometry software, http:// action (127): those whose fluorescence increases with binding jcsmr.anu.edu.au/facslab/facs.html; ISAC WWW home page, to specific cell compounds such as proteins (fluorescein iso- http://www10.uniovi.es/ISAC.html). thiocyanate [FITC]), nucleic acids (propidium iodide [PI]), and lipids (Nile Red); those whose fluorescence depends on FLOW CYTOMETRY AND MICROBIOLOGY, cellular physiological parameters (pH, membrane potential, A LONG TIME TOGETHER etc.); and those whose fluorescence depends on enzymatic activity (fluorogenic substrates) such as esterases, peroxidases, From the beginning of FCM (68), the ancestor of modern and peptidases (Table 1). Fluorochromes can also be conju- flow cytometers has been identified with an aerosol particle gated to antibodies or nucleotide probes to directly detect counter designed to analyze mine dust (124). This apparatus microbial antigens or DNA and RNA sequences. was used in World War II by the U.S. Army in experiments A typical flow cytometer has several parts. (i) The hydraulic for the detection of bacteria and spores. Gucker et al. (124) system produces the fluid stream, with a liquid sheath sur- reported that the instrument could be used with biological rounding the cell suspension (hydrodynamic focusing). This samples (bacteria), as well as particles in air suspension or sheath is responsible for the passage of the particles through aerosols. Thus, FCM with an application to microbiology orig- the sensing point at a constant velocity. (ii) The illumination inated many years before the use of flow cytometry as a tool for system consists of the light that produces the scatter signals studying mammalian cells. The original device incorporated a and fluorescence emission when the particles pass through it. sheath of filtered air to limit the air sample stream to the There are two types of flow cytometers, depending on the central portion of the flow chamber. The detector used was a illumination source: those with a laser light source, and those then recently developed device called a photomultiplier tube. with an arc lamp source. Each has it own advantages and Particle counters based on the Coulter orifice principle, in disadvantages, but the main difference lies in their fields of which the difference in electrical conductivity between the cells application. Arc lamp cytometers are frequently used in mi- and the medium in which they are suspended is measured by crobiological applications due to their better scatter resolution the change in electrical impedance produced as they pass and versatility. In contrast, laser flow cytometers have wider through an orifice, were later developed. These instruments applications in immunology and hematology because they ex- were widely applied in hematology studies. However, the first cite fluorochromes associated with cells. Studies comparing the real flow cytometer was built by Kamentsky et al. (154), using two types of cytometers have concluded that the selection of spectophotometric techniques to detect and measure nucleic one rather than the other depends mainly on the range of acids and light scattering of unstained cervical cells in a flow wavelengths required for the excitation of the selected fluores- stream. At the same time, Fulwyler, working at the Los Alamos cent stains (13, 161). Our personal experience supports this Scientific Laboratory, described the first flow cytometer with opinion and work should aim at developing protocols accord- sorting capability (104). This machine worked by measuring ing to the type of cytometer available. (iii) The optic system cell volumes obtained by the Coulter orifice principle. Fulwyler focuses incident light on the crossing particles, recovers the adapted the ink jet printer principle, using electrostatic deflec- scattered light and the fluorescence produced by the fluoro- tion of charged droplets, as a cell-sorting mechanism. In fact, chromes present in the cells, and directs both to the appropri- sorting capability was introduced to demonstrate the accuracy ate photomultiplier tubes (Fig. 2). (iv) The electronic system of the signals obtained by the machine and to ascribe a given transforms the incident light from fluorescence and light scat- distribution of cell volume detected by an electronic signal to a tered into electric pulses (analogic). The magnitudes of these specific cell type. During the 1970s, applications of FCM to pulses are distributed electronically into channels, permitting research into mammalian cells advanced rapidly, but at that the display of histograms of the number of cells plotted against time few instruments were developed for microbiological stud- the channel numbers (digital) (68). If the instrument has the ies. The subsequent applications to microbiology of FCM tech- capacity to do so, it also controls the cell-sorting process. Flu- niques that were initially developed to study mammalian cells orescence-activated cell sorting refers to the ability to select a were due to optical improvements in flow cytometers and subpopulation from the whole population, following cytomet- newly developed fluorochromes. The development of an arc ric classification, and to physically separate this particular pop- lamp-based instrument by Steen’s group in 1979 (301, 303) ulation. To do this, the machine produces a uniform stream of allowed the use of FCM for basic research on bacteria. Be- droplets; a particular droplet containing a cell can be charged, cause of the design of the flow chamber and the use of pho- permitting selection of the droplet when it passes through an tomultiplier tubes for detecting scattered light, this instrument electrical field produced by deflection plates (Fig. 2). In this was ideal for studying microorganisms (7, 37). The promising way, two populations can be sorted at the same time (positively tool described by Boye and Steen in 1983 became a “potent and negatively charged droplets). A new high-speed sorter illuminating light” in the 1990s (38), as was stated in the book machine has been developed with the possibility of sorting four edited by David Lloyd, Flow Cytometry in Microbiology (186a), populations at the same time (MoFlo; Cytomation, Freiburg, from which most microbiological cytometrists have learned Germany). (v) The data analysis system consists of software their trade. In the last years of the 1990s, the applications of
- 4. 170 ´ TABLE 1. Some of the fluorescent molecules used to study microorganisms by flow cytometry Excitation wavelength Emission wavelength Dye Ligand or substrate Applications ( max) (nm) ( max) (nm) TOTO-3 642 660 DNA, RNA DNA quantification, cell cycle studies SYTOX Green 504 525 DNA, RNA Viability, DNA quantification PI 536 625 DNA, RNA Viability, DNA quantification, cell cycle studies Ethidium bromide 510 595 DNA, RNA DNA quantification, cell cycle studies ALVAREZ-BARRIENTOS ET AL. Hoechst 33258/33342 340 450 DNA (GC pairs) Cell cycle studies SYTO 13 488 509 DNA, RNA Viability, DNA quantification, cell cycle studies Mithramycin 425 550 DNA Cell cycle studies Pyronine Y 497 563 RNA RNA quantification FITC 495 525 Protein Microbe detection Texas Red (sulforhodamine isothiocyanate) 580 620 Protein Microbe detection Oregon Green isothiocyanate 496 526 Protein Microbe detection Indo-1 340 398–485 Ca2 Ca2 mobilization Fura-2 340 549 Ca2 Ca2 mobilization Fluor-3 469 545 Ca2 Ca2 mobilization BCECF 460–510 520–610 pH Metabolic variations SNARF-1 510 587–635 pH Metabolic variations DIOC6(3) 484 501 Membrane potential Antibiotic susceptibility, metabolic variations Oxonol [DiBAC4(3)] 488 525 Membrane potential Antibiotic susceptibility, metabolic variations Rhodamine 123 507 529 Membrane potential Antibiotic susceptibility, metabolic (mitochondria) variations Fun-1 508 525–590 Yeast vacuolar enzyme activity Yeast metabolic state Nile Red 490–550 540–630 Lipids Lectins Depends on fluorochrome Depends on fluorochrome Membrane oligosaccharides Cell wall composition, microbe conjugated conjugated detection Fluorescently labeled oligonucleotides Depends on fluorochrome Depends on fluorochrome Nucleotide sequences Microbe identification conjugated conjugated Calcofluor white 347 436 Chitin and other carbohydrate Fungal detection polymers Substrates linked to fluorochromes Enzyme activities Metabolic activity Antibodies labeled with flurochormes Antigens Microbe detection CLIN. MICROBIOL. REV.
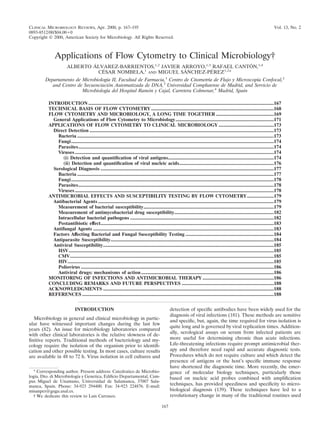
- 5. VOL. 13, 2000 FLOW CYTOMETRY IN CLINICAL MICROBIOLOGY 171 FIG. 3. The data obtained from a flow cytometer can be displayed in several ways. The most common are the mono- and biparametric histograms (A and B), which usually include a statistical analysis of the results. (A) Monoparametric histogram showing the selected parameter on the x axis and the relative cell number on the y axis. (B) Biparametric histogram showing cells distributed as a function of their signal intensity with respect to each parameter. Cells located in the upper left quadrant are positive for the parameter represented on the y axis, cells located in the upper right quadrant are positive for both parameters, cells located in the lower left quadrant are double negative, while cells in the lower right panel are positive for the parameters on the x axis. (C and D) Three-dimensional representations. The z axis can represent the relative number of cells (C) or a third parameter (D), such as scattered light on the x and y axes and fluorescence signals on the z axis. FCM in microbiology have significantly increased (9, 28, 103, teria in the same sample (301, 302, 306). One parameter was 148, 291). light scattered (size), and the other was either fluorescence emission from fluorochromes coupled to cellular components General Applications of Flow Cytometry (protein and DNA) or autofluorescence (Fig. 4), or light scat- to Microbiology tered acquired from another angle (42, 151, 277, 293, 301, 302, 306, 316). However, the use of several fluorochromes for direct The applications of FCM to microbiology have been so staining or through antibody or oligonucleotide conjugates widespread that discussion of all of them is beyond the scope plus size detection is the simplest way to visualize or identify of this review. For more information, see the excellent reviews microorganisms by FCM (6, 7, 10, 11, 257, 317, 332). by Davey and Kell (68), Porter et al. (263), and McSharry (211) The simple and rapid assessment of the viability of a micro- and the “Bible” of flow cytometry by Howard Shapiro, Practi- organism is another important aspect of FCM. The effect of cal Flow Cytometry (291). Below, we briefly describe some of environmental stress or starvation on the membrane potential the applications of FCM in the field of microbiology, focusing of bacteria has been studied by several groups using fluoro- on present or future applications in clinical microbiology. chromes that distinguish among nonviable, viable, and dor- Earlier works by Steen had demonstrated the applicability of mant cells (155–157, 188; see references 68, 71, 78, 89, 135, dual-parameter analysis to discriminate among different bac- 150, 200–203, 265, and 328 for reviews). Other authors have
- 6. 172 ´ ALVAREZ-BARRIENTOS ET AL. CLIN. MICROBIOL. REV.
- 7. VOL. 13, 2000 FLOW CYTOMETRY IN CLINICAL MICROBIOLOGY 173 demonstrated the use of PI as a viability marker in yeasts (72), with viral infection, including HSV (144, 146), Epstein-Barr Pneumocystis carinii (177), and bacteria (89, 230, 264). virus (EBV) (4), influenza virus (267), measles virus (93), pap- FCM has also been used in metabolic studies of microor- illomavirus (340), and HIV-1 (129, 194) infections. Further- ganisms. This was first accomplished by Thorell (316), using more, by means of biotinylated or directly FITC-labeled virus, autofluorescence due to NADPH and flavins as metabolic sta- interactions of EBV (142, 159, 182, 335), echovirus (206), ad- tus markers. Other authors studied DNA, protein, peroxide enovirus (217), influenza virus (228), simian virus 40 (SV40) production, and intracellular pH (3, 5, 39, 140, 324, 345). Re- (20), human T-cell leukemia virus type 1 (HTLV-1) (110), cently developed fluorochromes and kits (Sytox Green and measles virus (226, 232), bovine herpesvirus (326), papilloma- Live/Dead kits; Molecular Probes, Eugene, Oreg.) have been virus (268), bunyaviruses (249), poliovirus (102), and HIV-1 used for the FCM-based counting of live and dead bacteria and (14, 308, 318) with their putative cell receptors have been yeasts (176, 178, 311), simplifying staining protocols and mak- described. These investigations show that FCM is able to pro- ing data interpretation easier. Other kits are available for de- vide solutions to problems arising when working with micro- tecting gram-positive and gram-negative bacteria or for study- organisms. ing yeast organelles (127). Recently, Mason et al. (204) described a method which enables the discrimination of gram- APPLICATIONS OF FLOW CYTOMETRY TO positive from gram-negative bacteria on the basis of the fluo- CLINICAL MICROBIOLOGY rescence emitted when the organisms are stained with two fluorochromes. These authors correctly predicted the Gram The isolation of microbes and their identification, the detec- stain reaction of 45 strains of clinically relevant organisms, tion of increased levels of antibodies to a particular pathogen including several known to be gram variable. In addition, rep- in the course of an illness, and direct detection of microbial resentative strains of gram-positive anaerobic organisms, components (nucleic acids and proteins) in clinical samples which are normally decolorized during the traditional Gram obtained from different tissues or body fluids are the main stain procedure, were classified correctly by this method. tools for laboratory diagnoses of microbial infections. Effective FCM also offers the possibility of studying gene expression antimicrobial therapies have indeed been developed because using reporter genes in yeasts (56, 258, 297, 338) and bacteria early treatment is crucial in many cases; therefore, rapid diag- (8, 55). The development of gene expression systems based on nosis is essential in the fight against infection. green fluorescent proteins facilitates this kind of study due to the simplicity of the technique (60, 77, 229, 320). Direct Detection The sensitivity of FCM allowed Philips and Martin (255) to detect Bacillus spores (254). Using a similar approach, Griffiths Bacteria. Antibodies are currently changing the way in which et al. (121) and Challier et al. (49) were able to sort spores we identify microbes, making it easier and faster. Their spec- from Dictyostelium discoideum and Enterocytozoon bieneusi, re- ificity and the possibility of using fluorochrome-labeled anti- spectively. These examples show the potential of FCM in the bodies to specific antigens render them one of the most pow- investigation of small microbes. erful tools in the identification of pathogens. The main The interaction between pathogens and phagocytic cells has disadvantage of this method is still the limited availability of also been studied by FCM (22, 23). The development of fluo- antibodies directed against particular microbes. Other advan- rochromes to detect oxidative bursts due to phagocytosis (17, tages of using antibodies are that the cells do not need to be 251, 281) increased the number of studies with different mi- cultivable and that the method is simple and fast. In an early crobes such as Borrelia burgdorferi (17), Staphylococcus spp. work from 1983, Groschel (122) explained somewhat prophet- (128, 196), Escherichia coli (70, 271), Bordetella pertussis (299), ically the use of antibodies in clinical microbiology. FCM in Cryptococcus neoformans (48), Salmonella (272), and yeasts conjunction with fluorescent antibodies has been used to de- (90, 96, 114). tect surface antigens in Haemophilus (298), Salmonella (57, FCM has been extensively used for studying virus-cell inter- 207), Mycobacterium (238), Brucella (35), Branhamella ca- actions (172, 180, 334). This topic was reviewed in depth by tarrhalis (29), Mycoplasma fermentans (50), Pseudomonas McSharry in 1994 (211). Modulation of the expression of cel- aeruginosa (134), Bacteroides fragilis (191, 239) and Legionella lular proteins due to viral infection has been studied by FCM (143), among other microorganisms. These examples illustrate for cytomegalovirus (CMV) (116), herpes simplex virus (HSV) the sensitivity and specificity of using antibodies that allow the (149), adenovirus (168), human immunodeficiency virus (HIV) detection of particular cell types (of as few as 100 cells per ml (53), and hepatitis B virus (HBV) (346). Perturbation of the in 30 min) in heterogeneous populations (57). cell cycle and DNA replication in virus-infected cells have also The first study detecting of microbes in blood by using FCM been studied by FCM for papillomavirus (25), CMV (80) and was done with ethidium bromide as the detecting fluoro- human HIV-1 (273). This technique has been also used to chrome (195). Blood cells were lysed, and the remaining bac- study the effect of viral infection on intracellular Ca2 levels teria were stained with ethidium bromide; as few as 10 E. coli ([Ca2 ]i) by Irurzun et al. (145) and by Miller et al. (221). FCM cells/ml were detected. Using ethidium bromide fluorescence has also permitted the demonstration of apoptosis associated and light-scattered signals, Cohen et al. (58) were able to FIG. 4. (A) Dual-parameter analysis of forward light scatter (size) and red fluorescence signals allowed the discrimination between two species of Candida, based on different fluorochrome staining backgrounds. These yeast species are indistinguishable by monoparametric analysis of forward light scatter or red autofluorescence. However, after addition of PI, they show different basal levels, and if this is plotted against size, it is possible to discriminate them. This kind of analysis permits quantification of both species in mixed cultures. (B) Quantification of different protein amounts (measured as FITC fluorescence) can be used to distinguish different microorganisms such as those represented in the histogram (from Purdue Cytometry CD-ROM, vol 2., ISSN 1091-2037, provided by Hazel M. Davey [adapted with permission of the publisher]). (C) Dual-fluorescence discrimination of fungal spores. Spores from Aspergillus, Mucor, Cladosporium, and Fusarium were fixed and stained with Calcofluor, which binds to chitin in the spore wall, and PI, which stains nucleic acids. As shown, the spores have different amounts of chitin and nucleic acids, permitting their segregation by FCM. Samples shown in panel A were run on a FACScan (Becton-Dickinson) flow cytometer, the ones shown in panel B were run on an EPICS Elite (Coulter) flow cytometer, and those shown in panel C were run on a Bryte-HS (Bio-Rad) flow cytometer.
- 8. 174 ´ ALVAREZ-BARRIENTOS ET AL. CLIN. MICROBIOL. REV. detect bacteria in 43 clinical specimens from several sources, strated that mixed infections occur, and hence the treatment such as wound exudates, bile, serous-cavity fluids, and bron- for such circumstances can be established. chial-lavage fluids, in less than 2 h, although they were unable Parasites. The first applications of FCM to parasites in- to identify them. volved a study of the cell cycle and the amounts of DNA of An FCM method for the direct detection of anaerobic bac- Physarum polycephalum myxamoebae (319) and the character- teria in human feces was described by van der Waaij et al. ization of monoclonal antibodies against membrane antigens (322), using PI for discriminating the patient’s cells and ex- from Leishmania (337). Specific clinical applications came cluding large particles by forward light scatter. At the same later, when Flores et al. (99) used monoclonal antibodies, time, fluoresceinated antibodies against human immunoglob- FCM, and immunofluorescence microscopy for the direct iden- ulin A (IgA) were added to detect IgA-coated bacteria. This tification of Naegleria fowleri and Acanthamoeba spp. in clinical method allows the rapid and highly sensitive assessment of specimens. fecal flora by specific IgA-FITC fluorescence without the need Several approaches have been developed in the last few to culture the samples. years to detect intracellular parasites, such as Plasmodium Another way in which FCM can achieve direct diagnosis is (147, 153, 240–242, 250, 319, 325). Such work took advantage by fluorescent-oligonucleotide detection. By combining rRNA- of the absence of DNA in erythrocytes. Thus, if the parasite is targeted fluorescent probes and 4 ,6-diamidino-2-phenylindole inside the cell, its DNA can be stained with specific fluoro- (DAPI) for nucleic acid staining, Wallner et al. (333) showed chromes and detected by FCM. The multiparameter analysis that it was possible to detect Acinetobacter spp. by FCM. To permitted by FCM can be used to study other characteristics, date, this approach has not been used with clinical samples, such as parasite antigens expressed by the erythrocyte (which perhaps owing to its methodological complexity. Nevertheless, can be detected by antibodies conjugated with fluorochromes) the specificity provided by the oligonucleotide probe to identify (54, 153) or the viability state of the parasitised cell. Further- the putative infectious agent can be taken advantage of (315), more, the technique can be used with either fresh or fixed cells thus promising many future applications. (241, 242). An important study showing the benefits of flow The use of different-sized fluorescent microspheres coated cytometry is that of Dixon et al. (81), who compared normal with antibodies against microbes is a new application of flow light microscopy, immunofluorescence microscopy, and FCM cytometry for direct diagnosis (169). This method detects the in the detection of Giardia lamblia cysts. They showed that binding of specific microbes to antibody-coated microspheres when FCM is used in combination with immunofluorescence, a by measuring the decrease in the fluorescence emission of the larger number of samples can be analyzed in a relatively short microspheres due to the shading effect of microbes on both the period and, more important, that this technique affords more consistent results than either conventional or immunofluores- exciting and emitting light. With different-sized fluorescent cence microscopy when samples containing small number of microspheres, several pathogens can be detected simulta- cysts are analyzed. neously in the same sample. This approach could also be used Viruses. FCM allows both detection and quantification of with fungi, parasites, and viruses, as well as in infections pro- infected cells directly in clinical samples or after inoculation duced by combinations of these. In fact, as discussed below, a and culture of the virus in cell culture. similar approach has been used for the simultaneous detection (i) Detection and quantification of viral antigens. FCM can of plant viruses (137). detect viral antigens either on the surface of or within infected Fungi. With regard to yeasts, the work by Groshen et al. cells (172). It can rapidly detect and quantify virus-infected (122), Chaffin et al. (47), and Han et al. (126) has shown that cells using antibodies that specifically recognize surface or in- surface antigens of Candida albicans can be detected by flow ternal antigens (91, 211, 213, 334); in the latter case, perme- cytometry in conjunction with available specific antibodies. As abilization of the cells is required. A thorough review of dif- discussed below, this approach can be used for clinical samples. ferent permeabilization methods, including the advantages and The possibility of serotyping Candida isolated from clinical disadvantages of each, for viral antigen and nucleic acid de- samples emerged from the work of Chaffin et al. in 1988 (47) tection has been written by McSharry (211). Direct and indi- and Brawner and Cutler in 1989 (40). However, it was not until rect fluorescent-antibody methods are used. Direct detection 1996 that Mercure et al. (219) validated the FCM serotyping involves the use of fluorescently labeled antibody (labeled with procedure, using serotype A-specific antisera. According to FITC or phycoerythrin). In the indirect fluorescent-antibody Mercure et al., the most striking feature of this method is its method, unlabeled antibody is bound to infected cells, which reliability. Ninety-four strains isolated from patients were an- are then incubated with fluorescence-labeled anti-Ig that binds alyzed by a slide immunofluorescence assay and FCM. FCM to the first viral antibody. was able to detect the presence of two different strains in a As previously stated, FCM is carried out on single cells, and culture that was assumed to be pure and serotyped four strains therefore FCM analysis of virus-infected cells is best suited to whose serotypes could not be determined by slide immunoflu- blood, bronchoalveolar lavage fluid, and urine samples (172). orescence. Again, it was acknowledged that when a cytometer However, it is also possible to analyze cells from tissues that is available, the procedure is probably more cost-effective than have previously been treated enzymatically (211). a commercially available kit for Candida serotype determina- Based on the potential of FCM for multiparametric analysis, tion. Since the origin of the infecting strain(s) is often ques- there are two key advantages to its use in studying viral infec- tioned when clinicians encounter patients with repeated epi- tion: (i) its ability to analyze several parameters in single- sodes of Candida infections, FCM can help to discriminate infected cells at the same time and (ii) its ability not only to among strains, as demonstrated in this work (219). detect but also to quantify infected cells. These parameters The diagnosis of onychomycosis based on clinical presenta- may be related to particular components or events of the tion, culture, and microscopy is hampered by false-negative infected cell or components (proteins or nucleic acids) of the and false-positive results that confuse treatment outcomes. virus. For this reason, FCM has been a powerful tool to char- Using FCM and antibodies directed against yeasts, Pierard et acterize the mechanisms of viral pathogenesis. Furthermore, al. (256) identified fungal pathogens and differentiated them FCM allows simultaneous detection of several viruses in a from nonpathogenic ones. Furthermore, the authors demon- sample by using (i) antibodies to different viral antigens con-
- 9. VOL. 13, 2000 FLOW CYTOMETRY IN CLINICAL MICROBIOLOGY 175 jugated to different fluorochromes, or (ii) specific viral anti- sensitivity of the method was somewhat lower than that of the bodies conjugated to latex particles of different sizes. As stated slide method, it might be sufficient to predict the disease. above, the presence of different viral antigens is detected by Honda et al. (132) also identified specific CMV-infected cell differences in the forward-scattered light as a consequence of populations in peripheral blood lymphocytes from CMV-in- the different sized particle used for each antibody. For exam- fected patients by FCM. Using monoclonal antibodies directed ple, Iannelli et al. (137) simultaneously detected cucumber against immediate-early CMV antigen (see above) or against mosaic, tomato, and potato viruses by using 3-, 6-, and 10- m- several cell membrane markers to phenotype infected periph- diameter latex particles, respectively. Although this method eral blood cells from bone marrow transplant recipients, these was aimed at the detection of plant viruses, its basis could be authors developed a rapid and quantitative FCM method for applied to the detection of animal or human viruses in any the detection of immediate-early CMV antigen. The detection clinical sample, such as the simultaneous detection of CMV, of CMV antigens specifically in the polymorphonuclear leuko- HSV, and HBV in organs destined for transplantation as well cytes from transplanted patients with CMV pneumonia sug- as in transplanted patients and coinfections in HIV-infected gests that the FCM antigenemia assay would be useful for individuals. predicting CMV-associated disease in transplant recipients Flow cytometric analysis has allowed the detection and (132). In summary, FCM offers a rapid and suitable quantifi- quantification of SV40 T antigen in infected cells and moni- cation of the CMV viral load. Although systematic compara- toring the kinetics of T-antigen expression. By means of mul- tive evaluations of the CMV viral load using this method are tiparametric analysis, using PI for the measurement of cellular needed, current data are promising. DNA and FITC-labeled antibody for the detection of viral The detection of cytomegalic endothelial cells in peripheral antigens, Lehman et al. (171, 179) related high levels of SV40 blood of patients is another means of monitoring active CMV T antigen to the appearance of cells with tetraploid DNA infection. Through enrichment of endothelial cells in the content due to a cell cycle block at G2/M. mononuclear fraction by density centrifugation, endothelial Detection of immediate-early, early, and late CMV antigens cell-specific staining, and fluorescence-activated cell sorting of by monoclonal antibodies permits direct diagnosis and quan- these cells, a method with 10-fold greater sensitivity than cy- tification of CMV infection. This is a frequent complication in tocentrifugation of the mononuclear cell fraction alone has immunosuppressed patients, including transplant recipients recently been developed for quantification of cytomegalic en- and AIDS patients. In 1988, by means of FCM, Elmendorf et dothelial cells by FCM (158). Belles-Isles et al. (24) have also al. (91) detected early CMV antigen 30 min after virus adsorp- suggested using FCM to monitor CMV infections by monitor- tion to fibroblasts. Thus, FCM permits the detection of viral ing the CD8 CD38 T-cell subset in kidney transplant recip- ients; this T-cell subpopulation usually increases during active infection earlier than does conventional immunofluorescence viral infections. Quantification of CD8 CD38 T cells by microscopy or the detection of cytopathic effects in cell culture dual-color FCM in 77 kidney transplant recipients during the (91, 289, 310). posttransplantation period detected high levels of CD8 During active infection, CMV disseminates in the blood, and CD38 subsets in all patients with CMV disease. Belles-Isles et viremia has been described as a major risk factor for the pro- al. (24) therefore concluded that the percentage of CD8 gression to clinical disease, particularly in allogeneic bone mar- CD38 T cells constitutes an immunologic marker that can row transplant recipients (31). Accordingly, quantification of serve as a tool for early detection of viral diseases. the viral load in persistently infected hosts may provide a Viral antigens have also been detected by FCM for the method to predict the development of CMV disease and help diagnosis of hepatitis and herpesvirus infections. Quantitative to differentiate symptomatic infection from asymptomatic and dynamic analyses of hepatitis virus markers are important shedding. Preventive strategies increasingly use the CMV load in the follow-up of antiviral treatments (32). HBV surface as a surrogate marker for disease and initiate antiviral treat- (HBsAg) and HBV core (HbcAg) antigens in peripheral blood ment based on the systemic viral load (31). Sensitive tech- mononuclear cells (PBMCs) from HBV patients have been niques, such as the pp65 antigenemia assay or the quantitative detected by FCM using antibodies (52, 278). In one study, 35 PCR assay, allow the detection and quantification of systemic patients with HBV chronic active hepatitis and 38 out of 60 CMV. Both assays provide a good estimation of the systemic patients with acute hepatitis B (63%) expressed HbsAg in CMV burden. Owing to the high sensitivity of these assays, PBMC. In another work, Chemin et al. demonstrated the se- CMV is also detectable in patients with asymptomatic infec- lective detection of HBsAg and HBcAg on B lymphocytes and tions. However, patients with disease often have a higher viral natural killer cells from chronically HBV-infected patients load and can therefore be discriminated (31, 314). (52). Hepatitis C virus (HCV), woodchuck hepatitis virus, and The pp65 antigenemia assay determines the systemic CMV varicella-zoster virus were also detected by FCM in PBMCs load and consists of direct staining of polymorphonuclear leu- using monoclonal antibodies to HCV core antigen (34), poly- kocytes with monoclonal antibodies against the lower matrix clonal antibodies to woodchuck hepatitis virus (51), and anti- protein pp65 (31, 112, 314). This determination has classically bodies to the gpI glycoprotein from varicella-zoster virus (296), been made by very difficult and time-consuming microscopic respectively. Thus, FCM detection of viral antigens offers a observation of immunostained cells (112). Recent studies have potentially useful automated assay for the clinical diagnosis of evaluated FCM for the direct detection and quantification of multiple blood-borne viruses. CMV antigens in polymorphonuclear leukocytes from trans- HSV antigens have also been detected in HSV-1, HSV-2, plant recipients (76, 132, 141). Measurement of pp65 CMV and human herpesvirus 8 (HHV-8)-infected cells by FCM antigenemia by FCM overcame these problems owing to its (117, 213, 300, 347). After overnight amplification of clinical speed and automation and showed it to be a specific and samples suspected to contain HSV, FCM detected virus 1 to 3 reproducible method, especially when the paraformaldehyde- days before cytopathic effects were detected in cell culture methanol permeabilization-fixation method and antibody 1C3 (213). Sensitive FCM assays have also been recently developed (to late antigens) were used (141). Good agreement was found to quantitate rotavirus in clinical and environmental samples between the degree of DNA load and the level of antigenemia (2, 19). detected by FCM in renal transplant recipients. Although the Finally, FCM has also been extremely useful in the study of
- 10. 176 ´ ALVAREZ-BARRIENTOS ET AL. CLIN. MICROBIOL. REV. HIV infection (174, 211, 213). By studying HIV-infected cell while only 0.9% were found when CMV antigens were ana- lines by FCM in 1987, Cory et al. (61) determined the percent- lyzed by immunoenzymatic labeling (184). Identification of age of infected cells and the relative amount of p24 antigen per specific CMV-DNA or RNA by this method, with the possi- cell. These and other authors used the same assay to detect and bility of phenotyping cells by FCM, should permit latency stud- quantify HIV-infected cells in cell cultures by monitoring p24, ies in CMV infections through the identification of specific p17, nef, gp120, gp41, and gp160/gp41 expression (61, 62, 130). cells actively replicating the virus and cells that harbor the virus This method proved to be more sensitive and accurate for in a latent state, acting as a reservoir for infection. Further- quantitative studies and faster than other methods of HIV-1 more, FCM permits these cells to be sorted for the character- detection, such as the reverse transcriptase (RT) assay or de- ization of latency and reactivation mechanisms. termination of syncytium formation. Two fluorescence in situ hybridization-FCM assays have also Detection of HIV antigens on peripheral blood mononu- been developed for monitoring EBV-infected cells in blood clear cells by FCM is a useful method for monitoring HIV (66). Crouch et al. were able to quantify EBV-infected cells in replication in vivo by monitoring the number of circulating suspension for both the latent and replicative phases of the CD4 cells positive for p24 (63, 131, 235), p24 and nef (213), virus, using in situ hybridization with two different fluores- or p18 and p24 (107). In all these works, the percentage of cells cently labeled probes (specific for each phase of EBV replica- expressing these antigens was statistically correlated with the tion) and FCM (66). This in situ hybridization-FCM assay clinical status of the patient. Furthermore, the authors re- detected one positive cell out of 9,000, which is sufficient for a ported an inverse correlation of HIV antigen-positive mono- diagnosis of EBV-infected cells in transplant recipients with nuclear cells and the number of CD4 cells. Therefore, these lymphoproliferative disease. assays are useful for rapidly monitoring disease progression in As an alternative to conventional PCR radioactive methods, HIV-seropositive individuals and for monitoring the effect of nonradioisotope FCM detection of viral PCR products was antiviral therapy. Some studies found a lack of correlation developed (342–344). Following virus-specific PCR amplifica- between cell-associated antigen detection by FCM and the tion incorporating digoxigenin-labeled dUTP, labeled ampli- detection of HIV antigens in sera from HIV-seropositive indi- cons are hybridized with biotinylated probes, the hybrid DNA viduals by the standard antigen capture enzyme-linked immu- is captured using streptavidin-coated beads, and FCM analysis nosorbent assay (ELISA). As explained by McSharry et al. of the binding of FITC-labeled anti-digoxigenin antibodies is (213), the lack of correlation is due to a masked antigenemia in performed (342–344). This PCR immunoreactive bead (PCR- the presence of immunocomplexes, which could underestimate IRB) assay has been used for the detection and quantification the amount of antigen present in peripheral blood detected by of HIV-1 (342, 343) and HBV (344) viral genomes. As few as ELISA. However, in spite of being a good assay for evaluating two or three copies of HIV-1 proviral DNA sequences were disease progression, FCM detection of HIV antigens is not rapidly detected in PBMC from HIV-1-infected blood donors, sensitive enough to detect the low levels of HIV-infected pe- a sensitivity comparable to that of the conventional radioactive ripheral blood cells in asymtomatic HIV-1-seropositive indi- detection of PCR products (342, 343). The PCR-IRB assay is viduals (213). This lack of sensitivity can be overcome, as a very simple, specific, sensitive, and automatic assay for the discussed below, by coupling in situ PCR and FCM for the detection of specific HIV-1 amplicons. Yang et al. (343), test- detection of small numbers of peripheral blood cells infected ing a panel of 20 pedigreed PBMC specimens, demonstrated a with low levels of HIV in asymptomatic individuals. perfect correlation with the results from conventional radioac- (ii) Detection and quantification of viral nucleic acids. The tive assays. By this method, Dorenbaum et al. (84) detected emergence of PCR and rPCR RT-PCR techniques has allowed about three copies of proviral HIV DNA using primers for the the highly sensitive detection of specific viral nucleic acids long terminal repeat sequences. In a double-blind study of (DNA or RNA) in virus-infected cells. These methods are blood samples from 14 mother-infant pairs using the PCR-IRB indeed the most sensitive for the detection and characteriza- assay, these authors obtained similar results to those found tion of viral genomes, especially in the case of rare target viral with the commercial Amplicor HIV-1 PCR kit. On testing 20 sequences (123). However, the association between the viral specimens of blood donors, with or without markers of HBV nucleic acid and an individual cell is lost, and therefore no infection, PCR-IRB detected HBV DNA in a 1,000-fold- information about productively infected cell populations is ob- higher dilution than the infectious dose needed to produce tained by this method. FCM analysis of fluorescent in situ infection in chimpanzees (344). The PCR-IRB assay proved to hybridization in cell suspension overcomes this problem (33, be specific and more sensitive than the PCR analyses involving 173), since this assay can be coupled with simultaneous cell hybridization with radioactive probes for the detection of HBV phenotyping (by using specific antibodies to different cell in blood. Importantly, the FCM assay avoids the use of radio- markers). isotopes. FCM detection of in situ hybridization has been used to FCM and RT-PCR have detected gene expression in indi- analyze rare virus-producing cells in peripheral blood samples. vidual cells (111). Muratori et al. (225) developed an in situ HIV-1 RNA in infected cell lines was detected by fixation of RT-PCR technique using fluorescein-labeled HCV specific the cells in suspension, hybridization with HIV-1 genomic primers detected by FCM for the quantification and pheno- probes labeled with digoxigenin–11-dUTP, detection with flu- typing of HCV-infected cells in clinical blood samples. Al- orescent anti-digoxigenin antibody, and FCM analysis of the though HCV infects PBMC, the small proportion of circulating fluorescence signals thus generated (33). Link et al. (184) de- infected cells is not easily detectable by conventional RT-PCR. tected CMV antigen pp65 with immunoenzymatic labeling by These authors detected HCV in PBMC cells of 50% of patients day 4, whereas CMV-DNA was detected by PCR coupled to with chronic hepatitis C tested; the proportion of HCV-in- FCM detection of in situ hybridization 4 h postinfection on fected cells ranged from 0.2 to 8.1%. T-lymphoblastoid cells (MOLT-4). This method also detected Recently, a very sensitive and powerful PCR-driven in situ and quantified mononuclear peripheral blood leukocytes in a hybridization assay has been developed (115). This method patient with active CMV infection (184). Of CMV-DNA-pos- combines the sensitivity of PCR with the specificity of in situ itive mononuclear peripheral blood leukocytes from patients hybridization, allowing rapid and reproducible detection of with active CMV infection, 15% were detected by this method, single-copy proviral DNA or low-abundance viral mRNA in
- 11. VOL. 13, 2000 FLOW CYTOMETRY IN CLINICAL MICROBIOLOGY 177 subsets of cells in suspension. This assay employs PCR- or conventional PCR, nucleic acid expression is not analyzed in- RT-PCR-driven in situ amplification of viral sequences in fixed dependently in each cell). Multiparametric analysis of infected cells in suspension with sequence-specific primers and digoxi- cells allows the detection of single-copy proviral DNA or low- genin-linked dUTP. The product DNA is hybridized with a abundance viral mRNA (225, 244, 245) in specific subsets of fluorescein-labeled oligonucleotide probe, and the cell suspen- cells that can be phenotyped at the same time. Moreover, FCM sion is then analyzed by FCM (245). This method has been is a very useful tool to study the mechanisms of viral latency by used for the detection of HIV-1 DNA and mRNA sequences in association of different stages of the virus cycle and disease individual cells in both cell lines and cells from HIV-1-infected progression with the location of the virus in specific cell pop- patients (243–245). The sensitivity and specificity of this tech- ulations. This can be achieved by using probes to specific nique revealed a linear relationship for the detection of a mRNAs related to different viral replication stages (66). single copy of intracellular proviral DNA over a wide range of Knowledge of cell populations in which the virus is either HIV-1-infected cell concentrations (245). Re et al. (274) ana- replicating or in a latent state has important implications for lyzed the presence of HIV-1 proviral DNA in PBMC from our understanding of virus replication in vivo and progression HIV-infected patients at different stages of the disease by a to disease and hence for therapeutic treatments. Furthermore, PCR-in situ hybridization FCM assay and correlated the data it should be possible to sort these cells for further analysis. with p24 antigenemia and virus isolation. p24 antigenemia Double staining of viral nucleic acids together with viral pro- correlated with the number of CD4-positive cells but was de- teins or surface markers is also possible (33, 66). In comparison tected in only a very low percentage of patients with a cell with the detection of the PCR-driven in situ hybridization by count greater than 200 CD4 T cells per liter. As stated above, fluorescence microscopy (92), in which a large number of mi- detection of HIV antigens is not sensitive enough to detect the croscopic fields must be studied, FCM allows the analysis of low levels of HIV-infected peripheral blood cells in asym- thousands of cells in a few seconds. The speed and automation tomatic HIV-seropositive individuals. The virus was isolated in of these assays make them optimal for the rapid diagnosis of most patients with a T-cell count below 500 per liter but only viral infections. Since these assays can also determine the rel- in 4 of 14 patients with a cell count higher than 500 CD4 T ative number of cells bearing viral genomes and the viral load, cells per liter. In contrast, the PCR-in situ hybridization FCM they could be used to evaluate and monitor antiviral treat- assay revealed detectable levels of proviral DNA in all the ments. Amplification of nucleic acid sequences of viruses from HIV-1-positive subjects studied, even those with a cell count cerebrospinal fluid, blood, or tissues, which are difficult to higher than 500 CD4 T cells per liter. These data underscore isolate by conventional diagnostic techniques, together with the potential of this assay for detecting small numbers of the detection of such nucleic acids by FCM open new possi- PBMC infected with low levels of HIV in asymptomatic indi- bilities in the diagnosis of viral infections and the character- viduals. ization of viral pathogenesis. In HIV-1-infected patients, plasma viral RNA levels (viral load) correlate with disease progression (105, 216, 327). Ac- Serological Diagnosis cordingly, evaluation of this marker by RT-PCR is extensively used to monitor the kinetics of HIV infection and the effects of Bacteria. The identification of pathogens by microsphere antiretroviral treatments (12). However, the RT-PCR assay immunoassays using FCM offers the specificity provided by does not characterize the cell populations contributing to the antibodies coupled with the speed and multiparametric analy- plasma viral load. The PCR-driven in situ hybridization sis provided by FCM. Although these assays can be used to method coupled to the FCM assay described above allows directly detect microbes, they are more useful for detecting simultaneous phenotyping of infected cells and hence quanti- antibodies against microbes in sera obtained from patients. fication of HIV-1 proviral DNA or RNA molecules in specific Generally, either a bacterial antigen preparation or the whole cell populations. Patterson et al. (244) identified and quanti- organism is attached to polystyrene microspheres with a uni- fied cell subsets in the peripheral blood of HIV-1 patients form diameter. The antigen-coated microspheres are incu- expressing HIV-1 RNA by using PCR-driven in situ hybridiza- bated with the sera, the putative human antibodies recognize tion coupled to FCM. They found a good correlation between the antigen, and, in a second step, a fluorescence-conjugated the FCM-determined percentage of HIV RNA-positive cells antibody against human Igs is used for detection. FCM allows and the expected percentage of HIV RNA-positive cells on the this assay to be completed in a short time with excellent sen- basis of plasma viral load, with sensitivities of less than 30 sitivity and reliability. Using this approach, Best et al. (27) copies of RNA per cell and a detection limit of 3.5% HIV-1 detected the presence of antibodies against Helicobacter pylori RNA-positive cells within a heterogeneous population. Simul- in sera from 55 patients. These authors demonstrated that this taneous immunophenotyping by FCM showed that a signifi- method was as sensitive and reliable as ELISA but faster and cantly higher fraction of patients with a high plasma viral load cheaper. The simplicity of the technique and the stability of the (more than 20,000 copies/ml) harbored HIV RNA-positive coated microspheres make the FCM immunofluorescence as- monocytes than did those with a low plasma viral load. Fur- say highly practical for serodiagnosis. thermore, the PCR-driven in situ hybridization and FCM assay The characteristics of FCM allow the detection of more than permits the determination of the presence in HIV-1-infected one antigen at the same time. Thus, simultaneous detection of patients of both latent and transcriptionally active viral infec- multiple antibodies using different-sized particles coated with tion by detection of proviral DNA or viral mRNA. Patterson et different antigens or microbes would make it possible to detect al. (245), testing nine HIV-1-infected patients, observed a sig- multi-infection diseases. Furthermore, using several fluoro- nificant proportion of PBMCs infected with HIV-1, with most chrome-conjugated antibodies against human Igs and differ- of the cells having viruses in a latent state (the percentage of ently sized microspheres, FCM can gather information from PBMCs with proviral DNA varied from 4 to 15% whereas the each different-sized microsphere and particular fluorescence percentage of PBMCs with tat mRNA varied from 1 to 8%). signals. Using Brucella abortus-coated microspheres and Staph- The above FCM nucleic acid detection techniques have sim- ylococcus aureus fixed cells, dual antibody detection in sera and ilar sensitivity to conventional PCR, but with the added bene- milk from cows has been reported by Iannelli et al. (138). In fits derived from expression analysis in individual cells (in this assay, antibodies against the two bacteria are identified on
- 12. 178 ´ ALVAREZ-BARRIENTOS ET AL. CLIN. MICROBIOL. REV. the basis of the altered size of B. abortus cells due to the when a large number of tests is used) compared with routine microspheres. immunofluorescence assays by fluorescence microscopy and Another use of the microsphere fluoroimmunoassay by further stressed that it could be fully automated. FCM is to detect bacterial toxins. In cases where the suspicion Viruses. Some methods have been routinely used to detect of Clostridium difficile infection is high, it is necessary to con- specific antibodies to viral antigens. Among these techniques firm the presence of toxin A in patient samples. Renner (275) are ELISA, complement fixation, indirect immunofluores- reported a microsphere fluoroimmunoassay for C. difficile cence microscopy, and Western blotting. In addition, the de- toxin A using microspheres of two different sizes. The largest tection and quantification of antibodies to viral antigens can be one was coated with polyclonal antibody against toxin A, and carried out by FCM. This technique has been used to detect the smaller one, which was fluorescent, was coated with mono- and quantify antibodies to CMV (209), HSV-1 and HSV-2 (46, clonal antibody against toxin A. In the first step, large micro- 209), HCV (187, 210, 279), and HIV-1 (100, 118, 133, 290, spheres were added to the stool samples, and after incubation, 294). smaller fluorescent microspheres were added. FCM measure- Most of these viral antibody quantifications use a micro- ment allowed the separation and washing steps to be omitted sphere-based immunoassay and FCM. In this assay, polysty- by gating the light scattered by the larger microspheres and rene microspheres attached to viral antigens are used as a measuring only the associated fluorescence from the smaller support for viral antibody detection by FCM. For the simulta- particles. Renner compared this method with the cytotoxin neous detection of two or more viruses, different-sized micro- assay and culture of the organism from patients with C. diffi- spheres, each coated with a specific viral antigen, are used. The cile-associated gastrointestinal disease. The results showed that assay has the advantage of simultaneous detection of multiple the fluoroimmunoassay was less sensitive than the cytotoxin antibodies with high analytic sensitivity. Simultaneous detec- assay and culture but had the same specificity, with the advan- tion and quantification of antibodies to CMV and HSV was tage of being rapid, and, as the author stated “in laboratories achieved by McHugh et al. (209) using this method. Using with a flow cytometer, this offers an alternative method for the particles of different sizes coated with p31, gp120, p24, and laboratory diagnosis of C. difficile-associated gastrointestinal gp41 antigens from HIV-1, Scillian et al. (290) were able to disease.” Tapp and Stotzky (313), using a similar approach to detect and quantify the specific antibodies. An FCM immuno- detect and track the fate of toxins from Bacillus thuringiensis, fluorescence assay (FIFA) with high sensitivity and specificity concluded that FCM is more sensitive and rapid than dot blot was developed by Sligh et al. (294) to detect antibodies to ELISA and that it is possible to process many samples easily. HIV-1 by using HIV-1-infected cell lines. The cells are incu- The detection of antibodies with borreliacidal activity in sera bated with the sera to be tested, and incubation with an FITC- from patients with Lyme disease can help in both early and late conjugated anti-human Ig and FCM allows the quantification serodiagnosis. Using FCM, it is easy to detect the loss of of HIV-1 antibodies in the sera. Based on this assay, Folghera viability of Borrelia burgdorferi incubated with sera from pa- et al. (100) developed a FIFA for the quantitative determina- tients with Lyme disease, using fluorochromes that detect the tion of HIV p24 in HIV-1-infected cells and used the reduction damage caused by antibodies. Callister et al. (43) used acridine in HIV-1 p24 antigen expression in these cells to determine the orange to demonstrate this effect. neutralizing-antibody titers in human sera (100). This method The above work demonstrates the potential of FCM as a also allowed the rapid detection and monitoring of antibodies routine technique in clinical microbiology laboratories for de- to native and recombinant human HIV-1 envelope glycopro- tecting the presence of antibodies against microbes in patient teins following gp160 immunization (118). A new serological sera and for reliably checking the presence of toxins in clinical assay, the recombinant FIFA, was later described (133) for the samples. early detection of HIV-1 antibodies. In this assay, antibodies in Fungi. The use of FCM and the antibodies present in patient sera are evaluated by FCM for binding to the HIV-1 recom- sera to detect fungal pathogens was first described by Libertin binant insoluble forms of proteins Gag-p45, Gag-gp41, and et al. (183) in 1984. Pneumocystis carinii cysts in lung homog- gp160 expressed in insect cells by a baculovirus expression enates from biopsy specimens were detected by these authors system. The sensitivity of this method permits earlier detection using sera from patients and experimentally infected rats. of antibodies after initial infection than for enzyme immuno- Bergbrant (26), using FCM to monitor antibodies against Pity- assays, with a reduction in the “window” period, i.e., the time rosporum ovale in sera from patients with seborrheic dermati- between initial infection and the time of seroconversion, a tis, demonstrated that there was no relationship between this parameter which is critical in infection from blood transfusions microorganism and the illness. (133). Although the tools to directly detect antibodies against fungi The humoral immune response to HCV has been evaluated in patient sera do exist, no work validating the FCM procedure in patients with chronic hepatitis (187). Antibodies to HCV has yet been published. core and NS3 antigens have been quantified using immunoas- Parasites. The presence in patient sera of antibodies to any say beads and FCM (210) in blood donors. The microsphere particular parasite can permit an FCM-based diagnosis of par- assay resulted in increased sensitivity (fivefold higher than that asitism. Martins-Filho et al. (199), using FCM on serum from of reference methods) of HCV detection and resolved a sig- patients chronically infected with Trypanosoma cruzi, devel- nificant proportion of indeterminate samples. A fast FCM as- oped a sensitive method for the immunodetection of anti- say that measures the neutralization of the binding of recom- trypomastigote membrane-bound antibodies. They were also binant HCV E2 envelope protein by antibodies to human cells able to monitor the treatment in order to establish its effec- has also been described (279). This method permits study of tiveness. A similar assay was developed by Cozon et al. (64) the natural immunity to HCV and should be useful in the with Toxoplasma gondii, using fixed tachyzoites and specific development and validation of vaccination protocols. conjugates for different human Ig heavy chains. They were able To conclude, the investigations of Best et al. (27) and Ian- to quantify the amounts of IgM, IgG, and IgA antibodies in nelli et al. (138), among others, offer the possibility of perform- patient sera by measuring the amount of fluorescence bound to ing FCM serodiagnosis in an elegant, rapid, cheap, and precise tachyzoites. The authors stated that the method might offer a manner. The technique is simple and can be used for many major improvement in cost-effectiveness per sample (especially pathogens (including viruses), with an additional possible ad-
- 13. VOL. 13, 2000 FLOW CYTOMETRY IN CLINICAL MICROBIOLOGY 179 vantage of detecting more than one microorganism in a single concentration effects (106), which offer pharmacodynamic data sample. The use of FCM in clinical microbiology laboratories based on the antimicrobial activity, are rarely determined in would allow detection times and costs to be reduced. At clinical laboratories since these determinations (190) are te- present, however, it is not in general use and the setting up of dious and time-consuming. such protocols can be fairly time-consuming. FCM has proved to be very useful for studying the physio- logical effects of antimicrobial agents on bacterial cells due to ANTIMICROBIAL EFFECTS AND SUSCEPTIBILITY their effect on certain metabolic parameters (membrane po- TESTING BY FLOW CYTOMETRY tential, cell size, and amount of DNA). In addition, FCM is a reliable approach for susceptibility testing, offering results in The first experiments in which FCM was used to study the terms of the bactericidal or bacteriostatic effect (86, 108, 198, effects of antimicrobial agents in prokaryotes were carried out 262, 331). at the beginning of the 1980s (136, 302, 304, 306). In the 1990s, The studies by Martinez et al. (198) and Steen et al. (302) in there were interesting advances in this field from microbiology 1982 on the antimicrobial effects on bacteria assayed by FCM laboratories, and the number of scientific articles addressing are now considered classic. They demonstrated that the effect the antimicrobial responses of bacteria (including mycobacte- of -lactam antibiotics on E. coli can be detected by measure- ria), fungi, and parasites to antimicrobial agents increased con- ments of light scattering and DNA content after 10 min of siderably. The development of FCM in combination with fluo- incubation with the drug. Using FCM, Steen et al. (302) rochromes permits the assessment of individual viability and showed the effect of several antibiotics that inhibit protein functional capacity (membrane potential and metabolic path- synthesis (chloramphenicol, erythromycin, doxycycline, and ways) within microbial populations. This allows investigators to streptomycin) on E. coli with the fluorescent DNA probe mith- explore the possibility of performing susceptibility testing ramycin (305). Since then, FCM has been used to measure the within the applications of FCM. Also, the introduction of this effects of different antimicrobial agents on bacteria (Table 2). technique in clinical laboratories for routine susceptibility test- Realizing the potential of FCM in this field, several compa- ing has been proposed, since this approach can be performed nies have developed new products to rapidly perform antibiotic reliably in just a few hours. Several examples of the study of the susceptibility testing in clinical microbiology laboratories. We antimicrobial effect and susceptibility testing by FCM are have used one of these products (Bac-light; Molecular Probes) shown in Table 2. to analyze the reliability of this test in clinical microbiology. Available data clearly demonstrate the utility of this tech- We worked with two strains of Enterococcus, one sensitive to nique to also assay viral susceptibility. Since the pioneer works vancomycin (E. faecalis ATCC 29212) and other resistant (E. of Rosenthal et al. (280) and Pauwels et al. (247) on the use of faecium U2A1), with a vanA element responsible for its van- FCM to study the effect of antiviral agents on herpesvirus and comycin resistance phenotype. In addition, as a control we HIV, FCM has been used by several groups, particularly those included an E. coli isolate showing intrinsic resistance to van- studying these viruses and CMV. The detection and quantifi- comycin. The above-mentioned products are kits with two fluo- cation of viral antigens and viral nucleic acids in combination rochromes that permit the detection of live and dead cells. with antibodies or nucleic acid probes, respectively, or any Bacterial cells were incubated with and without vancomycin for other cellular parameter associated with viral infection have 2 h at the respective MICs of this drug (Fig. 5). Antimicrobial been used in FCM protocols for the in vitro evaluation of effects were detected by measuring the variations in fluores- antiviral-drug activities. In addition, the possibility of on-line cence due to dead cells within 3 h of incubation with the monitoring of the antiviral treatments ex vivo has also been antibiotic. Another advantage of FCM (Fig. 5), as mentioned explored. The latter approach has also been applied to bacte- above, is the visualization of the heterogeneity of the response rial and fungal infections; rapid and sensitive protocols for the of the cells to the antimicrobial agent. This heterogeneity is evaluation of microbial responses to antimicrobial agents are detected by determining the presence of subpopulations that also available. are less susceptible to the antimicrobial agent treatment. Da- In the following sections, the possible uses of FMC in anti- vies and Hixson have recently reported similar results (69). microbial susceptibility testing are discussed according to the Therefore, it is feasible to use FCM and fluorescence probes to type of pathogen involved. perform rapid testing of the susceptibility of bacteria to a panel of antimicrobial agents before choosing the treatment. More- Antibacterial Agents over, resistant subpopulations can be effectively detected, rep- resenting an interesting advantage of FCM that can be suitably Standardized methods for performing in vitro susceptibility exploited in clinical studies (331). testing of bacteria in clinical microbiology laboratories are Measurement of bacterial susceptibility. By using fluores- widespread (98). Qualitative and/or quantitative results are cence probes, FCM measures the light scattering of cells in given on the basis of the size of the zone of inhibition or MIC. suspension and fluorescence of cellular contents or metabolic Despite the automation of MIC-based broth microdilution sys- activity. Thus, the activity of antimicrobial agents can also be tems, an 18- to 24-h incubation period is usually needed before described in terms of changes in cell shape and in fluorescence antimicrobial activity can be quantified. Recently, fluorogenic, (262, 329, 330). In this sense, Walberg et al. (329, 330), and turbidometric, and colorimetric technology has reduced sus- others (108, 200) showed that light scattering is a useful pa- ceptibility testing to 4 to 6 h (83, 98). However, unless the rameter of antimicrobial effects, irrespective of their mecha- bacterial inoculum is quantified, only the bacteriostatic effect, nisms of action. This was demonstrated with two different i.e., the MIC, is generally tested by clinical laboratories. The drugs: ceftazidime, which acts on the bacterial envelope, and MBC, which reflects the bactericidal effect of antimicrobial ciprofloxacin, whose target is a gyrase. Nevertheless, the same drugs, is rarely determined. This requires calculation of bacte- authors (329, 330) used both fluorescence detection and light- rial counts, generally expressed as CFU, which involves bacte- scattering analysis when susceptibility testing was performed rial culture dilutions and subcultures. In addition, neither MIC directly in clinical samples in order to distinguish bacterial cells nor MBC determinations consider the heterogeneity of bacte- from debris and other components. rial populations. Similarly, postantibiotic and subinhibitory Two major categories of fluorochromes have been used to