This paper presents a deep learning-based target detection algorithm for automatic recognition of farmland pests, achieving a high average precision of 90.54%. A labeled pest database was established, and the Faster R-CNN algorithm was improved using an inception network for more accurate pest detection. The study demonstrates that this method significantly outperforms traditional pest identification techniques, enabling more efficient pest management in agriculture.
![International Journal of Artificial Intelligence and Applications (IJAIA), Vol.11, No.3, May 2020
DOI: 10.5121/ijaia.2020.11301 1
APPLICATION OF TARGET DETECTION
ALGORITHM BASED ON DEEP LEARNING IN
FARMLAND PEST RECOGNITION
Shi Wenxiu and Li Nianqiang
School of Information Science and Engineering, University of Jinan, Jinan, China
ABSTRACT
Combining with deep learning technology, this paper proposes a method of farmland pest recognition
based on target detection algorithm, which realizes the automatic recognition of farmland pest and
improves the recognition accuracy. First of all, a labeled farm pest database is established; then uses
Faster R-CNN algorithm, the model uses the improved Inception network for testing; finally, the proposed
target detection model is trained and tested on the farm pest database, with the average precision up to
90.54%.
KEYWORDS
Object detection algorithm, Faster R-CNN, Inception network.
1. INTRODUCTION
For a large agricultural country, the production status of rice, wheat, corn, soybean and other
crops plays an important role in the stable development of the national economy. In recent years,
the government has paid more and more attention to the development of science and technology
in agriculture and has continued to increase investment in this area. However, agricultural
production is still easily affected by the environment, Climate change, environmental pollution,
agricultural disasters and improper management and other factors will cause crop yield
reduction, especially the impact of pests in farmland is more serious. In this case alone, the
annual agricultural economic losses in Europe reach 28.2%, North America reaches 31.2%, and
the economic losses in Asia and Africa are as high as 50%[1]
.Traditional pest identification and
diagnosis methods mainly rely on manual identification[2]
, which is closely related to the
comprehensive quality of professionals. The subjective factors have a great influence on the
accuracy and timeliness of pest control, which is not conducive to the effective work of farmland
pest control. Therefore, it is necessary to study a fast and low-cost automatic detection method of
farmland pests.
Li Wenbin[3]
used a single pixel background segmentation method based on RGB color to
segment rice pest images, and used SVM support vector machine to identify and classify.
Compared with traditional recognition methods, the recognition rate is better, but the number of
pest image samples is small, and the identification type is single. Pan Chunhua[4]
and others used
a grid search algorithm to improve the search efficiency of the image target pest area, and used
SVM to train multiple classifiers to identify four major vegetable pests, with an average
recognition rate of 93%.Yang Guoguo[5]
used Otsu algorithm to find threshold adaptively to
complete image segmentation. The SVM classifier was used to classify and identify the Chinese](https://image.slidesharecdn.com/11320ijaia01-200611050647/85/APPLICATION-OF-TARGET-DETECTION-ALGORITHM-BASED-ON-DEEP-LEARNING-IN-FARMLAND-PEST-RECOGNITION-1-320.jpg)
![International Journal of Artificial Intelligence and Applications (IJAIA), Vol.11, No.3, May 2020
DOI: 10.5121/ijaia.2020.11301 1
APPLICATION OF TARGET DETECTION
ALGORITHM BASED ON DEEP LEARNING IN
FARMLAND PEST RECOGNITION
Shi Wenxiu and Li Nianqiang
School of Information Science and Engineering, University of Jinan, Jinan, China
ABSTRACT
Combining with deep learning technology, this paper proposes a method of farmland pest recognition
based on target detection algorithm, which realizes the automatic recognition of farmland pest and
improves the recognition accuracy. First of all, a labeled farm pest database is established; then uses
Faster R-CNN algorithm, the model uses the improved Inception network for testing; finally, the proposed
target detection model is trained and tested on the farm pest database, with the average precision up to
90.54%.
KEYWORDS
Object detection algorithm, Faster R-CNN, Inception network.
1. INTRODUCTION
For a large agricultural country, the production status of rice, wheat, corn, soybean and other
crops plays an important role in the stable development of the national economy. In recent years,
the government has paid more and more attention to the development of science and technology
in agriculture and has continued to increase investment in this area. However, agricultural
production is still easily affected by the environment, Climate change, environmental pollution,
agricultural disasters and improper management and other factors will cause crop yield
reduction, especially the impact of pests in farmland is more serious. In this case alone, the
annual agricultural economic losses in Europe reach 28.2%, North America reaches 31.2%, and
the economic losses in Asia and Africa are as high as 50%[1]
.Traditional pest identification and
diagnosis methods mainly rely on manual identification[2]
, which is closely related to the
comprehensive quality of professionals. The subjective factors have a great influence on the
accuracy and timeliness of pest control, which is not conducive to the effective work of farmland
pest control. Therefore, it is necessary to study a fast and low-cost automatic detection method of
farmland pests.
Li Wenbin[3]
used a single pixel background segmentation method based on RGB color to
segment rice pest images, and used SVM support vector machine to identify and classify.
Compared with traditional recognition methods, the recognition rate is better, but the number of
pest image samples is small, and the identification type is single. Pan Chunhua[4]
and others used
a grid search algorithm to improve the search efficiency of the image target pest area, and used
SVM to train multiple classifiers to identify four major vegetable pests, with an average
recognition rate of 93%.Yang Guoguo[5]
used Otsu algorithm to find threshold adaptively to
complete image segmentation. The SVM classifier was used to classify and identify the Chinese](https://image.slidesharecdn.com/11320ijaia01-200611050647/75/APPLICATION-OF-TARGET-DETECTION-ALGORITHM-BASED-ON-DEEP-LEARNING-IN-FARMLAND-PEST-RECOGNITION-1-2048.jpg)
![International Journal of Artificial Intelligence and Applications (IJAIA), Vol.11, No.3, May 2020
2
rice locust, with an accuracy rate of 88.3%.Yang Wenhan[6]
used Canny operator and Otsu
threshold segmentation method to segment 15 cotton pests, and used binary tree classification
and support vector machine for classification and recognition, and the recognition effect was
good.
The actual environment of real-life farmland pest classification is very complicated, and there are
many types of pests. In order to achieve more effective and wider application of farmland pest
detection technology, this paper combines deep learning and field pest detection, and proposes a
field pest identification method based on target detection algorithm, which greatly improves the
accuracy of field pest detection.
2. MODEL BUILDING
2.1. Farmland Pest Database
A good sample set is the basis of image recognition research[7]
. Because no public data for
farmland pest detection is currently available, this article has collected 2,472 farmland pest
image samples through the Internet for the goals and tasks of pest recognition. In order to prevent
overfitting due to insufficient data during training, This paper uses the following two data
expansion methods for training samples: (1)In the stage of image preprocessing, some image
space transform operations are used, the original image is randomly rotated, translated,
horizontally flipped, scaled, and sheared. (2)This paper adds salt and pepper noise to the training
image. This method randomly obtains the pixels of the image and sets them as high brightness
points and low gray points. The schematic diagram of sample set expansion is shown in Figure 1.
Figure 1. Image rotation (left) and Noise (right)
Finally, the farmland pest data set containing 10 categories was sorted out, The expanded sample
capacity reached 12474, as listed in Table 1](https://image.slidesharecdn.com/11320ijaia01-200611050647/85/APPLICATION-OF-TARGET-DETECTION-ALGORITHM-BASED-ON-DEEP-LEARNING-IN-FARMLAND-PEST-RECOGNITION-2-320.jpg)
![International Journal of Artificial Intelligence and Applications (IJAIA), Vol.11, No.3, May 2020
3
Table 1. Heading and text fonts
Category Quantity Proportion
cutworms 1213 9.72%
aphidoidea 1220 9.78%
armyw 1202 9.64%
chafer 1205 9.66%
locust 1225 9.82%
mamestra brassicae
linnaeus
1297 10.40%
psilogramma
menephron
1315 10.54%
ostrinia furnacalis 1207 9.68%
clanis bilineata 1285 10.30%
helicoverpa armigera 1305 10.46%
2.2. Object detection model design
2.2.1. Target detection algorithm Faster R-CNN
Before the appearance of Faster R-CNN, R-CNN and Fast R-CNN already existed, but R-CNN
cannot achieve End-to-End training, and Selective Search is more time-consuming. In order to
solve these problems, Shaoqing Ren proposed Faster R-CNN [8]
target detection algorithm in
2016 NIP. The overall structure of Faster R-CNN is shown in Figure 2. Faster R-CNN integrates
feature extraction, proposal extraction, Bounding Box Regression, and Classification into one
network, so the speed of target detection has been greatly improved.
Figure 2. Faster R-CNN overall structure diagram
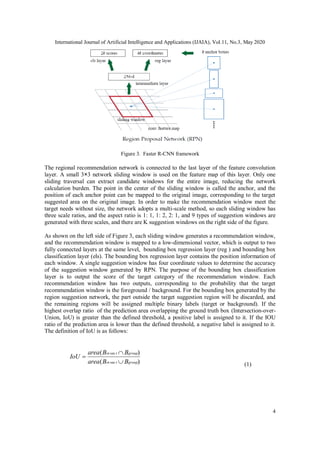
Regional suggestion network (RPN) [9]
is a set that takes an image of any size as input and outputs
a rectangular target recommendation box, as shown in Figure 3.](https://image.slidesharecdn.com/11320ijaia01-200611050647/85/APPLICATION-OF-TARGET-DETECTION-ALGORITHM-BASED-ON-DEEP-LEARNING-IN-FARMLAND-PEST-RECOGNITION-3-320.jpg)
![International Journal of Artificial Intelligence and Applications (IJAIA), Vol.11, No.3, May 2020
5
)( sec grouptin BBarea represents the overlapping area of the target recommendation area and
the ground truth area, )( sec grouptin BBarea represents the union of the target recommendation
area and the ground truth area.
As for the selection of loss function, faster r-cnn is the same as fast r-cnn,it follows r.girsick's
multi task loss rule [10]
, According to the definition of bounding box classification layer and
bounding box regression layer in RPN, the target classification loss function and the target
regression loss function are combined.
),(
1
),(
1
}{},{ tpp i
ireg
i
iregi
i
icls
cls
ii tL
N
pL
N
ppL
(2)
N is the total amount of anchors, i is the index of anchors in a mini-batch, and pi is the predicted
probability of the i-th anchor. If anchor is positive, the ground truth label pi* is 1, and if anchor is
negative, pi* is 0.
ti represents the four parameterized vectors of the coordinates of the predicted rectangular frame,
and ti* is the coordinate vector of the ground truth corresponding to the positive anchor.
Classification loss( clsL ) is the log loss of two categories (foreground and background).
)]1)(1(log[),( iiiiiicls ppppppL
(3)
Return loss is regL :
)(,
iiiireg ttRttL (4)
2.2.2. The problem of gradient disappearance
Gradient disappearance is a common problem in neural networks,Its performance is to make it
difficult for the entire network to adjust the parameters of the previous layers in back
propagation. When the network has more layers, the gradient disappears more obviously. This
problem is not caused by neural networks, but because the specific activation function adopts a
gradient descent method.
For a very simple deep neural network, each layer has only a single neuron. As shown in Figure
4.
Figure 4. Simple deep neural network
Among them, 2,1 is the weight, 2,1 bb is the bias, and C is the cost function.
The result of the cost function C on the partial derivative of the bias b1 is calculated as follows:](https://image.slidesharecdn.com/11320ijaia01-200611050647/85/APPLICATION-OF-TARGET-DETECTION-ALGORITHM-BASED-ON-DEEP-LEARNING-IN-FARMLAND-PEST-RECOGNITION-5-320.jpg)
![International Journal of Artificial Intelligence and Applications (IJAIA), Vol.11, No.3, May 2020
6
4
4433221
1
''''
a
C
zzzz
b
C
(5)
Among them, the output of the jth neuron is jj za , jjjj baz 1 is the weighted input
of the neuron.
When the cost is the sigmoid function, 4/10' reaches the highest. If we use the standard
method to initialize the weights in the network, we will use a Gaussian distribution with a mean
value of 0 and a standard deviation of 1. So all the weights will usually satisfy
1j
, so
4/1' jj z , This creates the problem of gradient disappearance.
In ResNet [10]
, a residual structure is proposed. The residual structure is shown in Figure 5:
Figure 5. residual structure
This residual module is realized through the fast channel, the input and output of this module are
superimposed by a neuron. This superposition has no effect on the amount of network
calculations and parameters, but it improves the model's ability. This residual structure can
transfer the gradient back to the shallow layer through the shortcut without loss, which can
alleviate the gradient disappearance problem.
2.2.3. Inception network
This article considers the use of Googlenet Inception[11]
structure to build an Inception network.
A simple Inception network contains 22 layers of deep network. Because of the problem of
blocked information flow, the optimization ability of the deep model is greatly reduced. To solve
this problem, Googlenet[12]
added two additional Softmax layers to calculate the new loss value,
and then recalculated the network gradient based on the new loss value. Ballester[13]
proposed the
use of Shortcut Connection to reduce the effect of gradient disappearance. This structure can also
reduce the Degradation phenomenon. However, some farmland pests have smaller targets. Using
the simple concept structure cannot solve the problem of pest detection and recognition in
specific situations. Therefore, this paper uses an improved Inception network[14]
for farmland pest
detection,the improved neural network is shown in Figure 6.](https://image.slidesharecdn.com/11320ijaia01-200611050647/85/APPLICATION-OF-TARGET-DETECTION-ALGORITHM-BASED-ON-DEEP-LEARNING-IN-FARMLAND-PEST-RECOGNITION-6-320.jpg)
![International Journal of Artificial Intelligence and Applications (IJAIA), Vol.11, No.3, May 2020
7
Figure 6. Inception network structure diagram
As can be seen from Figure 6, the improved Inception[14]
network uses the Shortcut Connection,
and a deconvolution layer is connected behind the second Inception structure, and the feature
map is doubled to the original one. At the same time, after extracting the feature map of the
seventh perception structure, connecting a full connection layer will reduces the dimension of the
feature map to the feature vector of 1024 dimension, Then the two feature vectors are stitched
into a 2048-dimensional feature vector, and then the 2048-dimensional feature vector is reduced
to a 1024-dimensional feature output as a feature output of the picture. And the Inception
network can directly transfer the gradient from the deep layer of the network back to the shallow
layer. At the same time, the Shortcut Connection can extract the shallow feature map. The scale
of the shallow feature map is 1/8 of the original image. After the deconvolution layer, the feature
map is increased to 1/4 of the original image. This kind of network combining multiple layers of
features and different scales has better ability to detect and recognize targets, and can get better
results in farmland pest recognition.
2.3 Experimental results and analysis
2.3.1. Experimental results
When using the farm pest database detection model to train, in order to ensure that all samples
can be used for training and testing, this paper uses K-fold cross-validation[15]
, where K is
selected 10 and 9 subsets are selected for training Data, 1 subset as test data.
In this experiment, the network training uses the "pre-training + fine-tuning" method, and uses
the pre-trained Inception network model on ImageNet for training fine-tuning. The training
adopts conventional hyperparameter configuration: set the weight decay parameter
(weight_decay) to 0.0005, the momentum coefficient (momentum) to 0.9, the parameter gamma
to 0.1, and the initial learning rate (base_lr) to 0.1.](https://image.slidesharecdn.com/11320ijaia01-200611050647/85/APPLICATION-OF-TARGET-DETECTION-ALGORITHM-BASED-ON-DEEP-LEARNING-IN-FARMLAND-PEST-RECOGNITION-7-320.jpg)
![International Journal of Artificial Intelligence and Applications (IJAIA), Vol.11, No.3, May 2020
8
In this experiment, the Xavier method [16]
is used to initialize the weight parameters, and the
stochastic gradient descent algorithm [17]
(SGD) is used for network training.
The results of this experiment were evaluated using mean Average Precision (mAP). The
formula is as follows:
%100
)(
1
Q
qAP
mAP
Q
q
(6)
Q is the total number of pest categories, and AP(q) is the average accuracy rate of the detection
results of category.
The average accuracy of the experimental results and the final average of the average accuracy
are shown in Figure 7.
Figure 7. Farm pest detection results
From Figure 7, it can be seen that the average accuracy of detection of most types of farm pests
is high, and the average average accuracy can be seen from the broken lines in the figure mAP
reached 90.54%.
2.3.2. Experimental comparison
In order to evaluate the detection ability of the Faster R-CNN+ Improved Inception network
model proposed in this paper, We chose two detection methods for comparison, namely Faster R-
CNN + VGG16 model and Faster R-CNN + Original Inception model.
In this experiment, the network training also uses the "pre-training + fine-tuning" method, and
we adopt the same hyperparameter configuration, initialization algorithm and training algorithm
as in Section 2.3.1.
The classification and recognition results of farmland pest images by various network models are
shown in Table 2:](https://image.slidesharecdn.com/11320ijaia01-200611050647/85/APPLICATION-OF-TARGET-DETECTION-ALGORITHM-BASED-ON-DEEP-LEARNING-IN-FARMLAND-PEST-RECOGNITION-8-320.jpg)
![International Journal of Artificial Intelligence and Applications (IJAIA), Vol.11, No.3, May 2020
9
Table 2. Comparison of test results
Network model mAP Single image test
duration
Model
size
Faster R-CNN+VGG16 87.85
%
0.030s 512M
Faster R-CNN+ Original
Inception
85.63
%
0.025s 160M
Faster R-CNN+ Improved
Inception
90.54
%
0.027s 261M
It can be found that the classification accuracy of the network model used in this paper is
improved by about 3% compared with the classic VGG16 model, and it is improved by 5%
compared to the original Inception network structure. the results show that the model in this
paper has achieved good detection results in the farmland pest data set, and the overall
classification accuracy has been improved.
3. CONCLUSIONS
This paper proposes a farmland pest detection model based on target detection algorithm, this
model is improved on the basis of perception network architecture, and combines with Faster R-
CNN target detection algorithm, and test this model with a established farmland pest database.
The detection accuracy rate of 90.54% was obtained. The experimental results show that the
recognition model proposed in this paper can well complete the task of farmland pest detection,
and improve the detection accuracy and speed. However, the method of this paper still has some
shortcomings. The improved Inception network also needs to design a lot of hyper parameters. In
the experiments, it is impossible to avoid the complicated hyper parameter tuning process, which
brings the risk of over fitting to the recognition model.
ACKNOWLEDGEMENTS
The successful completion of this article is inseparable from the meticulous guidance and
supervision of my tutor, as well as the help and encouragement of the lab brothers and sisters.
Thank everyone.
REFERENCES
[1] Li Y , Xia C , Lee J . Detection of small-sized insect pest in greenhouses based on multifractal
analysis[J]. Optik - International Journal for Light and Electron Optics, 2015, 126(19):2138-2143
.
[2] Geng Ying. Research on crop disease diagnosis based on image recognition[D]. University of
Science and Technology of China, 2009.
[3] Li Wenbin. Research on rice pest image recognition technology based on SVM [D]. Hangzhou
University of Electronic Science and technology, 2015.
[4] Pan Chunhua, Xiao Deqin, Lin Tanyu, et al. Classification and identification of major vegetable pests
in South China based on SVM and regional growth algorithm [J]. Journal of agricultural engineering,
2018 (8): 192-199
[5] Yang Guoguo. Identification and detection of early locust pupae of Chinese rice locust based on
machine vision [D]. Zhejiang University, 2017.](https://image.slidesharecdn.com/11320ijaia01-200611050647/85/APPLICATION-OF-TARGET-DETECTION-ALGORITHM-BASED-ON-DEEP-LEARNING-IN-FARMLAND-PEST-RECOGNITION-9-320.jpg)
![International Journal of Artificial Intelligence and Applications (IJAIA), Vol.11, No.3, May 2020
10
[6] Yang Wenhan. Research on cotton pest identification system based on digital image processing [D].
Sichuan Agricultural University, 2015.
[7] Qin Fang. Insect image recognition based on deep learning [D]. Southwest Jiaotong
University,2018:31-34.
[8] He K, Zhang X, Ren S, et al. Deep Residual Learning for Image Recognition[C]// 2016 IEEE
Conference on Computer Vision and Pattern Recognition (CVPR). IEEE Computer Society, 2016.
[9] Xia Denan. Research on agricultural insect image recognition based on deep learning [D]. Anhui
University, 2019:26-30.
[10] Girshick R. Fast R-CNN[C]// 2015 IEEE International Conference on Computer Vision (ICCV).
IEEE, 2016.
[11] Szegedy C , Liu W , Jia Y , et al. Going Deeper with Convolutions[J]. 2014.
[12] He K , Zhang X , Ren S , et al. Deep Residual Learning for Image Recognition[C]// 2016 IEEE
Conference on Computer Vision and Pattern Recognition (CVPR). IEEE Computer Society, 2016.
[13] Ballester P L , Araujo R M . On the performance of GoogLeNet and AlexNet applied to sketches[C]//
AAAI. AAAI Press, 2016.
[14] Shen Yufeng.Research on Stored Grain Pest Detection Algorithm Based on Deep
Learning[D].2018:36-45.
[15] Hu Juxin,Zhang Gongjie.Selective ensemble classification algorithm based on K-fold cross
validation[J].Science and Technology Bulletin,2013(12):123-125.
[16] Shen H. Towards a Mathematical Understanding of the Difficulty in Learning with Feedforward
Neural Networks[J]. 2016.
[17] Sutskever I, Martens J, Dahl G, et al. On the importance of initialization and momentum in deep
learning[C]// International Conference on International Conference on Machine Learning. JMLR.org,
2013: III-1139.
Authors
Shi Wenxiu, 1995.03.01, School of Information Science and Engineering,University of
Jinan, Postgraduate, Mainly engaged in image processing research.](https://image.slidesharecdn.com/11320ijaia01-200611050647/85/APPLICATION-OF-TARGET-DETECTION-ALGORITHM-BASED-ON-DEEP-LEARNING-IN-FARMLAND-PEST-RECOGNITION-10-320.jpg)