Download to read offline
![Basic terms
• Machine Learning: Machine learning is a subset of artificial intelligence (AI)
that involves algorithms and data that automatically analyze and make decisions
by itself without human intervention.
• Image classification: Image classification is the task of assigning a label to an
image from a predefined set of categories.
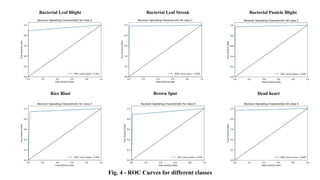
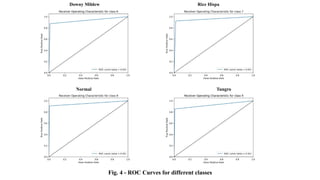
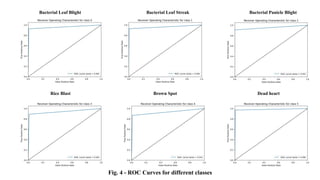
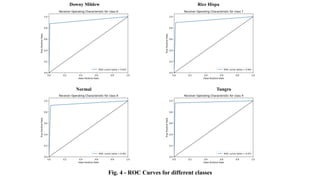
• Performance metrics
• Accuracy: TP/ [TP+FP+FN+FP]
• Precision: TP/ [TP+FP]
• Recall: TP/ [TP+FN]
• F1 score: 2 x [precision x recall] / [precision + recall]
• ROC AUC: Measures the ability of the model to distinguish between classes](https://image.slidesharecdn.com/bam22-075-241107134013-a7aac0c3/85/Application-of-Advanced-Machine-Learning-Methods-for-Crop-Image-Classification-pptx-3-320.jpg)
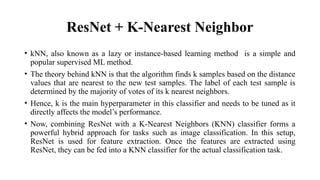
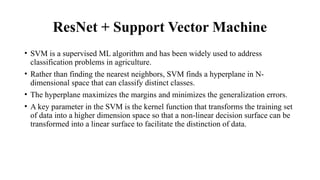
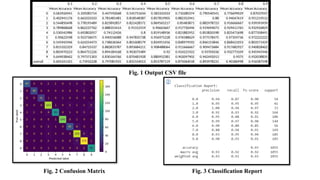
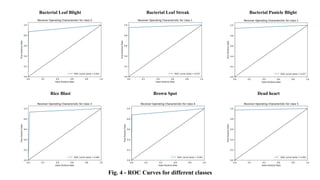
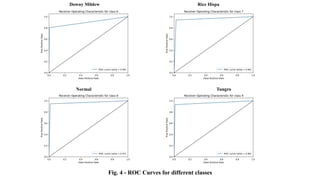
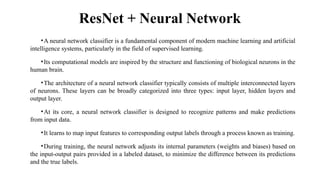
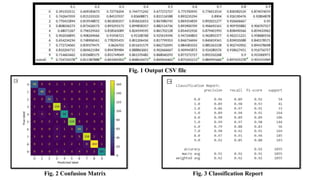
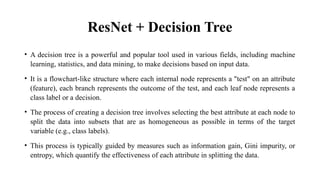
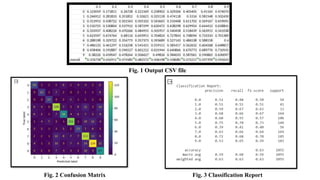
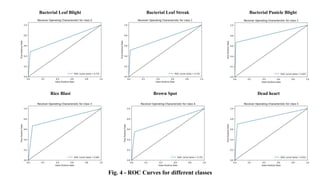
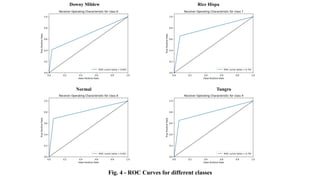
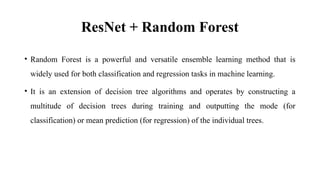
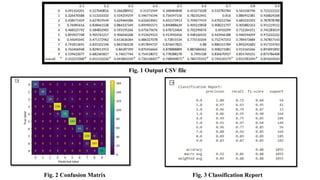
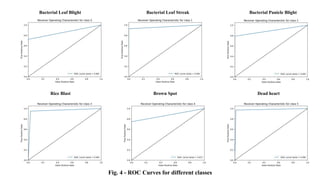
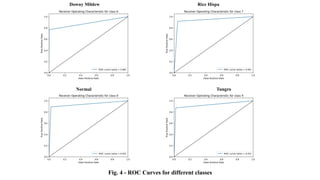


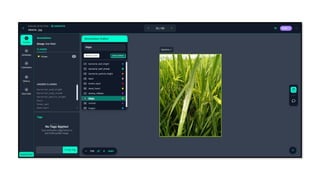
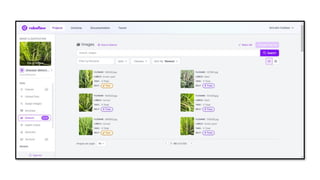
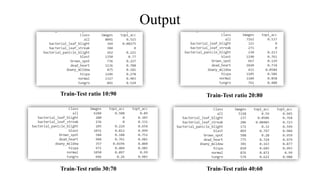
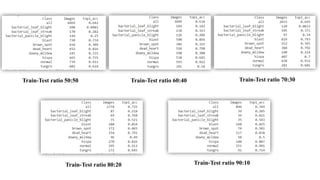


The document discusses advanced machine learning methods for crop image classification, focusing on various algorithms combined with the ResNet architecture. It presents performance metrics for different classifiers like k-nearest neighbors, support vector machines, neural networks, decision trees, and random forests, using a dataset of diseased paddy crop images. Results indicate that the hybrid approaches significantly enhance classification accuracy across multiple disease categories.


![[ppt]](https://cdn.slidesharecdn.com/ss_thumbnails/ppt3441-thumbnail.jpg?width=640&height=640&fit=bounds)
![[ppt]](https://cdn.slidesharecdn.com/ss_thumbnails/ppt2931-thumbnail.jpg?width=640&height=640&fit=bounds)


![[DSC Europe 25] Andrzej Kowalczyk - AI - how to start small and grow in the f...](https://cdn.slidesharecdn.com/ss_thumbnails/oy1zmo94qv6vpcqjvno2-andrzej-kowalczyk-ai-how-to-start-small-and-grow-in-the-future-1-260119121559-cf093b23-thumbnail.jpg?width=640&height=640&fit=bounds)
![[DSC Europe 25] Dubravko Culibrk - Deep Learning for Mammography.pptx](https://cdn.slidesharecdn.com/ss_thumbnails/yiscimuktacgqoiu4dkp-deep-learning-for-mammography-260119121559-aad59182-thumbnail.jpg?width=640&height=640&fit=bounds)
![[DSC Europe 25] Mikhail Rozhkov - AI Product Canvas: From Business Goals to T...](https://cdn.slidesharecdn.com/ss_thumbnails/d53doddtpgfqivmzqel6-mikhail-rozhkov-ai-product-canvas-v1-260121115910-9dd517a7-thumbnail.jpg?width=640&height=640&fit=bounds)

![[DSC Europe 25] Milos Belcevic - Product Professional's Journey to Full-Stack...](https://cdn.slidesharecdn.com/ss_thumbnails/1zovd6fgsycdg4wvgvls-milos-belcevic-product-professionals-journey-to-full-stack-product-developer-260123083019-d993120d-thumbnail.jpg?width=640&height=640&fit=bounds)


![[DSC Europe 25] Laila Kakar - Leveraging AI for Strategic Excellence: Enhanci...](https://cdn.slidesharecdn.com/ss_thumbnails/eykmhrtsqmaaftwkexh7-dsc-lailakakar-1-260119101520-5f3b5616-thumbnail.jpg?width=640&height=640&fit=bounds)


![[DSC Europe 25] Tali Fulman - Guild Meetings, Then What? Building Data Commun...](https://cdn.slidesharecdn.com/ss_thumbnails/fgohhi33rwmhqdowdj5k-tali-fulman-guild-meetings-then-what-building-data-communities-that-actually-ch-260120105855-528492c3-thumbnail.jpg?width=640&height=640&fit=bounds)


