Downloaded 520 times
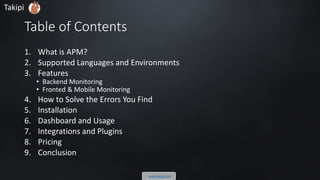

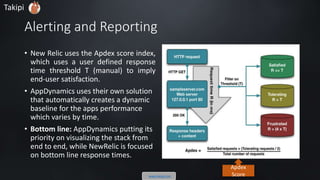
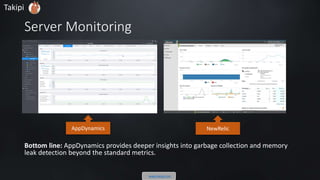
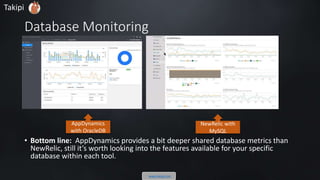
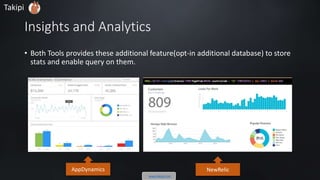

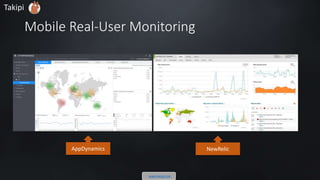
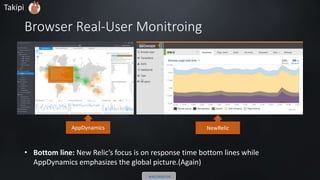


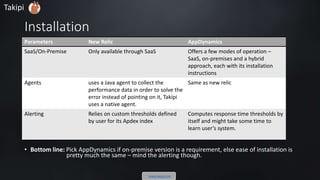
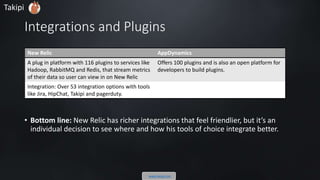
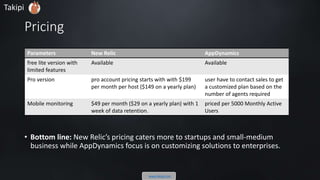
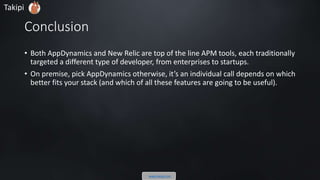


This document compares the application performance monitoring (APM) tools AppDynamics and New Relic. It discusses their supported languages and environments, key features for backend, frontend, and mobile monitoring, how each tool helps users solve errors, pricing differences, and concludes that AppDynamics is better for on-premise use while New Relic caters more to startups and smaller businesses.