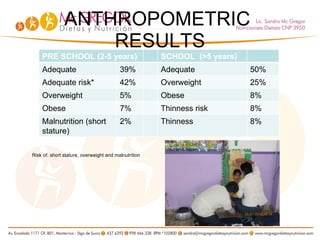
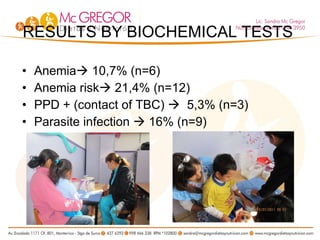
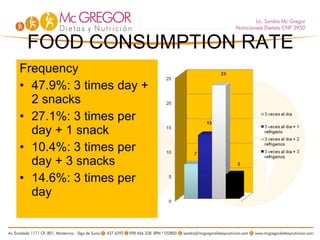
CHILD NUTRITION PILOT PROJECT IEI N° 118 MI MUNDO FELIZ AAHH PUERTO NUEVO CALLAO
Puerto Nuevo Human Settlement
First stage ANTHROPOMETRIC EVALUATION Evaluate the nutritional status of preschool children by anthropometry, anemia dismiss, parasite infection and tuberculosis dismiss.
ANTHROPOMETRIC  RESULTS Risk of: short stature, overweight and malnutrition PRE SCHOOL (2-5 years) SCHOOL  (>5 years) Adequate 39% Adequate 50% Adequate risk* 42% Overweight 25% Overweight 5% Obese 8% Obese 7% Thinness risk 8% Malnutrition (short stature) 2% Thinness 8%
Adequate distribution of weight for height (W/H)we have a greater concentration of appropriate children (88.64%, between +-2 PZ) and it is showed a greater tendency  to overweight/obesity  (11,37%, >+2PZ ) than tomalnutrition (0%, <-2PZ) compared WHO standards. PRE SCHOOL
Distribution of height for age is clear that this child population has a tendency to low normal size (65.81%, median and -1PZ) and short stature risk (25%, -1 and -2PZ), coexisting chronic malnutricion in 9% (>-2PZ).
SCHOOL  Height for age distribution Clear trend towards low normal height, including one case of severe short height.
Height for age by sex Boys have low normal height (-1DS), compared to girls who have far better growth of +1DS.
RESULTS BY BIOCHEMICAL TESTS Anemia   10,7% (n=6) Anemia risk   21,4% (n=12) PPD + (contact of TBC)     5,3% (n=3) Parasite infection    16% (n=9)
The   parents received results of their children together with nutritional counseling and the medical prescriptions for the pharmacological treatment.
BASAL LINE DEFINITION SECOND STAGE Evaluate food quality for children in order to improve their eating habits and determine the behavior of the population in four aspects: food, health, nutrition and food consumption rate.
PRINCIPALS RESULTS 56 families belong to the Project 48 families have been interviewed
HOUSEHOLD BASIC CHARACTERISTICS AND SERVICES Brick / cement block Most common outside wall material Housing
Floor material Drinking water supply Wooden tiles, polished wood Floor tile/ outdoor tile/ wood/ wooden boards cement/false floor
HOME MEMBERS Children under 5 years old 60.4% homes with 1 child/stepchild 39.6% homes with 2 or more children  Family Head Gender 91.7% male  79% high school education level 15% technical education 92% works and,  4% works and studies
Spouses 76% high school education level 15% technical education 69% are housewives 27%  works
HEALTH AND NUTRITION Early Stimulation 70.8% (n=34) received early stimulation  29.2% (n=14) has not received any  Growth & Development Control: CRED 77.1% attend to CRED 23% do not attend
PRINCIPAL ILLNESSES
Social Security 58.3% have access to SIS/AUS 16.7% have access to ESSALUD 25% None
FOOD CONSUMPTION RATE Frequency 47.9%: 3 times day + 2 snacks 27.1%: 3 times per day + 1 snack 10.4%: 3 times per day + 3 snacks 14.6%: 3 times per day
PARTICIPATION IN FOOD ASSISTANT PROGRAMS 69.2% do not have access to the  Glass of Milk  Program while 30.8% do have access 98.7% do not have access to  School Breakfast  Program while 1.3% do have access
FOOD FREQUENCY Spleen/lung Red meat The principal source of protein is meat of chicken, egg, milk and fish. Viscera have less frequency consumption.
Andean cereal Liver
Milk/Yogurt 7 days Beans or alike
Fruit They most frequently eat are banana, tangerine, orange and apple . Vegetables They most frequently eat are pumpkins, carrots, and green leaved vegetables.
THIRD STAGE EDUCATIONAL CLASSES
FIRST CLASS “ I AM CLEAN AND KNOW HOW TO TAKE GOOD CARE OF MYSELF” 32 mothers that attend
RESULTS
SECOND CLASS “ I EAT WELL, DO YOU? 20 mothers that attended
RESULTS
THIRD SESSION COMBINE AND MIX, WHAT AM I MISSING? 21 mothers that attended
RESULTS
Conclusion: pre test correct answers 80.75% while post test correct answers 85.96%. We must continue training the parents to improve the results.  It will be significant if the correct results are above 90%.
DEMOSTRATIONS CLASS N°1 Goals intended: Make mothers and fathers able to prepare meals to prevent chronic malnutrition and anemia in children, expectant mothers and nursing mothers. 19 mothers that attended
 

Child Nutrition Pilot Project

  • 1.
    CHILD NUTRITION PILOTPROJECT IEI N° 118 MI MUNDO FELIZ AAHH PUERTO NUEVO CALLAO
  • 2.
  • 3.
    First stage ANTHROPOMETRICEVALUATION Evaluate the nutritional status of preschool children by anthropometry, anemia dismiss, parasite infection and tuberculosis dismiss.
  • 4.
    ANTHROPOMETRIC RESULTSRisk of: short stature, overweight and malnutrition PRE SCHOOL (2-5 years) SCHOOL (>5 years) Adequate 39% Adequate 50% Adequate risk* 42% Overweight 25% Overweight 5% Obese 8% Obese 7% Thinness risk 8% Malnutrition (short stature) 2% Thinness 8%
  • 5.
    Adequate distribution ofweight for height (W/H)we have a greater concentration of appropriate children (88.64%, between +-2 PZ) and it is showed a greater tendency to overweight/obesity (11,37%, >+2PZ ) than tomalnutrition (0%, <-2PZ) compared WHO standards. PRE SCHOOL
  • 6.
    Distribution of heightfor age is clear that this child population has a tendency to low normal size (65.81%, median and -1PZ) and short stature risk (25%, -1 and -2PZ), coexisting chronic malnutricion in 9% (>-2PZ).
  • 7.
    SCHOOL Heightfor age distribution Clear trend towards low normal height, including one case of severe short height.
  • 8.
    Height for ageby sex Boys have low normal height (-1DS), compared to girls who have far better growth of +1DS.
  • 9.
    RESULTS BY BIOCHEMICALTESTS Anemia  10,7% (n=6) Anemia risk  21,4% (n=12) PPD + (contact of TBC)  5,3% (n=3) Parasite infection  16% (n=9)
  • 10.
    The parents received results of their children together with nutritional counseling and the medical prescriptions for the pharmacological treatment.
  • 11.
    BASAL LINE DEFINITIONSECOND STAGE Evaluate food quality for children in order to improve their eating habits and determine the behavior of the population in four aspects: food, health, nutrition and food consumption rate.
  • 12.
    PRINCIPALS RESULTS 56families belong to the Project 48 families have been interviewed
  • 13.
    HOUSEHOLD BASIC CHARACTERISTICSAND SERVICES Brick / cement block Most common outside wall material Housing
  • 14.
    Floor material Drinkingwater supply Wooden tiles, polished wood Floor tile/ outdoor tile/ wood/ wooden boards cement/false floor
  • 15.
    HOME MEMBERS Childrenunder 5 years old 60.4% homes with 1 child/stepchild 39.6% homes with 2 or more children Family Head Gender 91.7% male 79% high school education level 15% technical education 92% works and, 4% works and studies
  • 16.
    Spouses 76% highschool education level 15% technical education 69% are housewives 27% works
  • 17.
    HEALTH AND NUTRITIONEarly Stimulation 70.8% (n=34) received early stimulation 29.2% (n=14) has not received any Growth & Development Control: CRED 77.1% attend to CRED 23% do not attend
  • 18.
  • 19.
    Social Security 58.3%have access to SIS/AUS 16.7% have access to ESSALUD 25% None
  • 20.
    FOOD CONSUMPTION RATEFrequency 47.9%: 3 times day + 2 snacks 27.1%: 3 times per day + 1 snack 10.4%: 3 times per day + 3 snacks 14.6%: 3 times per day
  • 21.
    PARTICIPATION IN FOODASSISTANT PROGRAMS 69.2% do not have access to the Glass of Milk Program while 30.8% do have access 98.7% do not have access to School Breakfast Program while 1.3% do have access
  • 22.
    FOOD FREQUENCY Spleen/lungRed meat The principal source of protein is meat of chicken, egg, milk and fish. Viscera have less frequency consumption.
  • 23.
  • 24.
    Milk/Yogurt 7 daysBeans or alike
  • 25.
    Fruit They mostfrequently eat are banana, tangerine, orange and apple . Vegetables They most frequently eat are pumpkins, carrots, and green leaved vegetables.
  • 26.
  • 27.
    FIRST CLASS “I AM CLEAN AND KNOW HOW TO TAKE GOOD CARE OF MYSELF” 32 mothers that attend
  • 28.
  • 29.
    SECOND CLASS “I EAT WELL, DO YOU? 20 mothers that attended
  • 30.
  • 31.
    THIRD SESSION COMBINEAND MIX, WHAT AM I MISSING? 21 mothers that attended
  • 32.
  • 33.
    Conclusion: pre testcorrect answers 80.75% while post test correct answers 85.96%. We must continue training the parents to improve the results. It will be significant if the correct results are above 90%.
  • 34.
    DEMOSTRATIONS CLASS N°1Goals intended: Make mothers and fathers able to prepare meals to prevent chronic malnutrition and anemia in children, expectant mothers and nursing mothers. 19 mothers that attended
  • 35.