Download to read offline
![(2002; Judge & Ilies, 2004) have found considerable variation in
job satisfaction over the course of the workday, which our mo-
mentary measure was designed to capture. We also obtained a
measure of general job satisfaction, using five Brayfield–Rothe
items (e.g., “Most days I am enthusiastic about my work”; see
Bono & Judge, 2003; Brayfield & Rothe, 1951). Responses for
these five items were on the same 5-point scale used for momen-
tary job satisfaction.
Work status and interactions. Immediately after being sig-
naled by the PDA, participants were asked to report whether they
were currently at work (yes or no). Next, they responded to the
following question: “When the beep went off, were you interacting
with any of the following?” 1 (supervisor), 2 (coworker), 3 (cus-
tomer/client), 4 (family/friends), 5 (no one), 6 (other).
Affective experiences. Although many taxonomies of affect
and emotion exist in the literature, we were constrained by our
method (i.e., surveys of only 1–2 min in length) to select a small
number of affect terms in attempting to cover the full range of
work-relevant affect and emotion. After reviewing the literature
(Ortony & Turner, 1990; Russell & Feldman Barrett, 1999;
Shaver, Schwartz, Kirson, & O’Connor, 1987) and conducting a
pilot study of workers who reported how frequently they expressed
each of 10 emotions at work, we selected three positive (happiness,
enthusiasm, and optimism) and three negative (anxiety, anger, and
irritation) work-relevant emotions. We excluded some basic emo-
tions (e.g., fear and love) and low-activation affect terms (e.g.,
contentment and calm), deeming them of low relevance to our
study. Participants reported the degree to which they felt the six
selected emotions at each signal.
Because Glomb and Tews (2004) illustrated the importance of
distinguishing between felt emotions and the act of emotional
regulation, we also asked participants about faking (i.e., expressing
an emotion they did not feel) the three positive emotions (happi-
ness, enthusiasm, and optimism) and hiding (i.e., feeling an emo-
tion they were not expressing) the three negative emotions (anxi-
ety, irritation, and anger). Responses for these items were
evaluated on a 7-point scale (1 ϭ none at all, 7 ϭ an intense
amount) for feeling, hiding, and faking.
Stress. We assessed momentary stress by asking participants
to respond to the statement “At this very moment, I am experi-
encing stress.” This measure was intended to capture variability in
stress throughout the day. We also obtained an overall, global
measure of stress, using Motowidlo, Packard, and Manning’s
(1986) four-item measure. Responses for both momentary and
overall stress items were on the same 5-point scale used for job
satisfaction.
Data Analyses
Prior to conducting our analyses of interest, we examined sev-
eral properties of our data. We excluded data from 3 participants
who had responded to fewer than three signals over the course of
the 2 weeks (1 because of job termination, 1 because of PDA
failure, and 1 for an unknown reason). Therefore, the total possible
number of responses was approximately 2,160 (4 responses per
day ϫ 10 workdays ϫ 54 participants ϭ 2,160); however, because
of scheduling the drop-off and pick-up of PDAs, a few participants
responded to surveys on Days 11 and 12, raising the total possible
to 2,266). Participants responded to 1,983 signals (approximately
88% of the total possible), with an average of 37 responses per
participant (ranging from 11 to 42). We excluded data from re-
sponses when participants were not at work (n ϭ 287 episodes)
and for interactions with family or friends (n ϭ 52 episodes),
resulting in 1,653 work-related responses. Our goal was to exam-
ine emotional regulation in a social context. However, in many
cases participants were alone when the signal sounded (n ϭ 764;
48% of work-related responses).4
Thus, our final data set consisted
of 889 responses (52% of total at-work responses; average of 15
per participant) from employees who were at work and involved in
a work-related interaction at the time of the signal.
To form a single leadership score for the supervisor of each
participant, we aggregated the leadership survey responses of all
employees who completed a survey for the target supervisor (av-
erage n ϭ 5 reports per supervisor). Aggregating leadership reports
across followers was deemed justifiable in these data by a signif-
icant ICC-1 value of .29 (p Ͻ .01) and an ICC-2 value of .72. The
ICC-2 value can be interpreted as the reliability of the aggregated
measure of leadership. An average rwg ϭ .84 across groups
(James, Demaree, & Wolf, 1984; assuming a slight negative skew
in the data [Bono & Judge, 2003]) further supports aggregation.
We also created several composite emotion variables. The three
positive (enthusiasm, happiness, and optimism) and three negative
(anger, irritation, and anxiety) emotions were highly correlated
within individuals for both felt emotions and emotional regulation
(average r ϭ .87, .77, .93, and .82, for positive experienced,
negative experienced, positive faked, and negative hidden, respec-
tively). Therefore, we computed four composite emotion variables:
positive emotions experienced, negative emotions experienced,
positive emotions faked, and negative emotions hidden. Principal-
components analysis provided support for creating these compos-
ites, as we found that a single factor explained most of the variance
(ranging from 70%–82%) in each set of related emotions. We also
found that the two types of emotional regulation were highly
related (i.e., faking positive emotions and hiding negative emo-
tions tended to co-occur; r ϭ .88, p Ͻ .01). Because we were
interested in possible differential effects of the two types of emo-
tional regulation, we included faking positive and hiding negative
in our analyses. However, we also formed a total emotional reg-
ulation score by averaging the two types of emotional regulation.
Our hypotheses address two levels of analysis. Within-subject
analyses must be used to link emotional regulation within an
individual with momentary variation in stress and job satisfaction
(Hypothesis 3). In these analyses, data from each individual are
centered around that individual’s mean score, effectively control-
ling for mean differences between individuals in emotional regu-
lation, job satisfaction, and stress. Cross-level (between- and
within-subjects) analyses are used to test our leadership hypothe-
ses (Hypotheses 1, 2, and 4), which posit associations between
supervisory behavior and employees’ emotional experiences.
Therefore, we analyzed our data using multilevel modeling tech-
niques (i.e., HLM 5; Raudenbush & Bryk, 2002).
4
A comparison of affective experiences when interacting with others
versus alone revealed no significant differences in experienced positive and
negative emotions or in emotional regulation.
1361LEADERSHIP AND EMPLOYEE EMOTIONS](https://image.slidesharecdn.com/apl9251357-pdfemotii-130516171431-phpapp01/75/Apl-92-5_1357-pdf-emotii-5-2048.jpg)
![significant effects for emotional regulation (t) on stress were found
after 4 hr (t ϩ 2), and sample sizes were too small to examine t ϩ
3 data (i.e., average 6-hr time lag). Although our data are corre-
lational and preclude firm causal conclusions, these results lend
support to our proposed causal ordering of the variables (e.g.,
emotional regulation 3 stress), as we also tested the reverse
ordering (e.g., stress [t] 3 emotional regulation [t ϩ 1]) and found
no significant effects. The effects of emotional regulation on job
satisfaction appear to be more fleeting than the effects of stress, as
emotional regulation did not predict job satisfaction after 2 hr.
Leadership as buffer. We suggested that leadership behaviors
would buffer employees from the negative effects of emotional
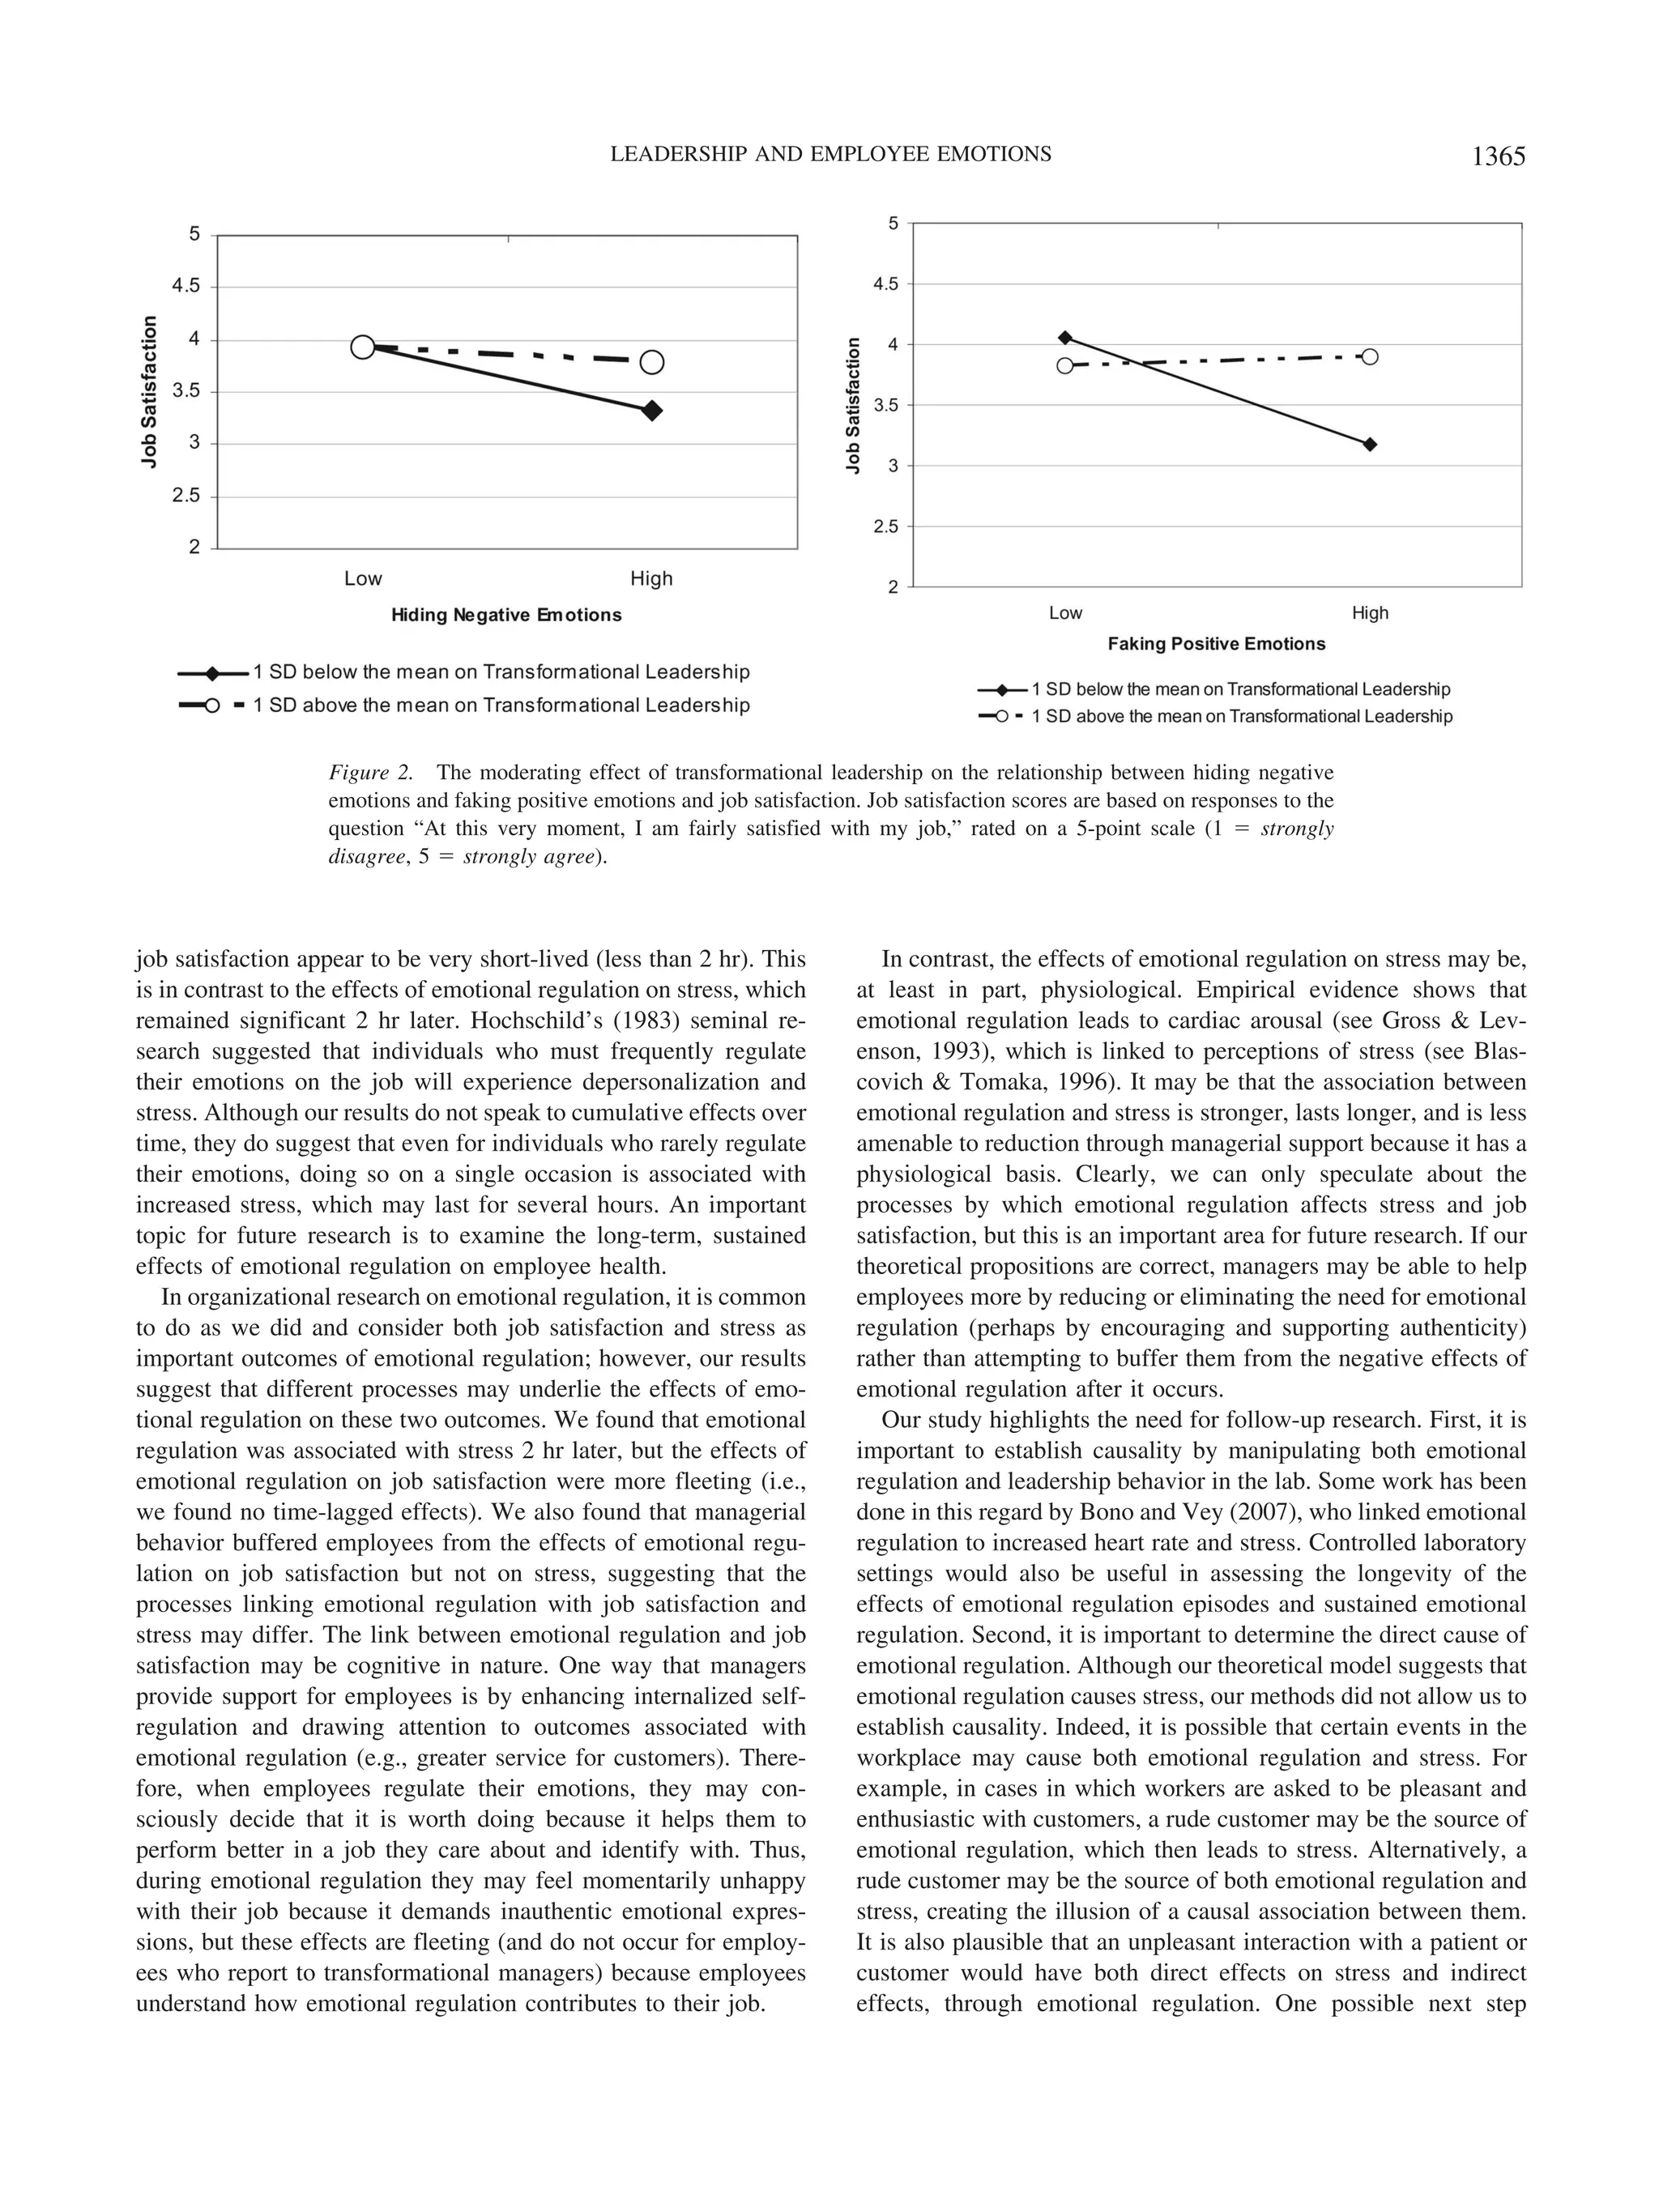
regulation. Results in Table 6 support Hypothesis 4a, revealing a
significant moderating effect for transformational leadership (␥ ϭ
.21, p Ͻ .01) on the association between emotional regulation and
job satisfaction. Figure 2 shows that when transformational lead-
ership behaviors were low (1 standard deviation below the mean),
episodes of emotional regulation were associated with decreased
job satisfaction. However, when transformational leadership be-
haviors were high (1 standard deviation above the mean), there
was little or no association between emotional regulation and job
satisfaction. A different picture emerged when we examined stress
(Hypothesis 4b). Contrary to our expectations, supervisors’ trans-
formational leadership behaviors did not protect employees from
the stress associated with emotional regulation (see Table 6).5
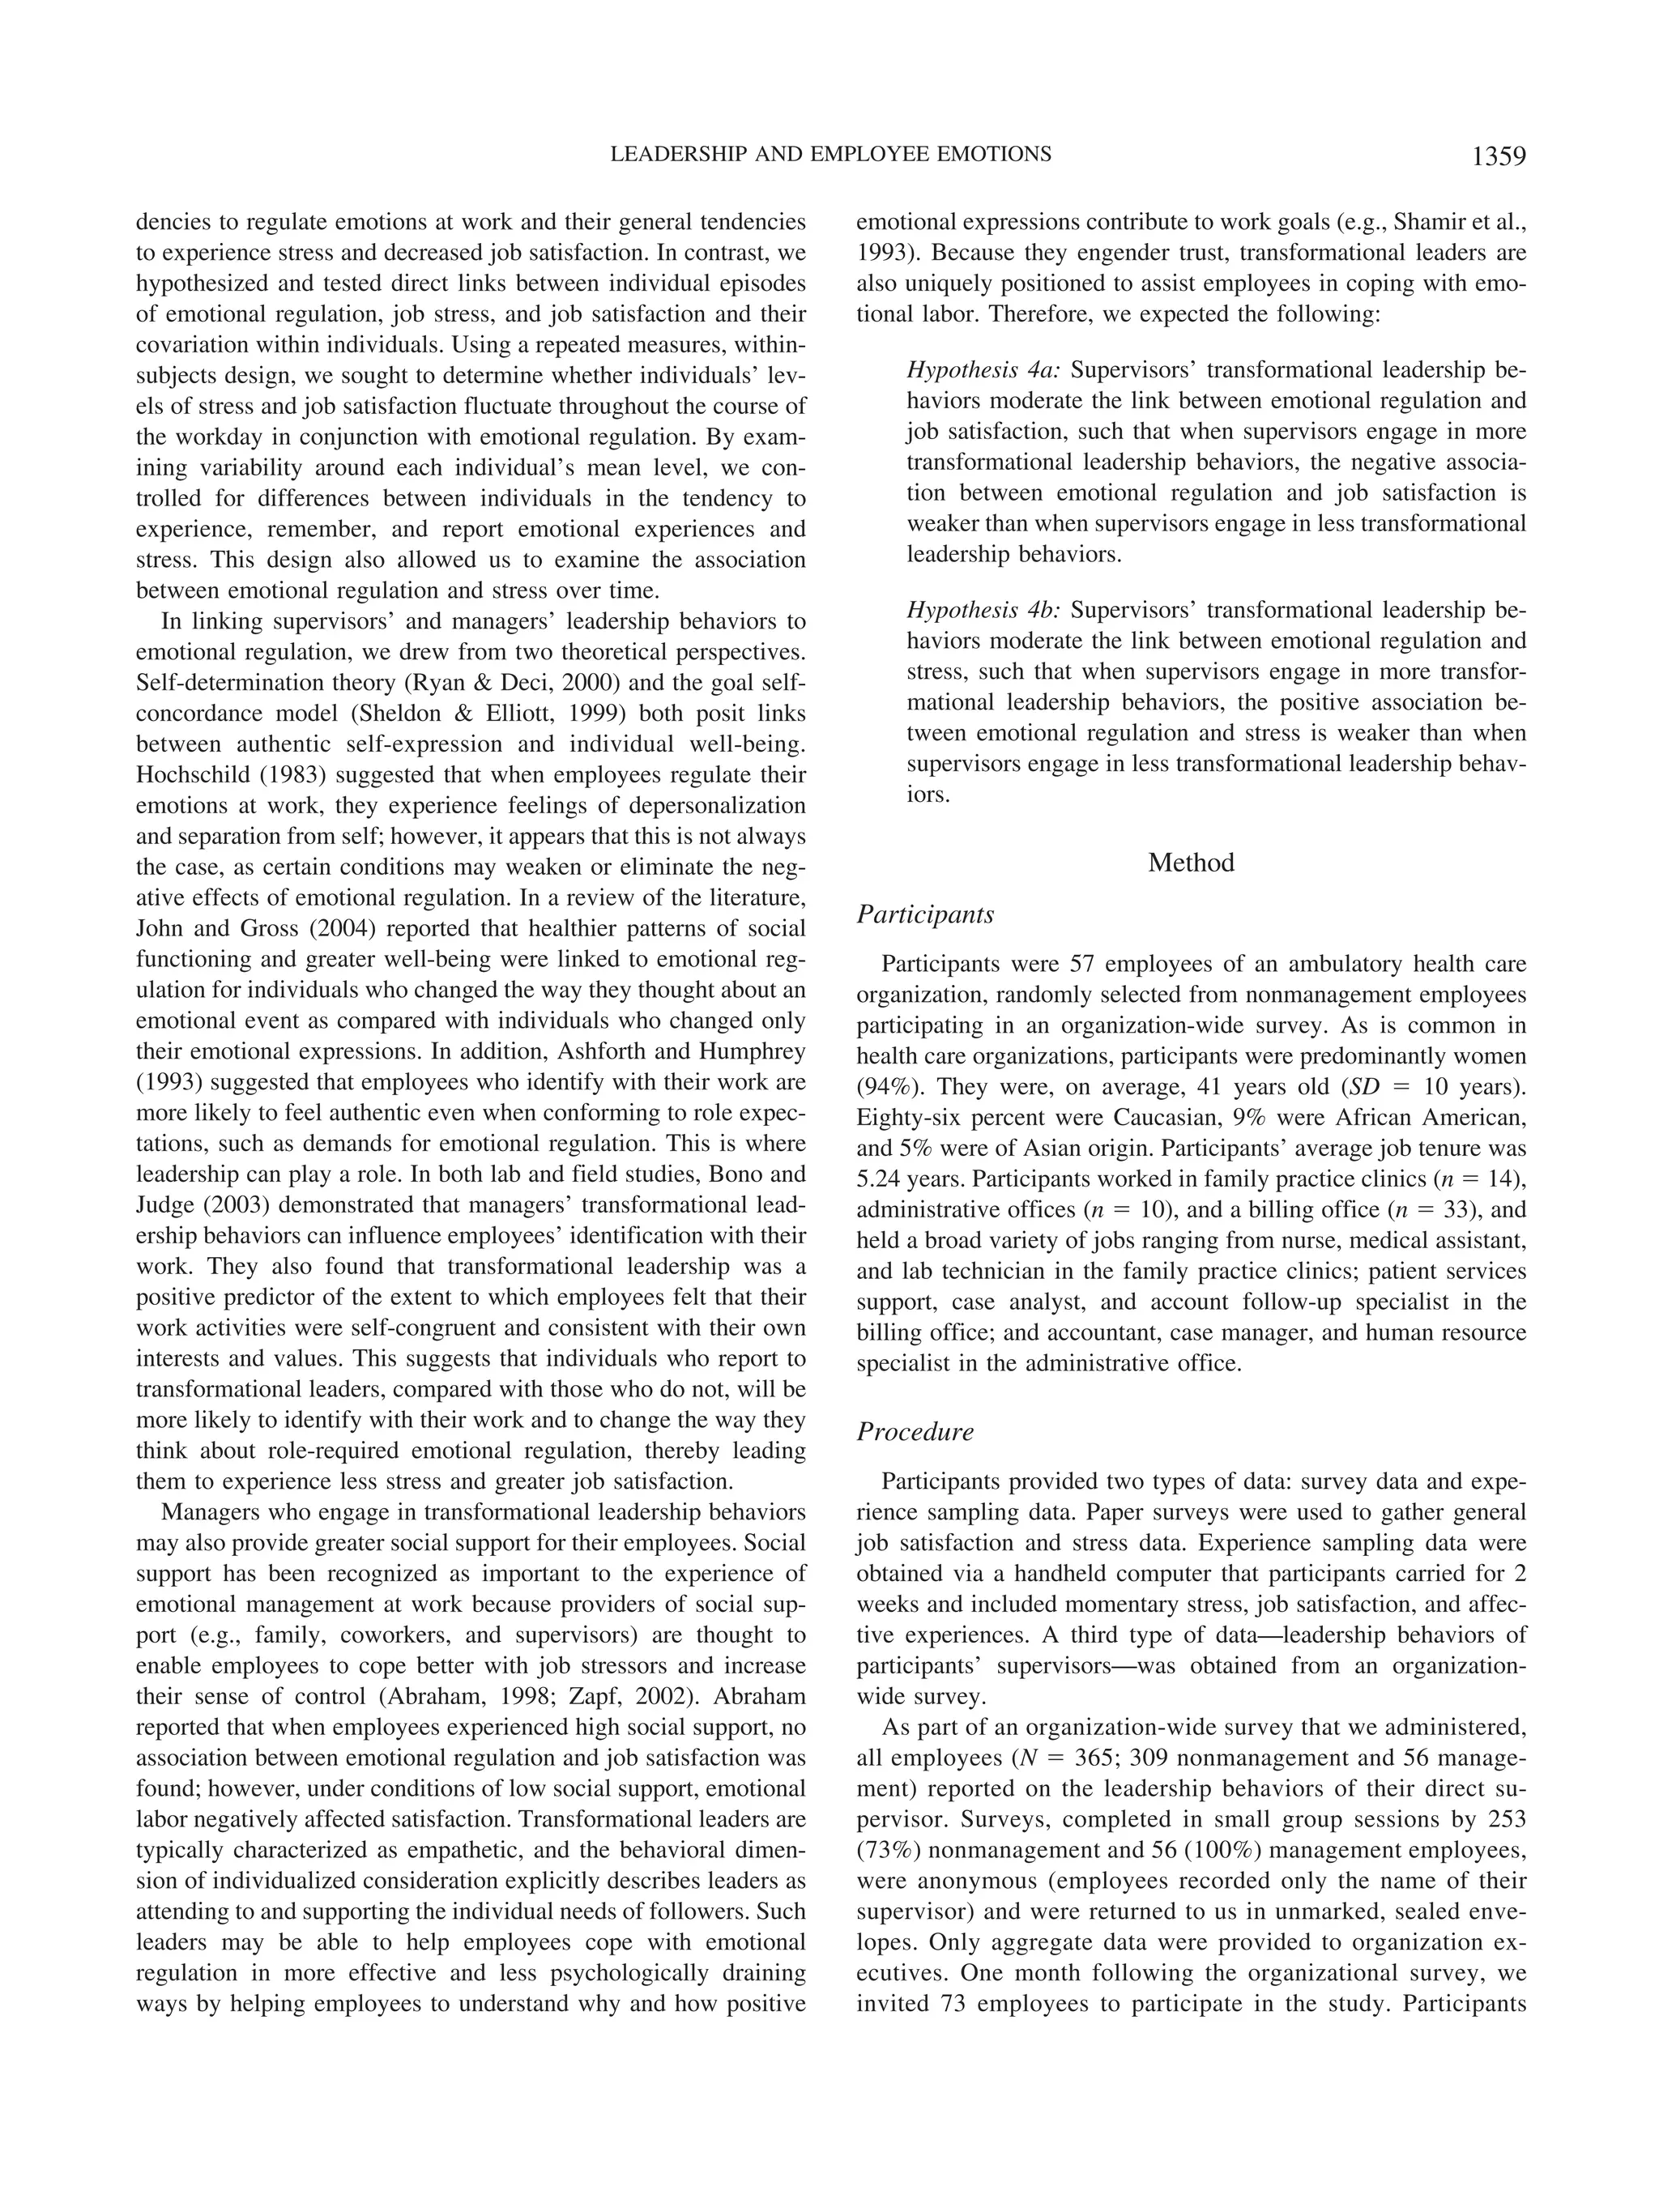
Discussion
According to Brief and Weiss (2002), “the organizational liter-
ature is populated with many more ideas about the leader’s role in
the production of moods and emotions than it is with relevant data”
(p. 289). In this study we focused on the role of managers in
producing employee emotions and in buffering them from the
effects of emotional regulation. With respect to the former, our
results revealed that employees experience less optimism, happi-
ness, and enthusiasm when they interact with supervisors than
when they interact with customers, clients, and coworkers. We also
found that employees who report to supervisors who engage in
transformational leadership behaviors, compared with those who
do not, experience more optimism, happiness, and enthusiasm
throughout the day, including during their interactions with cus-
tomers and coworkers. With respect to the latter, our results
indicate that when employees regulate their emotions at work, they
experience increased stress and decreased job satisfaction. Further-
5
Several participants in our sample reported to the same supervisor,
creating dependencies in the leadership data that were not addressed in our
hierarchical linear modeling analyses and may have potentially produced
biased tests of significance. Thus, we repeated our moderator analyses
involving leadership (see Table 6) using only 1 participant per leader. This
reduced our sample size (from 54 to 27) but eliminated the dependencies.
All significant effects reported in Table 6 remained significant in this
subsample.
Table 3
Analysis of Variance for Felt and Regulated Emotions by Interaction Partner
Emotion
Interaction
partner M SD F
% total variance explained
by interaction partner
Feel positive Supervisor 3.05 1.44 5.74**
36
Coworker 3.75 1.25
Customer-client 3.53 1.58
Other 3.54 1.47
Feel negative Supervisor 2.08 1.35 1.01 4
Coworker 1.83 1.13
Customer-client 1.90 1.14
Other 1.84 1.19
Fake positive Supervisor 1.38 0.91 0.30 6
Coworker 1.47 0.88
Customer-client 1.46 0.85
Other 1.42 0.86
Hide negative Supervisor 1.50 1.01 0.61 3
Coworker 1.62 1.04
Customer-client 1.67 1.05
Other 1.56 0.99
Note. N ϭ 889. dfs ϭ 3, 886. The frequency of interactions was as follows: coworker, 55%; customer-client,
23%; supervisor, 8%; other (which included groups of individuals), 14%.
**
p Ͻ .01.
Table 4
Hierarchical Linear Modeling Estimates of the Associations
Between Supervisors’ Leadership Behaviors and Participants’
Affective Experiences
Affective experiences
Transformational leadership behavior
(␥01)
Coefficient SE t
Feeling positive .54**
.18 2.94
Feeling negative .03 .22 0.15
Faking positive .11 .16 0.73
Hiding negative .18 .20 0.94
Total emotional regulation .14 .17 0.85
Note. N ϭ 54 participants; N ϭ 889 observations. Coefficients for feeling
positive, feeling negative, faking positive, hiding negative, and total emo-
tional regulation were estimated independently. Approximate df ϭ 51.
**
p Ͻ .01.
1363LEADERSHIP AND EMPLOYEE EMOTIONS](https://image.slidesharecdn.com/apl9251357-pdfemotii-130516171431-phpapp01/75/Apl-92-5_1357-pdf-emotii-7-2048.jpg)

This study examined the role of organizational leaders in employees' emotional experiences. Data were collected from healthcare workers through experience sampling over 2 weeks. The results showed that: 1) Employees experienced fewer positive emotions and more negative emotions when interacting with supervisors compared to coworkers and customers. 2) Employees with supervisors high in transformational leadership experienced more positive emotions throughout the workday, including with coworkers and customers. 3) Employees who regulated their emotions experienced decreased job satisfaction and increased stress, but those with transformational leaders were less likely to be negatively impacted.


