
Recommended
More Related Content
What's hot
What's hot (20)
Similar to Aoac international@ sudeb mandal
Similar to Aoac international@ sudeb mandal (20)
Recently uploaded
Recently uploaded (20)
Aoac international@ sudeb mandal
- 1. SPECIAL GUEST EDITOR SECTION Validation and Uncertainty Analysis of a Multiresidue Method for 67 Pesticides in Made Tea, Tea Infusion, and Spent Leaves Using Ethyl Acetate Extraction and Gas Chromatography/Mass Spectrometry BAPPADITYA KANRAR, SUDEB MANDAL, and ANJAN BHATTACHARYYA 1 Bidhan Chandra Krishi Viswavidyalaya, Department of Agricultural Chemicals, Export Testing Laboratory, Mohanpur-741252, West Bengal, India A rapid, specific, and sensitive multiresidue method to determine 67 pesticides in made tea, tea infusion, and spent leaves was developed and validated for routine analysis by GC/MS with an approximately 29 min GC run time. The method was reproducible (HorRat <0.5 at 50 ng/g) when validated at 50 and 100 ng/g. The samples were extracted with ethyl acetate–cyclohexane (9 + 1, v/v), and the extracts were cleaned up by dispersive SPE with primary-secondary amine sorbent + graphitized carbon black + Florisil. The recoveries of all the pesticides were within 70–120% with an RSD of <20% at 50 ng/g and R2 > 0.99. The matrix effect on the signals of the compounds was corrected by using matrix-matched calibration standards. The LOQ met the requirements of the maximum residue limits for pesticides in tea as recommended by the European Union. T ea is a popular beverage throughout the world and is valued for its specific aroma and flavor as well as its health-promoting properties (1). India is one of the major tea-producing countries in the world. Among the factors limiting the quality and quantity of tea production, the role of insect pests is important. Management of pests in tea plantations largely depends on the use of broad-spectrum synthetic chemical pesticides, viz., organophosphates, carbamates, synthetic pyrethroids, and neonicotinoids, etc. In recent years, a number of research papers have dealt with the behavior of different pesticides in tea, focusing on the influence of various manufacturing processes on the residues in made tea and their transfer potential to infusion (2, 3). Residue levels of many pesticides in made tea and its infusion have also been reported (4–8). Trace-level multiresidue analysis of pesticides in tea has become important because of the increasingly stringent regulatory requirements of the European Union (EU) agencies and other tea-importing countries (9). In general, pesticide residue analysis is carried out in a sequence of steps, viz., extraction of target compounds from the sample matrix, cleanup and preconcentration, and, finally, chromatographic analysis (10, 11). Pesticide residue analysis methods have been widely developed to analyze multiresidues in fresh vegetables, fruit, water, honey, etc. (12). Cai et al. (13) applied polyphenylmethylsiloxane as a coating for solid-phase microextraction combined with microwave-assisted extraction to determine the concentrations of organochlorine pesticides in Chinese tea. The extracts were analyzed by GC with an electron capture detector. Huang et al. (14) used acetone–ethyl acetate–hexane for the extraction of pesticides, gel permeation chromatography (GPC) and SPE for cleanup, and GC/MS under retention time-locked conditions for the determination of 102 pesticide residues in tea. Yang et al. (15) proposed the extraction of tea with ethyl acetate–hexane (1 + 3, v/v), cleanup by GPC and SPE, and subsequent identification and quantification of selected pesticides by GC/MS. A literature survey revealed the lack of a suitable cost-effective multiresidue method (MRM) for trace-level quantification of pesticide residues in tea matrix. Mastovska and Lehotay (16) compared the suitability of six organic solvents for pesticide residue analysis and the stability of multiclass pesticides, and they identified acetonitrile as the most suitable extraction solvent for a variety of matrixes. Ethyl acetate is equally acceptable as an extraction solvent for different products (17–19), since it does not pose limitations in terms of lipid coextractives. The aim of this paper was to optimize and validate a multiresidue analysis method based on ethyl acetate–cyclohexane extraction followed by simultaneous determination of 67 pesticides in tea by GC/MS with good selectivity, high sensitivity, and a wide application scope. Experimental Apparatus (a) GC/MS instrument.—The extracts were analyzed with a Varian (Walnut Creek, CA) Saturn 2200 mass spectrometer coupled to a Model 3800 gas chromatograph. The mass spectrometer was used in the full-scan mode with electron KANRAR ET AL.: JOURNAL OF AOAC INTERNATIONAL VOL. 93, NO. 2, 2010 411 Guest edited as a special report on “Novel GC/MS, HPLC/MS, and HPLC-DAD-Based Methods for Determination of Pesticide Residues in Food, Feed, Water, and Soil Samples” by Kaushik Banerjee. 1 Corresponding author’s e-mail: anjan_84@rediffmail.com
- 2. 412 KANRAR ET AL.: JOURNAL OF AOAC INTERNATIONAL VOL. 93, NO. 2, 2010 Table 1. Parameters for the analysis of the selected pesticides by GC/MS Pesticides RT, mina MW m/z for quantification Q1 b Q2 b LOQ, ng/gc LOQ, ng/gd LOQ, ng/ge MRL, mg/kgf Carbofuran 3-keto 7.53 236 178 177 — 5 8 10 0.05 Phorate 9.88 260 75 121 97 15 25 30 0.1 a-HCH 10.08 288 183 181 219 5 7 10 0.02g Fenpyroxymate 10.39 421 213 77 142 6 8 10 0.1 b-HCH 10.65 288 183 181 219 4 5 6 0.02g g-HCH 10.79 288 183 181 219 5 6 9 0.05 Fluchloralin 10.87 355 306 326 63 2 3 3 — Chlorothalonil 11.16 266 266 264 267 2 2 3 0.1 d-HCH 11.47 288 183 181 219 4 5 5 0.02g Cartap hydrochloride h 11.62 274 149 103 70 2 2 3 0.1 Dichlorvos 11.63 220 109 185 79 3 3 3 0.1 Acetochlor 11.91 270 223 146 59 5 5 6 0.01 Alachlor 12.21 270 188 160 146 3 7 11 0.01 Oxadiargyl 13.06 341 149 — — 17 20 21 0.05 Malathion 13.27 330 173 125 93 9 11 17 0.05 Chlorpyrifos 13.53 349 314 197 97 1 2 2 0.1 Phorate sulfone 13.53 292 97 + 125 153 65 6 13 21 0.1i Phorate sulfoxide 13.29 276 199 + 125 97 153 7 19 28 0.1i Aldrin 13.57 362 66 263 79 16 16 18 0.02j Thiobencarb 13.62 258 100 125 72 4 3 4 — Tetraconazole 13.87 372 336 — 5 4 5 0.02 Dicofol 14.22 370 139 251 141 4 4 4 20 Pendimethalin 14.80 281 252 162 191 4 4 5 0.1 Fipronil 15.00 437 367 369 — 2 3 5 — o,p¢-DDE 16.169 316 318 246 248 2 2 3 — Paclobutazole 16.38 294 238 236 125 10 11 12 — Butachlor 16.48 311 176 + 160 57 — 6 8 13 — a-Endosulfan 16.63 404 241 + 239 265 — 6 9 10 30k Hexaconazole 17.16 314 214 216 82 10 9 10 0.05 Pretilachlor 17.21 311 238 162 176 2 2 2 — Metomino strobin 17.39 284 191 + 196 238 — 2 2 3 — p,p¢-DDE 17.65 316 318 246 248 2 2 2 0.2l Dieldrin 17.72 381 79 81 77 12 18 25 0.02j Tricyclazole 17.76 189 189 162 135 25 27 41 — o,p¢-DDD 17.79 318 235 237 165 3 2 4 0.2l Oxyfluorfen 17.84 362 252 361 300 4 4 5 0.05 Buprofezin 17.84 305 105 + 106 + 172 83 104 10 15 20 0.05 Flusilazole 17.89 315 233 + 234 206 315 12 14 10 0.05 Chlorfenapyr 18.25 408 364 328 — 5 4 5 50 Endosulfan alcohol 18.85 361 69 + 229 259 237 40 45 50 — Chromafenozide 18.906 395 175 — — 40 50 50 — b-Endosulfan 19.02 404 241 + 195 + 159 239 243 25 40 40 30k Ethion 19.21 384 231 153 125 4 3 4 3 p,p¢-DDD 19.23 318 235 237 165 2 2 2 0.2l o,p¢-DDT 19.27 352 235 237 165 2 2 2 0.2l
- 3. impact ionization. The system was equipped with a Model 1079 programmed temperature vaporizer injector, electronic flow control, and autosampler (CTC Combipal). The injection liner (single-gooseneck, 3.4 mm id) contained a plug of Carbofrit (Restek, Bellefonte, PA) to allow 8 mL injections of the ethyl acetate extracts. Varian MS Workstation software (Version 5.1.2600.2180) was used for instrument control and data analysis. (b) Low-volume concentrator.—The samples were evaporated using a Turbo Vap LV from Caliper Life Science (Hopkinton, MA). (c) Centrifuge.—The extracts were centrifuged using a high-speed, refrigerated centrifuge, Model Avanti J-30I (Beckman Coulter, Fullerton, CA). The rotor heads were suitable for holding eight 50 mL (JA-30.50 T1) and eighteen 10 mL (JA-21) tubes. (d) Analytical balance.—A top-loading balance with digital display (Sartorius CP 225D; Goettingen, Germany) was used to weigh the samples and powder reagents. (e) Vials and vessels.—For both the extraction and dispersive SPE (d-SPE) cleanup steps, fluorinated ethylene propylene (FEP) centrifuge tubes (Nalgene, Rochester, NY) KANRAR ET AL.: JOURNAL OF AOAC INTERNATIONAL VOL. 93, NO. 2, 2010 413 Table 1. (continued) Pesticides RT, mina MW m/z for quantification Q1b Q2b LOQ, ng/gc LOQ, ng/gd LOQ, ng/ge MRL, mg/kgf Triazophos 19.83 313 161 77 97 25 28 35 — Benalaxyl M 20.17 325 148 206 — 4 5 5 0.1 Endosulfan sulfate 20.33 420 387 272 237 16 16 20 30k Propiconazole 20.58 342 259 69 173 20 20 22 — p,p¢-DDT 20.688 352 235 237 165 6 5 6 0.2l Tebuconazole 21.07 307 250 125 70 15 22 26 0.05 Propargite 21.12 350 173 135 81 9 10 13 5 TPP (IS) 21.25 326 325 326 — — — — — Carbosulfan 21.87 380 160 118 135 20 21 25 0.1 Bifenthrin 22.18 422 181 166 165 4 4 4 5 Anilophos 22.67 368 226 334 228 16 16 20 — Fenazaquin 22.70 306 145 144 160 7 6 7 0.01 Tetradifen 23.12 356 356 + 159 + 111 229 227 50 48 50 0.05 Phosalone 23.15 378 182 184 — 13 16 17 0.1 Cyhalofop butyl 23.50 357 357 256 229 25 25 30 0.05 Amitraz 23.63 293 162 121 147 17 20 25 0.1 l-Cyhalothrin 23.67 449 197 181 208 6 5 6 1 a-Cypermethrin 26.09 415 181 183 185 10 22 25 0.5 Etofenprox 26.20 376 163 164 — 9 10 13 0.01 Fenvalerate I+II 26.99, 27.28 419 125 + 225 167 — 25 35 40 0.05 G-Fluvalinate 27.13 503 250 + 181 252 55 30 37 42 — Difenoconazole 27.82 406 323 325 152 40 50 50 0.05 Deltramethrin 27.86 503 253 181 77 20 45 50 5 a RT = Retention time. b Q1 and Q2 are the qualifier ions. c LOQ in tea infusion. d LOQ in spent leaves. e LOQ in made tea. f MRL established by EU Regulation (EC) No. 396/2005 updated on 05/20/2009. g Sum of HCH isomers except g isomer. h Quantified as nereistoxin. I Sum of phorate, is oxygen analogs and their sulfones expressed as phorate. j Sum of aldrin and dieldrin. k Sum of a, b isomers and endosulfan sulfate. l Sum of p,p¢-DDT; o,p¢-DDT; p,p¢-DDE; and p,p¢-DDD.
- 4. 414 KANRAR ET AL.: JOURNAL OF AOAC INTERNATIONAL VOL. 93, NO. 2, 2010 noisufniaetdna,aetedam,sevaeltnepsmorfsedicitseptsetehtfoEMdna,taRroH,DSR,yrevoceR.2elbaT edicitseP faeltnepSaetedaMnoisufniaeT g/gn05ag/gn001ataRroHb%,EMcg/gn05ag/gn001ataRroHb%,EMcg/gn05ag/gn001ataRroHb%,EMc otek-3narufobraC)50.5(43.89)64.01(71.5902.083.5–)00.01(0.001)79.11(71.6904.083.4–)33.8(66.201)46.6(76.10133.067.3– etarohP)24.8(43.77)47.5(76.5743.064.0)22.9(0.97)94.5(38.6773.067.9)56.6(66.18)04.9(71.0872.031.8 aHCH-)04.01(66.28)55.5(71.8724.011.42–)51.21(66.48)14.4(71.9794.041.32–)20.21(43.78)78.9(05.2884.072.6– etamyxorypneF)73.21(43.68)06.21(00.9905.035.31–)62.11(0.98)04.51(76.00154.045.81–)40.01(0.29)05.11(38.30104.015.8– b-HCH)94.11(43.48)34.41(23.1964.088.4–)20.21(66.68)37.41(52.3984.068.2–)09.11(43.98)01.51(78.4984.083.6– gHCH-)44.21(0.19)30.9(26.6905.093.6–)30.21(0.39)87.01(31.8984.029.4–)25.9(0.69)61.01(27.9983.087.21– nilarolhculF)20.11(0.38)12.9(71.6944.014.8–)90.9(0.68)73.9(05.7973.041.7–)10.01(66.98)66.01(00.9904.026.7– linolahtorolhC)12.01(0.58)98.01(38.0714.075.91)24.11(66.88)13.01(71.2764.064.32)64.11(0.19)51.01(76.3764.061.72 dHCH-)13.9(66.801)95.7(05.11173.022.9–)13.21(66.111)86.9(76.31194.024.7–)97.11(0.411)03.8(32.51174.024.9– patraC edirolhcordyh )53.01(66.97)34.31(71.2924.068.31–)16.11(0.28)59.31(33.3974.077.21–)41.21(66.48)78.51(00.6894.012.11– sovrolhciD)20.11(66.38)42.11(71.8744.084.53–)48.01(43.58)50.21(71.9744.056.43–)97.9(66.88)30.9(33.1893.066.03– rolhcotecA)89.01(43.07)24.8(05.7744.066.71–)09.8(66.07)67.9(00.8763.031.71–)28.4(0.37)71.6(00.0891.088.21– rolhcalA)15.11(66.27)05.11(33.7864.046.7–)12.01(43.17)78.01(05.9814.053.5–)12.11(60.47)06.8(00.2954.043.41– lygraidaxO)94.8(66.57)56.3(76.3743.072.42)50.21(43.87)52.4(05.5784.063.72)98.01(66.18)66.4(38.7744.020.31 noihtalaM)91.11(43.201)89.11(51.80154.029.9–)15.11(66.401)60.21(34.90164.078.6–)76.9(66.701)65.01(89.01193.076.12– sofiryprolhC)10.21(66.77)59.11(76.4984.089.1–)30.9(0.38)64.21(51.6963.044.0–)80.8(43.68)38.01(09.7923.099.11– enoflusetarohP)59.11(43.08)59.11(00.0884.080.41–)37.8(40.28)16.21(76.0853.063.31–)96.11(7.38)54.11(71.2874.034.64– edixoflusetarohP)28.6(43.47)45.31(76.4772.015.72–)65.7(43.67)37.31(75.5703.036.62–)98.4(02.08)35.01(70.7702.063.55– nirdlA)58.11(0.87)30.81(33.5784.080.8–)90.11(0.08)08.94(38.6754.052.6–)25.21(66.08)76.51(04.8705.038.32– bracneboihT)97.11(0.67)97.9(89.6874.017.6–)60.21(64.97)97.01(71.7884.015.6–)49.11(8.28)72.11(53.8884.081.4– elozanocarteT)80.9(0.28)65.01(01.9963.001.21–)64.01(43.48)13.31(50.20124.094.9–)16.7(0.88)91.21(71.7813.069.06– lofociD)16.11(66.38)93.9(23.3874.095.11–)30.11(66.58)20.01(27.4844.001.01–)24.01(43.88)22.8(24.6824.047.8– nilahtemidneP)01.21(43.49)47.01(72.30194.046.5–)50.01(43.79)82.01(78.30104.099.1–)45.21(43.89)71.9(39.40105.009.0– linorpiF)21.21(0.97)04.6(05.9794.013.22–)12.11(66.08)21.7(71.1854.026.03–)85.11(66.18)20.9(38.3874.044.83– p,o¢EDD-)27.6(66.58)62.9(74.4872.088.01–)48.7(66.78)20.11(28.5813.064.9–)02.7(0.09)79.9(59.9892.001.6– elozatubolcaP)36.9(43.07)95.41(76.6893.072.62–)10.21(43.27)56.51(38.7884.082.52–)63.01(66.57)10.51(33.1924.070.41– rolhcatuB)17.8(43.09)19.51(08.8853.068.62)87.8(66.29)98.11(53.0953.070.92)05.9(0.69)96.41(80.3983.061.91 anaflusodnE-)36.01(66.38)60.4(75.9834.019.0–)86.9(0.68)21.6(38.0993.094.5–)43.4(66.09)08.4(89.2971.057.3– elozanocaxeH)87.7(43.69)51.01(05.8913.080.5–)73.21(0.29)22.01(89.8905.026.4–)48.11(67.89)13.12(57.00184.046.3–
- 5. KANRAR ET AL.: JOURNAL OF AOAC INTERNATIONAL VOL. 93, NO. 2, 2010 415 (.2elbaTdeunitnoc) edicitseP faeltnepSaetedaMnoisufniaeT g/gn05ag/gn001ataRroHb%,EMcg/gn05ag/gn001ataRroHb%,EMcg/gn05ag/gn001ataRroHb%,EMc rolhcaliterP)48.01(0.07)46.41(55.5744.038.42–)15.11(43.07)24.41(30.7764.053.32–)13.21(66.17)23.41(87.8794.020.23– nibortsonimoteM)44.9(43.07)28.01(88.0783.074.92–)21.01(66.07)49.11(85.2714.087.72–)07.8(43.07)83.9(26.5753.091.14– elozalcycirT)52.21(0.19)68.51(23.9994.051.32–)20.11(66.39)11.81(83.9944.077.9–)56.9(0.001)33.31(53.30193.088.82– p,p¢EDD-)52.9(66.38)88.5(05.5873.099.5–)17.6(06.68)27.5(58.6872.015.4–)09.8(49.98)29.7(56.8863.057.62– nirdleiD)57.01(43.87)86.9(77.9834.076.42–)13.01(0.07)29.5(02.2714.000.9–)22.8(0.57)18.7(32.4733.060.1– p,o¢-DDD)71.6(43.09)12.01(07.6852.099.02–)50.6(43.29)65.11(81.7842.018.23–)43.7(0.69)60.21(01.9892.040.82– nefroulfyxO)11.21(0.001)19.31(36.7994.070.51–)47.11(66.101)50.41(86.7974.032.51–)73.6(43.89)98.31(34.9962.003.6– nizeforpuB)40.21(0.27)10.41(76.1894.078.81–)15.01(66.37)42.21(33.3824.022.71–)12.21(4.67)46.9(05.6894.053.62– elozalisulF)31.21(5.401)68.01(00.80194.055.7–)43.21(3.701)95.21(71.11105.052.8–)09.11(9.901)55.21(38.31184.057.02– rypanefrolhC)27.8(0.98)96.41(00.60153.004.9–)29.5(0.19)34.41(36.70142.010.8–)26.9(2.39)20.51(79.90193.053.72– lohoclanaflusodnE)56.7(66.67)58.9(33.3713.028.82–)97.8(48.77)91.01(28.4753.093.72–)65.5(48.08)88.01(89.4722.095.41– edizonefamorhC)48.7(66.701)14.41(05.80113.064.42–)70.01(0.011)12.51(33.90104.048.55–)07.9(43.101)24.31(38.11193.043.33– b-naflusodnE)42.11(43.87)60.51(05.8754.052.32–)44.21(43.08)38.41(55.9705.022.22–)25.01(0.28)20.31(27.1824.089.14– noihtE)08.8(43.98)77.01(76.4953.083.5–)04.01(43.19)77.01(38.5924.022.4–)77.9(89.69)67.21(00.8993.030.74– p,p¢-DDD)02.8(0.38)89.31(05.8933.086.01–)13.01(0.68)48.41(38.9914.091.91–)30.11(43.98)56.41(05.10144.057.11– p,o¢-TDD)25.01(66.68)75.01(05.2924.053.4–)25.11(43.98)30.11(05.3964.013.3–)43.21(30.18)40.31(33.5905.043.91– sohpozairT)44.11(43.49)91.41(71.6764.084.43–)00.01(66.69)12.41(05.7704.033.33–)42.9(65.98)28.11(76.1873.064.8– MlyxalaneB)13.21(0.78)83.71(39.4794.082.91–)59.9(66.98)12.31(34.6704.066.71–)27.6(33.29)79.61(35.8772.095.01– etaflus-naflusodnE)72.21(43.37)61.11(24.3894.052.52–)60.11(0.67)87.11(33.4844.034.42–)86.8(43.97)35.9(02.6853.006.2– elozanociporP)16.11(43.87)45.11(33.30174.067.2–)53.9(66.08)76.11(05.40183.066.1–)49.7(43.48)28.9(38.60123.039.4– p,p¢-TDD)03.8(43.78)72.51(33.60133.051.4–)00.8(0.19)24.51(76.70123.059.2–)25.7(43.49)66.11(05.31103.058.15– elozanocubeT)74.9(00.09)78.41(00.5983.069.02–)05.21(66.29)11.31(71.6905.099.91–)92.9(66.59)41.41(38.9973.079.51– etigraporP)23.01(48.97)15.3(05.8714.088.82–)45.21(69.08)00.5(76.9705.028.72–)42.11(06.19)83.3(00.2854.032.8– naflusobraC)84.8(43.68)60.11(33.4943.013.32–)98.01(66.78)59.11(05.5944.063.22–)93.11(66.09)58.21(20.9964.003.02– nirhtnefiB)72.7(00.57)72.5(89.9892.081.7–)77.9(61.77)38.4(04.1993.027.5–)67.5(05.08)32.8(23.4932.071.41– sohpolinA)73.21(00.68)88.5(75.2805.091.13–)94.21(43.88)69.4(56.3805.092.03–)85.8(43.09)44.5(05.5843.033.52– niuqazaneF)12.01(66.401)74.8(73.6814.031.22–)86.41(66.701)73.9(57.7893.088.02–)25.11(0.69)74.8(86.0964.063.32– nefidarteT)71.11(43.97)61.21(00.6854.084.9–)33.21(0.18)62.31(78.6805.075.8–)70.9(66.18)31.21(20.1963.030.03– enolasohP)45.8(43.86)58.11(87.1943.073.32–)36.9(43.07)99.21(58.2993.084.22–)28.4(0.37)51.01(09.4991.060.71–
- 6. of 10 and 50 mL capacity were used. Standard 1.8 mL dark glass autosampler vials were used to contain final extracts. (f) Homogenizer.—Polytron, PT-MR-3100 (Kinemetica AG, Lucerne, Switzerland). (g) Incubator shaker.—Model No. ZHWY-200D (Zhicheng, China). Reagents (a) Solvents.—Residue analysis grade acetonitrile (ACN), ethyl acetate (EA), and toluene were purchased from J.T. Baker (Phillipsburg, NJ). (b) Purified water.—Prepared using a Milli-Q water purification system (Millipore Corp., Billerica, MA). (c) Anhydrous magnesium sulfate (MgSO4), sodium sulfate (Na2SO4), and sodium chloride (NaCl).—Analytical reagent grade anhydrous MgSO4, Na2SO4, and NaCl were purchased from Merck India Ltd (Mumbai, India). The MgSO4 and Na2SO4 were heated in a muffle furnace at 400–450°C for 5 h before use and stored in desiccator. (d) Pesticide standards.—Certified reference standards were obtained from Sigma-Aldrich/Riedel-de Haën/Supelco (St. Louis, MO). Stock solutions of the individual pesticide standards were prepared by accurately weighing 10 (± 0.01) mg of each pesticide (Table 1) in a volumetric flask (certified A class) and dissolving in 10 mL ethyl acetate. These stock solutions were stored in dark vials in a refrigerator at 4°C. A 10 mg/L intermediate stock standard mixture was prepared by mixing appropriate quantities of the individual stock solutions and diluting accordingly. A working standard mixture of 1.0 mg/L was prepared by diluting the intermediate stock standard solution, from which the calibration standards within the range 5–200 ng/mL were prepared by serial dilution with EA. (e) Internal standard.—Triphenylphosphate (TPP) was obtained from Sigma-Aldrich and used as an internal standard (IS). A working IS concentration of 10 mg/mL in EA was prepared and added to the test sample during sample preparation. An appropriate dilution of this IS to 1 mg/mL with EA was also prepared and used for the preparation of the matrix-matched calibration standards. (f) Analyte protectant.—Diethylene glycol (DEG; Merck, Mumbai, India) was used as the analyte protectant, and its working solution was prepared in EA (200 mg/mL). (g) SPE sorbents.—These included primary-secondary amine (PSA; Varian, Harbor City, CA; 40 mm particle size), Bondesil C18 (ODS; Varian), graphitized carbon black (GCB; United Chemical Technology, Bellefonte, PA), Florisil (60–100 mesh; Acros, Geel, Belgium), Bond Elute amino (Varian), and silica (60–120 mesh; Qualigens, Mumbai, India). (h) Tea samples.—Made tea was purchased from Bio-garden of Makaibari Tea and Trading Co. (P) Ltd, Kurseong, Darjeeling, India, and was used in fortification experiments and as matrix blanks for matrix-matched calibration standards. 416 KANRAR ET AL.: JOURNAL OF AOAC INTERNATIONAL VOL. 93, NO. 2, 2010 (.2elbaTdeunitnoc) edicitseP faeltnepSaetedaMnoisufniaeT g/gn05ag/gn001ataRroHb%,EMcg/gn05ag/gn001ataRroHb%,EMcg/gn05ag/gn001ataRroHb%,EMc lytubpofolahyC)20.21(0.07)96.31(33.8984.089.9–)12.21(66.17)37.51(76.9994.067.8–)10.01(4.47)14.41(71.20104.020.46– zartimA)74.11(0.67)71.11(33.7864.004.61–)68.11(0.97)44.11(38.8884.079.41–)38.11(66.18)92.01(76.1984.086.71– lnirhtolahyC-)52.01(66.39)17.5(33.1814.002.82–)52.01(0.69)98.6(24.2814.052.72–)50.11(0.101)30.7(24.5844.029.61– anirhtemrepyC-)16.11(43.77)49.9(38.10174.031.4–)12.11(66.97)37.11(84.20154.015.3–)03.21(43.38)29.11(29.40194.059.41– xorpnefotE)97.8(66.28)94.41(38.0953.037.31–)05.21(07.48)42.21(33.2905.013.21–)45.21(63.78)22.41(76.6905.031.11– II+IetarelavneF)20.01(66.19)11.7(00.0904.072.51–)20.21(66.39)16.5(33.1984.010.41–)71.9(0.201)32.8(33.8873.063.73– GetanilavulF-)12.9(66.09)70.8(00.5873.025.61–)14.01(66.68)53.01(00.6824.045.51–)10.8(8.88)83.71(05.2823.056.04– elozanoconefiD)50.11(0.58)06.51(00.0944.048.9)57.9(0.78)25.41(71.1993.010.33)78.9(0.09)30.21(76.3904.004.32 nirhtemartleD)88.01(43.08)53.21(33.1844.008.62–)27.11(65.97)24.31(76.2874.006.52–)88.01(63.68)29.9(38.4844.071.36– a ;)%,DSR(%,yrevoceRn.6= b .g/gn05tataRroH c .tnemecnahnero)ngis”–“(noisserppuslangisdecudni-xirtamotsniatrep%,EM
- 7. Selection of Pesticides We selected 67 compounds considering the pesticide use pattern in Indian tea gardens, which also included persistent organic pollutants like DDT analogs. The analytes belonged to different chemical classes like carbamate, organochlorine (OC), organophosphorus (OP), azole, synthetic pyrethroid, strobilurin, cyclodiene, dinitroaniline, and nereistoxin. For academic interest, we also included some acetanilide herbicides. The details of the GC/MS parameters are presented in Table 1. Made Tea to Infusion Preparation Made tea (5 g) was infused in 150 mL boiled water. After 3 min of brewing, the hot aqueous extract was filtered and cooled. Tea infusion, spent leaves, and made tea were taken for residue analysis. Fortifications In recovery studies, a calculated volume of the 1.0 mg/L working standard mixture was added to each of the 1 g blank (untreated) samples of made tea and spent leaves and 10 mL tea infusion. The tube containing the fortified sample was mixed on a vortex mixer for 30 s and left standing for 1 min to allow even distribution of the pesticides and give time to interact with the matrix. d-SPE Cleanup In the d-SPE cleanup approach, we compared the following combinations of different sorbents: PSA, amino (-NH2), Florisil, GCB, silica gel (Si), and ODS to obtain better analyte recovery and less matrix interference from tea liquor, spent leaf, and made tea. The combinations included (1) No sorbent, (2) 25 mg PSA, (3) 25 mg PSA + 25 mg GCB, (4) 25 mg PSA + 25 mg GCB + 25 mg Florisil, (5) 25 mg PSA + 25 mg GCB + 25 mg NH2, (6) 25 mg PSA + 25 mg GCB + 25 mg ODS, (7) 25 mg PSA + 25 mg GCB + 25 mg Si, (8) 25 mg PSA + 15 mg GCB + 25 mg Florisil, (9) 25 mg PSA + 20 mg GCB + 25 mg Florisil, (10) 25 mg PSA + 30 mg GCB + 25 mg Florisil, (11) 25 mg PSA + 30 mg GCB + 25 mg Florisil, (12) 25 mg PSA + 40 mg GCB + 25 mg Florisil, and (13) 25 mg PSA + 50 mg GCB + 25 mg Florisil. In addition to the above combinations, 150 mg Na2SO4/mL extract was also used in every case. The above cleanup experiments were done with 2 mL of organic phase extract. Toluene (0, 10, 20, and 30%) was used with the organic phase, except for the first two combinations. Extraction and Cleanup Procedure for Made Tea, Infusion, and Spent Leaves Tea samples (made tea and spent leaves: 1 g) were taken in 50 mL FEP centrifuge tubes and mixed with 10 mL distilled water, 100 mL of 10 mg/mL IS, 10 mL EA–cyclohexane (9 + 1, v/v), and 1 g NaCl by mixing on a vortex mixer for 30 s followed by blending for 1 min at 15 000 rpm in a Polytron homogenizer. The homogenized samples were then centrifuged at 3500 rpm for 5 min. For the d-SPE, 1.6 mL supernatant and 0.4 mL toluene were transferred into a 10 mL centrifuge tube prefilled with 25 mg each of PSA, GCB, and Florisil plus 300 mg Na2SO4. The mixture was mixed on a vortex mixer for 30 s and centrifuged at 6000 rpm for 10 min. For GC/MS analysis, a 1 mL aliquot was transferred from the supernatant to an autosampler vial with 30 mL/mL diethylene glycol solution in EA as an analyte protectant. From the prepared tea infusion (described above), a 10 mL aliquot (cooled to room temperature) was transferred to a 50 mL centrifuge tube. The pesticides were extracted with 10 mL EA–cyclohexane (9 + 1, v/v) and 1 g NaCl. The spent leaves were taken after drying with filter paper, and residues were extracted by a similar procedure as followed for made tea. The cleanup procedure for tea infusion and spent leaves was also similar to that of the made tea. GC/MS Analysis GC analysis was conducted on a capillary column (VF-5 MS, 30 m, 0.25 mm id, 0.25 mm film thickness; Varian, Middelburg, The Netherlands) with the following conditions: constant flow of helium at 1.3 mL/min; initial inlet temperature of 75°C ramped to 280°C at 200°C/min after a 20 s delay; and injection volume of 8 mL (large volume injection) onto a Carbofrit plug in the liner with an open purge valve (30:1 split ratio) for 18 s, closed until 3.5 min, and open again (30:1) until the end of the run. The oven temperature program included an initial temperature of 70°C (hold for 2 min), ramped at 20°C/min to 180°C, ramped at 5°C/min to 200°C with a hold for 3 min, ramped at 5°C/min to 220°C, ramped at 7°C/min to 240°C, and finally ramped at 10°C/min to 285°C with a hold for 3 min (total run time: 28.86 min). The temperature of the transfer line, ion trap, and manifold were set at 200, 230, and 60°C, respectively. Baseline offset of –5, peak find with S/N of the quantifier ion of at least 3, and peak width of 2 s were set as the peak processing parameters. Minimum similarity match with regard to the National Institute of Standards and Technology library spectra was kept at 500 (reversed fit). Quantification was done on the basis of the diagnostic ion (Table 1), and the peak assignments and integration were automatically done through the software. Preparation of Matrix-Matched Calibration Standards For calibration in GC/MS, six concentration levels (5, 10, 20, 50, 100, and 200 ng/g) were prepared. The matrix-matched calibration standards were prepared using a sample:solvent ratio of 1:1. For calibration in fortification experiments, the matrix-matched standards were prepared by adding the appropriate volumes of the pesticide standards mixture, IS, and analyte protectant solutions to each blank extract. KANRAR ET AL.: JOURNAL OF AOAC INTERNATIONAL VOL. 93, NO. 2, 2010 417
- 8. 418 KANRAR ET AL.: JOURNAL OF AOAC INTERNATIONAL VOL. 93, NO. 2, 2010 seitniatrecnulabolgdnalaudividnI.3elbaTa noisufniaetdna,aetedam,sevaeltnepsniedicitsephcaerof edicitseP faeltnepSaetedaMnoisufniaeT U1U2U3U4U5UU2U1U2U3U4U5UU2U1U2U3U4U5UU2 otek-3narufobraC20.0810.0120.0520.0720.050.001.040.0110.0610.0320.0920.060.021.030.0610.0810.0210.0120.050.090.0 etarohP20.0120.0610.0020.0130.050.001.020.0620.0730.0030.0930.070.041.010.0090.0310.0610.0220.001.091.0 a-HCH20.0530.0340.0330.0140.080.061.010.0030.0230.0340.0940.080.061.050.0610.0810.0720.0130.070.041.0 etamyxorypneF20.0130.0150.0720.0620.070.051.020.0720.0520.0910.0820.050.011.040.0810.0410.0720.0330.060.031.0 b-HCH40.0140.0850.0330.0630.001.091.030.0320.0520.0630.0440.070.051.020.0020.0320.0420.0830.060.021.0 g-HCH60.0540.0940.0330.0530.001.002.040.0620.0030.0250.0860.001.002.080.0010.0910.0130.0830.001.091.0 nilarolhculF10.0740.0620.0040.0070.001.091.020.0050.0110.0320.0920.070.031.020.0030.0820.0630.0140.070.041.0 linolahtorolhC10.0150.0650.0060.0260.021.032.010.0120.0920.0230.0540.070.031.030.0240.0130.0150.0450.001.091.0 d-HCH20.0050.0130.0020.0220.070.041.030.0820.0620.0730.0840.080.061.020.0900.0410.0910.0720.040.080.0 edirolhcordyhpatraC20.0010.0610.0130.0430.050.011.030.0600.0210.0120.0720.050.090.030.0510.0420.0020.0720.050.011.0 sovrolhciD40.0820.0730.0820.0520.070.041.040.0900.0310.0720.0130.060.021.030.0240.0740.0230.0920.080.061.0 rolhcotecA10.0050.0120.0620.0130.070.041.020.0340.0060.0720.0130.090.071.020.0710.0520.0030.0730.060.021.0 rolhcalA10.0220.0420.0040.0340.070.041.010.0910.0820.0810.0320.050.090.020.0900.0310.0810.0720.040.080.0 lygraidaxO40.0140.0340.0050.0730.090.091.020.0430.0840.0920.0220.070.041.020.0110.0310.0920.0230.050.001.0 noihtalaM10.0720.0920.0020.0520.050.001.020.0090.0520.0810.0820.001.002.030.0420.0820.0410.0910.050.011.0 sofiryprolhC10.0620.0330.0130.0630.060.031.010.0630.0230.0620.0830.070.031.040.0430.0920.0220.0720.070.041.0 enoflusetarohP10.0010.0220.0020.0620.040.080.010.0510.0110.0030.0730.050.001.030.0610.0420.0230.0840.070.041.0 edixoflusetarohP30.0030.0320.0150.0070.001.002.020.0120.0620.0840.0240.070.051.050.0020.0420.0910.0120.070.031.0 nirdlA10.0920.0830.0040.0340.080.051.010.0400.0310.0800.0820.030.070.040.0810.0410.0610.0920.060.011.0 bracneboihT10.0620.0130.0030.0330.060.021.020.0630.0240.0720.0920.070.041.020.0350.0940.0610.0810.080.061.0 elozanocarteT20.0900.0410.0040.0640.070.031.020.0530.0510.0700.0110.040.090.030.0320.0720.0740.0940.080.061.0 lofociD10.0010.0120.0020.0220.040.080.020.0610.0020.0230.0830.060.021.040.0610.0810.0320.0720.060.021.0 nilahtemidneP10.0820.0930.0250.0060.090.091.010.0850.0570.0710.0910.001.002.020.0800.0410.0610.0920.040.080.0 linorpiF10.0130.0240.0260.0060.001.002.020.0810.0320.0530.0330.060.021.020.0210.0410.0320.0920.050.090.0 p,o¢EDD-10.0900.0710.0020.0420.040.080.010.0660.0950.0230.0430.001.002.020.0630.0140.0720.0920.070.041.0 rolhcatuB10.0130.0630.0320.0140.070.041.020.0720.0440.0410.0220.060.021.010.0140.0050.0810.0020.030.060.0 anaflusodnE-10.0710.0420.0520.0920.050.001.010.0730.0740.0430.0830.080.061.010.0630.0520.0720.0320.060.011.0 elozanocaxeH10.0240.0840.0420.0620.070.051.040.0010.0210.0020.0820.060.011.030.0440.0720.0810.0610.060.031.0 rolhcaliterP10.0320.0820.0020.0720.050.001.010.0510.0610.0910.0320.040.080.020.0410.0510.0920.0130.050.001.0 nibortsonimoteM20.0010.0120.0750.0760.090.091.030.0520.0720.0950.0840.090.081.040.0820.0720.0650.0750.001.091.0
- 9. KANRAR ET AL.: JOURNAL OF AOAC INTERNATIONAL VOL. 93, NO. 2, 2010 419 (.3elbaTdeunitnoc) faeltnepSaetedaMnoisufniaeT edicitsePU1U2U3U4U5UU2U1U2U3U4U5UU2U1U2U3U4U5UU2 elozalcycirT50.0020.0220.0010.0210.060.021.050.0430.0740.0320.0030.090.071.070.0900.0910.0820.0830.090.071.0 p,p¢EDD-10.0800.0310.0910.0320.030.070.020.0090.0220.0510.0820.001.002.020.0530.0830.0710.0320.060.021.0 elozatubolcaP10.0910.0120.0610.0820.040.090.010.0110.0910.0320.0920.040.090.030.0310.0910.0620.0130.060.011.0 nirdleiD20.0110.0620.0910.0820.050.001.030.0720.0130.0710.0120.060.021.040.0110.0910.0130.0830.070.031.0 p,o¢DDD-10.0120.0520.0220.0420.050.090.010.0720.0920.0410.0710.050.090.020.0720.0130.0510.0110.050.001.0 nefroulfyxO10.0910.0720.0710.0020.040.090.020.0520.0510.0310.0810.040.080.010.0510.0910.0130.0350.070.031.0 nizeforpuB10.0020.0110.0810.0320.040.080.010.0820.0130.0710.0910.050.001.030.0520.0320.0410.0710.050.001.0 elozalisulF10.0320.0130.0520.0140.060.021.030.0720.0320.0710.0220.050.011.010.0900.0910.0720.0830.050.001.0 rypanefrolhC20.0620.0820.0520.0020.050.011.020.0620.0140.0910.0220.060.021.030.0610.0910.0220.0820.050.011.0 lohoclanaflusodnE10.0120.0420.0710.0410.040.080.040.0830.0840.0610.0910.080.051.020.0900.0310.0120.0620.040.080.0 edizonefamorhC50.0710.0420.0220.0330.070.041.060.0910.0320.0140.0440.090.081.040.0520.0430.0920.0720.070.041.0 bnaflusodnE-10.0720.0920.0610.0410.050.090.010.0410.0510.0720.0330.050.001.010.0420.0430.0840.0760.090.091.0 noihtE10.0130.0340.0240.0240.080.061.050.0900.0310.0320.0920.060.031.010.0610.0520.0230.0930.060.021.0 p,p¢DDD-10.0710.0320.0230.0330.060.011.010.0820.0130.0610.0910.050.001.020.0710.0420.0510.0020.040.090.0 p,o¢TDD-10.0220.0920.0320.0720.050.001.020.0110.0610.0920.0530.050.011.030.0210.0910.0140.0850.080.061.0 sohpozairT10.0060.0940.0340.0530.001.091.010.0720.0220.0710.0120.050.090.020.0900.0910.0130.0830.060.011.0 MlyxalaneB10.0320.0210.0420.0910.040.080.010.0420.0920.0810.0910.050.090.020.0410.0810.0820.0130.050.001.0 etaflusnaflusodnE20.0030.0430.0910.0610.060.011.020.0210.0810.0420.0820.050.090.030.0700.0110.0410.0320.040.080.0 elozanociporP20.0520.0820.0420.0620.060.011.030.0920.0020.0810.0720.060.011.050.0560.0050.0310.0910.001.002.0 p,p¢TDD-10.0220.0520.0420.0630.060.011.010.0110.0710.0220.0820.040.080.040.0030.0630.0910.0520.070.041.0 elozanocubeT20.0910.0420.0710.0220.050.090.020.0410.0020.0920.0430.050.011.070.0210.0610.0520.0920.080.061.0 etigraporP10.0230.0430.0320.0630.060.031.020.0620.0510.0110.0700.040.080.050.0510.0910.0130.0830.070.051.0 naflusobraC10.0530.0840.0030.0230.070.051.020.0900.0310.0320.0920.040.090.040.0640.0050.0710.0120.080.071.0 nirhtnefiB10.0420.0810.0510.0020.040.080.010.0750.0160.0510.0910.090.071.020.0110.0910.0130.0830.060.011.0 sohpolinA20.0320.0220.0420.0140.060.021.010.0150.0130.0110.0310.060.031.040.0820.0910.0630.0830.070.051.0 niuqazaneF10.0610.0910.0420.0920.050.090.010.0510.0610.0120.0720.040.080.010.0610.0910.0220.0830.050.001.0 nefidarteT10.0060.0270.0710.0020.001.002.020.0110.0810.0320.0830.050.011.010.0900.0310.0420.0820.040.080.0 enolasohP10.0220.0910.0120.0230.050.001.020.0520.0420.0710.0310.050.090.020.0610.0210.0910.0420.040.080.0 lytubpofolahyC10.0210.0610.0910.0220.040.070.020.0210.0910.0420.0820.050.001.020.0620.0920.0530.0430.070.031.0 zartimA20.0550.0850.0710.0120.090.071.020.0720.0120.0510.0810.050.090.020.0140.0940.0310.0910.070.041.0
- 10. Method Validation The analytical method was validated using the single- laboratory validation approach (20). The performance of the method was evaluated considering the following different validation parameters: (a) Calibration range.—The calibration curves for all of the compounds in pure solvent and matrix were obtained by plotting the peak area against the concentration of the corresponding calibration standards at six calibration levels ranging between 1 and 200 ng/g. (b) Sensitivity.—The LOD was determined by considering an S/N of 3 with reference to the background noise obtained from the blank sample, whereas the LOQ was determined by considering an S/N of 10 using matrix-matched standards. (c) Precision.—The precision in terms of repeatability (two different analysts prepared six samples each on a single day) and intermediate precision (two different analysts prepared six samples each on 6 different days) were determined separately for a standard concentration of 50 ng/g of all of the analytes. The Horwitz ratio (HorRat) pertaining to intralaboratory precision, which indicates the acceptability of a method with respect to precision (21, 22), was calculated for all of the pesticides in the following way: HorRat = RSD/PRSD where PRSD is the predicted RSD = 2C–0.15 and C is the concentration expressed as a mass fraction (50 ng/g = 50 ´ 10–9 ). (d) Accuracy (recovery experiments).—Made tea obtained from Bio-garden (which did not receive any treatment with the test pesticides) was used as the blank. The recovery experiments were carried out on fresh untreated made tea, tea infusion, and spent leaves by fortifying the samples in six replicates with a pesticide mixture separately at two concentration levels, i.e., 50 and 100 ng/g, and the results are reported in Table 2. (e) Matrix effect.—The matrix effect (ME) was assessed by using matrix-matched standards. The slope of the calibration curve based on the matrix-matched standards of made tea, tea infusion, and spent leaf was compared with the slope of the pure solvent-based calibration curve. A higher slope of the matrix calibration indicates matrix-induced signal enhancement, whereas a lower slope represents signal suppression. The ME wasevaluated by the following equation: ME, % = (peak area of matrix standard – peak area of solvent standard) ´ 100/peak area of solvent standard In view of the above equation, the negative and positive values of the ME signify matrix-induced suppression and enhancement, respectively. Furthermore, in order to minimize any errors in estimation, TPP (10 mg/mL) was used as an IS. (f) Measurement uncertainty.—Global uncertainty was determined for all of the pesticides at the level of 50 ng/g as per the statistical procedure of the EURACHEM/CITAC 420 KANRAR ET AL.: JOURNAL OF AOAC INTERNATIONAL VOL. 93, NO. 2, 2010 (.3elbaTdeunitnoc) faeltnepSaetedaMnoisufniaeT edicitseP1U2U3U4U5UUU21U2U3U4U5UUU21U2U3U4U5UUU2 lnirhtolahyC-20.0710.0910.0510.0410.040.080.020.0610.0120.0210.0810.040.080.030.0620.0830.0120.0420.060.031.0 anirhtemrepyC-10.0630.0140.0620.0330.070.041.010.0710.0420.0410.0110.040.070.030.0920.0630.0810.0210.060.021.0 xorpnefotE20.0910.0610.0810.0420.040.090.020.0510.0910.0110.0310.040.070.020.0720.0030.0410.0910.050.001.0 II+IetarelavneF20.0220.0620.0920.0140.060.031.020.0710.0420.0820.0630.060.021.030.0310.0910.0130.0720.060.011.0 GetanilavulF-20.0910.0920.0520.0230.060.011.020.0820.0130.0710.0810.050.011.020.0410.0710.0810.0220.040.080.0 elozanoconefiD50.0320.0120.0330.0140.080.061.050.0920.0420.0810.0020.070.041.030.0800.0310.0120.0320.050.090.0 nirhtemartleD70.0410.0610.0420.0920.080.061.070.0620.0130.0210.0410.080.071.040.0610.0910.0310.0210.050.001.0 a .g/gn05tadetaluclaC
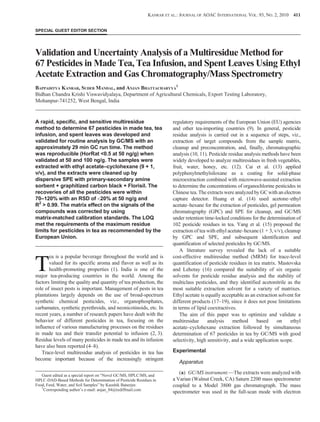
- 11. Guide CG 4 (23) in the same way as reported by Banerjee et al. (24). Five individual sources of uncertainty were taken into account, viz., uncertainty associated with the calibration curve (U1), day uncertainty associated with precision (U2), analyst uncertainty associated with precision (U3), day uncertainty associated with accuracy/bias (U4), and analyst uncertainty associated with accuracy/bias (U5). The global uncertainty (U) was calculated as: U U U U U U= + + + +( )1 2 2 2 3 2 4 2 5 2 1 2 and was reported as expanded uncertainty, which is twice the value of the global uncertainty. The uncertainty values for each pesticide are reported as relative uncertainties in Table 3. Results and Discussion Selection of the Extraction Solvent EA, ACN, and EA–cyclohexane in the ratio of 9 + 1, 8 + 2, 7 + 3, 6 + 4, and 1 + 1 (v/v) were evaluated for their extraction efficiency. The results of the Student’s t-test performed on the comparative recoveries obtained by using these solvents showed that the recoveries of all pesticides were statistically equal at the 95% confidence level (Figure 1). In the case of EA, the recoveries of less-polar pesticides like synthetic pyrethroids and carbamates were more than 70% when quantified with matrix-matched standards. With ACN extraction, the results were similar, with recoveries being above 75%. But with EA–cyclohexane (9 + 1, v/v), the recoveries of all the pesticides, including carbamates and synthetic pyrethroids, were more than 80% with better precision. Precision in terms of HorRat at the 50 ng/g level were less than 0.5 for all pesticides (Table 2), indicating satisfactory repeatability and ruggedness of the methodology. Increase of the cyclohexane proportion in the extracting solvent mixture (EA–cyclohexane; 8 + 2, 7 + 3, 6 + 4, and 1 + 1, v/v) did not result in any significant increase of the recovery percentage. Relatively less recovery of chlorothalonil was found irrespective of the extracting solvent used, which is in accordance with the literature (25). From this study, it is clear that EA–cyclohexane (9 + 1, v/v) gave a higher recovery than any other solvent or solvent mixtures tested for extraction of tea matrix. Comparison of Shaking Versus Blending Versus Mixing on a Vortex Mixer The extractability of polar and nonpolar residues was assessed through comparison of shaking versus blending versus mixing on a vortex mixer to achieve the best initial extraction step to be followed for made tea and spent leaf. Most MRMs for pesticides in tea use a blender during extraction (15, 26) but Gupta et al. (27) validated and implemented a shaking procedure for tea. Our results revealed that blending gave better recovery for most of the pesticides compared to mixing on a vortex mixer and shaking-based methods (Figure 2). Thus, we adopted a blending homogenization procedure for extraction of residues from made tea and spent leaves. Comparison of Various Salts to Induce Phase Separation In developing our method, we used different sets of salt combinations, e.g., NaCl, NaCl + MgSO4, and NaCl + Na2SO4, with 10 mL EA–cyclohexane (9 + 1, v/v) in the initial extraction step. In terms of the recovery of OC, OP, and other polar and nonpolar pesticides, we did not achieve higher recovery by using MgSO4 or Na2SO4 (Figure 3). But the amount of NaCl (1 g) added to this system had a strong influence on the separation between water and the organic phase. Comparative Efficiency of Different SPE Sorbents Tea matrix contains high amounts of polyphenols, methyl xanthines such as caffeine, purines, and phenolic acids (28). The main aim of the cleanup step was to remove these coextractives as much as possible from the extract by using different sorbents. The most commonly used sorbents include KANRAR ET AL.: JOURNAL OF AOAC INTERNATIONAL VOL. 93, NO. 2, 2010 421 Figure 1. Extraction capabilities of different solvent systems; cyclohex = cyclohexane. Figure 2. Extraction capabilities of blending over shaking and mixing on a vortex blender for selected pesticides.
- 12. weak ion exchangers (PSA or -NH2), GCB, strong anion exchanger, and/or ODS SPE cartridges (29–33). The d-SPE combinations No. 4 and 6 described in the Experimental section gave statistically better results than other combinations (Figure 4). But considering the high price of ODS, Florisil is the best sorbent option in our opinion. So the combination of PSA, GCB, and Florisil is the ideal cleanup sorbent for removal of a variety of coextractives, although, unfortunately, GCB retains structurally planar pesticides such as HCH, phosalone, and chlorothalonil. To investigate how much toluene is required to prevent recovery loss on account of adsorption on GCB, the cleanup experiment was repeated with standard solutions of 10, 20, or 30% toluene in EA. As apparent from Figure 5, even 10% toluene dramatically improved the recovery. With 20% toluene, the recovery of all the pesticides was higher than 70%, but use of 30% toluene did not show any significant improvement in recovery percentage. So, it was concluded that 20% was the optimum amount of toluene. Analyte Protectant To overcome the problem of the “matrix-induced signal enhancement effect,” many laboratories use different types of analyte protectants in pesticide analysis (34, 35). However, DEG, 200 mg/mL in EA, was used in this studybecause it covers theentirevolatilityrangeof thetargetpesticides.Theuseof DEG as an analyte protectant dramatically reduced the errors caused by matrix effects, as presented in Figure 6. The long-term effect of DEG on the life of the liner/column and instrument sensitivity needs to be examined, although it did not have any short-term adverse effect. Method Validation All of the 67 pesticides could be analyzed by a single GC run of 28.82 min at a 50 ng/mL or lower level. Linearity (r) of the calibration curve, both for pure solvent-based as well as matrix-matched standards, was >0.99 for most of the compounds. LOQ values for all of the test pesticides (Table 1) were below the maximum residue limit (MRL) values of the respective compounds in/on tea as fixed by the EU (9). The matrix-induced suppression in target signals was prominent for a large number of pesticides, which possibly occurred as a result of suppressions in the ionization process. Response enhancement due to matrix effects was also observed for some pesticides, viz., difenoconazole, butachlor, oxadiargyl, chlorothalonil, and phorate. The slopes of the matrix-matched calibration curves were significantly different compared to pure solvent-based calibrations at the 95% level of statistical confidence for each of the tea matrixes. An overall signal suppression of 0.91–64% as well as signal enhancement of 0.46–33% were observed irrespective of tea matrixes (Table 2). Considering the variable matrix influences for different compounds in mixtures, matrix-matched calibrations were used for respective matrix-based quantification purposes to avoid any over- or underestimation of residues. Our method was quite satisfactory in terms of the RSD of less than 20% (n = 6) for each compound. Pesticide Recoveries and Repeatabilities The results (Table 2) of recovery experiments at 50 and 100 ng/g with different tea matrixes show a satisfactory range of 70–120%. The HorRat of all analytes calculated at the 50 ng/mL level of fortification was below 0.5 in spent leaf, made tea, and tea infusion. Thus, the method provided satisfactory levels of intralaboratory precision and accuracy. Measurement Uncertainty Analyses The total uncertainty was evaluated assuming that all the contributions were independent of each other. A coverage factor of 2 was chosen at a confidence level of 95% to evaluate the expanded uncertainty at 50 ng/mL fortification (Table 3). On the basis of expanded uncertainties, the test pesticides could be classified into four groups: group I (up to 10%), group II (10–15%), group III (15–20%), and group IV (>20%). In the case of spent leaves, 17 pesticides could be graded as group I, 32 as group II, 17 as group III, and one as group IV. In spent leaf, higher uncertainty (>20%) was recorded for chlorothalonil, which might be due to its basic sensitivity. In the case of made tea and tea infusion, 20 and 13 pesticides were graded as group I, 33 and 41 as group II, and 14 and 13 as group III, respectively. In addition, most of the pesticides (irrespective of matrixes) had low uncertainties (£3%) associated with bias. It could, therefore, be concluded 422 KANRAR ET AL.: JOURNAL OF AOAC INTERNATIONAL VOL. 93, NO. 2, 2010 Figure 3. Effect of different salts on the phase separation. Figure 4. Cleanup capabilities of different sorbents.
- 13. that the method optimized for sample preparation and analysis is efficient enough and suitable for determination of pesticide residues in these matrixes. Economics of Analyses The total cost of sample preparation (consumable inputs only, excluding the instrument running cost, manpower, and other overhead costs) was INR 150/sample, which is equivalent to approximately $3/sample. Our estimate assumes that a single laboratory chemist, on average, can process around 20 samples in eight working hours performing the activities starting from weighing the sample until it is ready to inject for GC/MS analysis. The relative output increases to above 30 samples/person/day when a group of chemists work hand-in-hand, processing the samples in a chain mode. Conclusions The multiresidue GC/MS method developed and validated could analyze 67 pesticides in tea samples with a GC run of KANRAR ET AL.: JOURNAL OF AOAC INTERNATIONAL VOL. 93, NO. 2, 2010 423 Figure 5. Effect of amount (%) of toluene in EA on the recovery of pesticides adsorbed by GCB (12.5 mg/mL). Figure 6. Effect of using analyte protectant (DEG). PP is the chromatographic plot preference.
- 14. 28.82 min. The extraction process using EA–cyclohexane (9 + 1, v/v) proved to be optimal for extracting multiclass pesticides from tea samples. With d-SPE cleanup by PSA + GCB + Florisil, high cleanup efficiency and low matrix effects could be obtained, enabling use of this sensitive and selective method for routine multiresidue analysis of pesticides in tea matrixes with satisfactory recovery (70–120%). The method is cost-effective and also offers a low level of measurement uncertainty (£20%) for the test compounds, indicating suitability for the requirements of international standards. Acknowledgments We are grateful to Sanjay Dave, Director, APEDA, Ministry of Commerce, Government of India, New Delhi, for financial support. We are also thankful to Bidhan Krishi Viswavidyalaya, West Bengal, India, for constant support and inspiration. References (1) Yang, C.S., & Landau, J.M. (2000) J. Nutr. 130, 2409–2412 (2) Jaggi, S., Sood, C., Kumar, V., Ravindranath, S.D., & Shanker, A. (2000) Pestology 24, 42–46 (3) Gupta, M., Sharma, A., & Shanker, A. (2008) Food Chem. 106, 158–164 (4) Bhattacharyya, A., Chowdhury, A., Somchowdhury, A.K., Paharl, A.K., & Roy, U.S. (1995) Pestology 21, 28–36 (5) Lino, C.M., & Silveira, M.I.N. (1997) J. Agric. Food Chem. 45, 2718–2722 (6) Saha, T., Saha, K., Banerjee, H., Chowdhury, A., Somchaudhury, A.K., & Bhattacharyya, A. (2000) Bull. Environ. Contam. Toxicol. 65, 215–221 (7) Pramanik, S.K., Dutta, S., Bhattacharyya, J., Saha, T., Dey, P.K., Das, S., & Bhattacharyya, A. (2005) Bull. Environ. Contam. Toxicol. 74, 645–651 (8) Bhattacharyya, A., Somchowdhury, A.K., Chowdhury, A., Roy, A., & Roy, P. (1995) Proceedings of 95th International Tea Quality-Human Health Symposium, Nov. 7–10, Tea Society of China, Tea Research Institute and Chinese Academy of Agricultural Science, Shanghai, China, pp 369–372 (9) European Union, Informal Coordination of MRLs Established in Directives 76/895/EEC, 86/362/EEC, 86/363/EEC, and 90/642/EEC, http://europa.eu.int/ comm/food/plant/protection/pesticides/index.en.htm, accessed May 25, 2009 (10) Tekel, J., & Hatrík, S. (1996) J. Chromatogr. A 754, 397–410 (11) Cserhati, T., Forgacs, E., Deyl, Z., Miksik, I., & Eckhardt, A. (2004) Biomed. Chromatogr. 18, 350–359 (12) Fillion, J., Sauvc, F., & Selwyn, J. (2000) J. AOAC Int. 83, 698–713 (13) Cai, L.S., Xing, J., Dong, L., & Wu, C. (2003) J. Chromatogr. A 1015, 11–21 (14) Huang, Z., Li, Y., Chen, B., & Yao, S. (2007) J. Chromatogr. B 853, 154–162 (15) Yang, X., Xu, D.C., Qiu, J.W., Zhang, H., Zhang, Y.C., Dong, A.J., Ma, Y., & Wang, J. (2009) Chem. Pap. 63, 39–46 (16) Mastovska, K., & Lehotay, S.J. (2004) J. Chromatogr. A 1040, 259–272 (17) Mol, H.G.J., Rooseboom, A., Van Dam, R., Roding, M., Arondeus, K., & Sunarto, S. (2007) Anal. Bioanal. Chem. 389, 1715–1754 (18) Banerjee, K., Upadhyay, A.K., Adsule, P.G., Patil, S.H., Oulkar, D.P., & Jadhav, D.R. (2006) Food Addit. Contam. 23, 994–999 (19) Fernandez Moreno, J.L., Arrebola Liebanas, F.J., Garrido Frenich, A., & Martinez Vidal, J.L. (2006) J. Chromatogr. A 1111, 97–105 (20) Thompson, M., Ellison, S.L., & Wood, R. (2002) Pure Appl. Chem. 74, 835–855 (21) Horwitz, W., & Albert, R. (2006) J. AOAC Int. 89, 1095–1109 (22) Horwitz, W., Kamps, L.R., & Boyer, K.W. (1980) J. Assoc. Off. Anal. Chem. 63, 1344–1354 (23) EURACHEM/CITAC Guide CG 4 (2000) Quantifying Uncertainity in Analytical Measurement, 2nd Ed., http://www.measurementuncertainty.org/ (24) Banerjee, K., Oulkar, D.P., Dasgupta, S., Patil, S.B., Patil, S.H., Savant, R., & Adsule, P.G. (2007) J. Chromatogr. A 1173, 98–109 (25) Lehotay, S.J., Mastovska, K., & Lightfield, A.R. (2005) J. AOAC Int. 88, 615–629 (26) Chia-Chang, W., Chu, C., Wang, Y., & Lur, H.S. (2009) J. Environ. Sci. Health 44, 58–68 (27) Gupta, M., & Shanker, A. (2008) Food Chem. 111, 805–810 (28) UPASI TRF, http://www.upasitearesearch.org/ chemistry_tea.html, accessed May 25, 2009 (29) Casanova, J. (1996) J. AOAC Int. 79, 936–940 (30) Fillion, J., Hindle, R., Lacroix, M., & Selwyn, J. (1995) J. AOAC Int. 78, 1352–1366 (31) Fillion, J., Sauve, F., & Selwyn, J. (2000) J. AOAC Int. 83, 698–713 (32) Sheridan, R.S., & Meola, J.R. (1999) J. AOAC Int. 82, 982–990 (33) Cook, J., Beckett, M.P., Reliford, B., Hammock, W., & Engel, M. (1999) J. AOAC Int. 82, 1419–1435 (34) Anastassiades, M., & Scherbaum, E. (1997) Dtsch. Lebensm. Rundsch. 93, 316–327 (35) Lehotay, S.J., Lightfield, A.R., Harman-Fetcho, J.A., & Donoghue, D.A. (2001) J. Agric. Food Chem. 49, 4589–4596 424 KANRAR ET AL.: JOURNAL OF AOAC INTERNATIONAL VOL. 93, NO. 2, 2010