
More Related Content


DM Garby_Vitamin A E AACC 2011
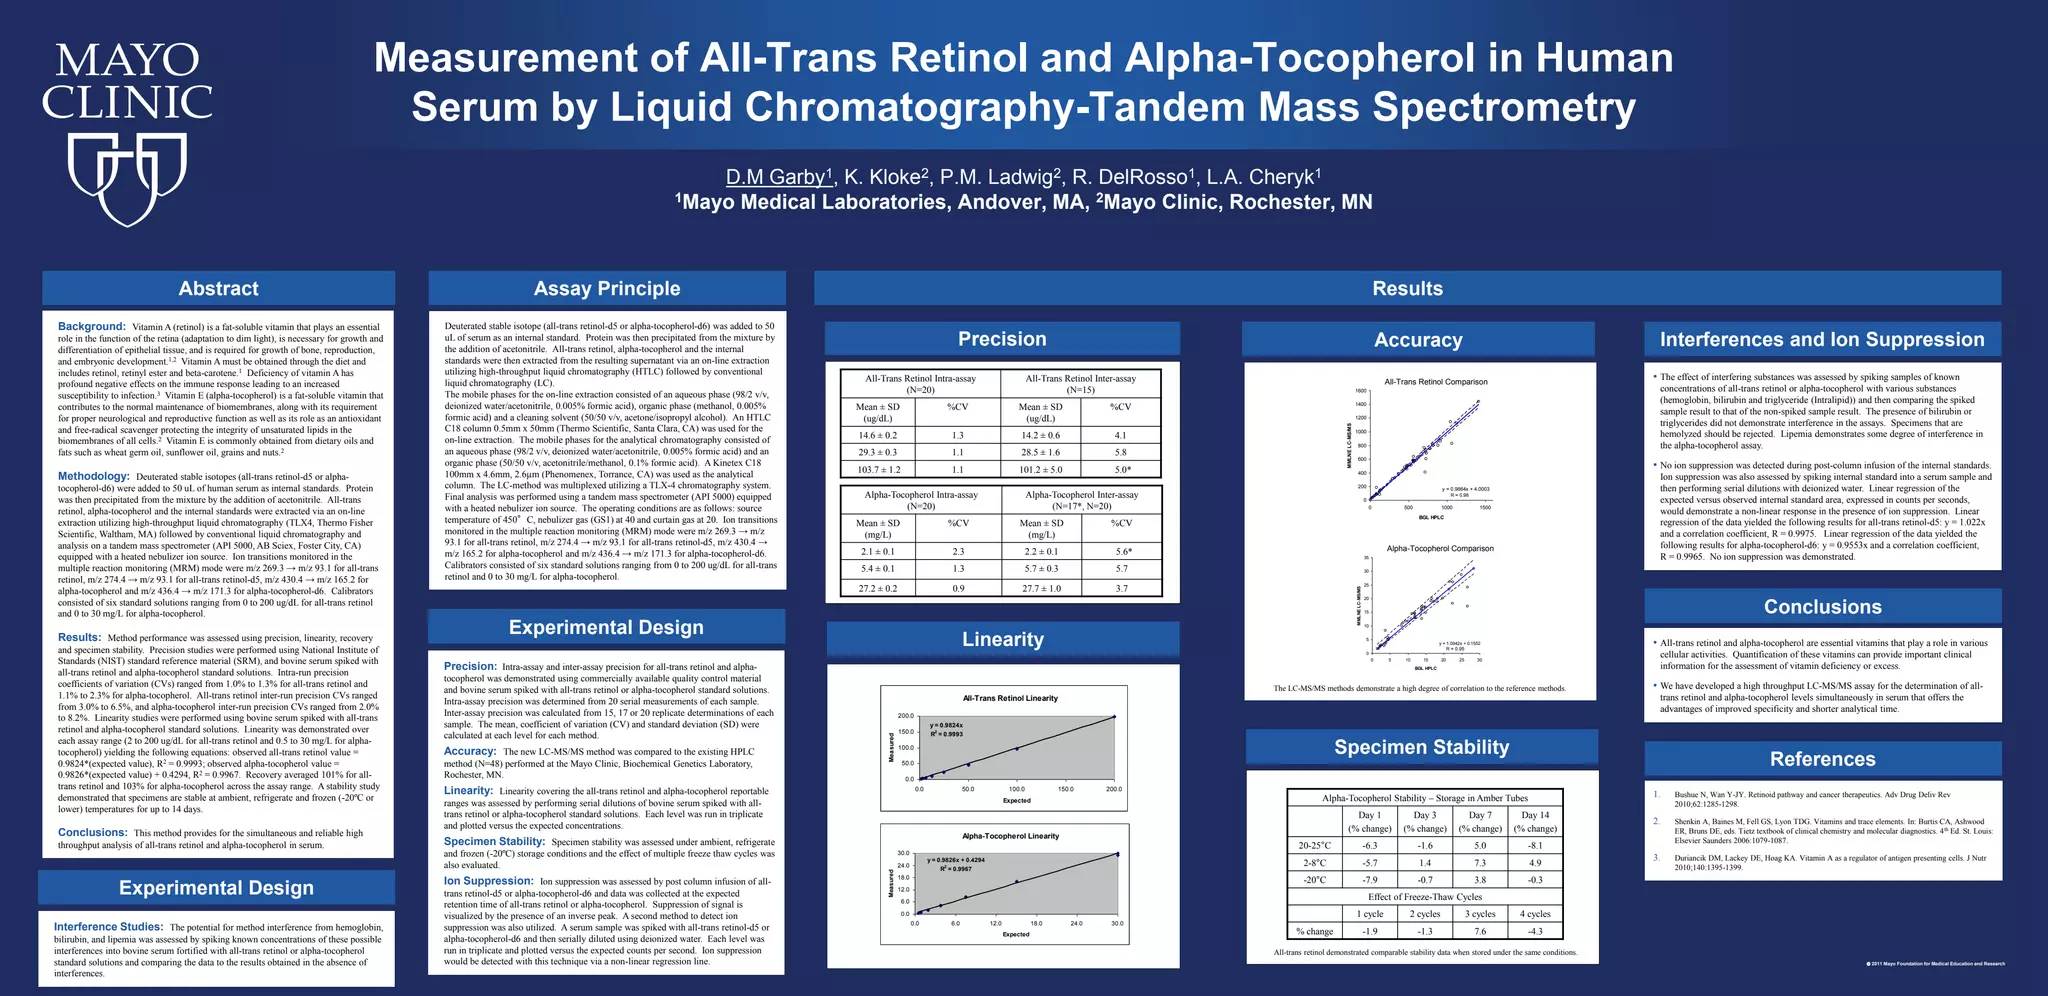
- 1. Specimen Stability The LC-MS/MSmethods demonstrate a high degree of correlation to the reference methods. Accuracy Measurement of All-Trans Retinol and Alpha-Tocopherol in Human Serum by Liquid Chromatography-Tandem Mass Spectrometry Alpha-Tocopherol Linearity y = 0.9826x + 0.4294 R 2 = 0.9967 0.0 6.0 12.0 18.0 24.0 30.0 0.0 6.0 12.0 18.0 24.0 30.0 Expected Measured Ascorbic Acid Lithium Heparin Comparison y = 0.9964x + 0.1296 R2 = 0.9936 0.0 5.0 10.0 15.0 20.0 25.0 0.0 5.0 10.0 15.0 20.0 25.0 BGL HPLC MMLNELC-MS/MS y = 1.0942x + 0.1552 0 5 10 15 20 25 30 35 0 5 10 15 20 25 30 BGL HPLC MMLNELC-MS/MS D.M Garby1, K. Kloke2, P.M. Ladwig2, R. DelRosso1, L.A. Cheryk1 1Mayo Medical Laboratories, Andover, MA, 2Mayo Clinic, Rochester, MN Precision • The effect of interfering substances was assessed by spiking samples of known concentrations of all-trans retinol or alpha-tocopherol with various substances (hemoglobin, bilirubin and triglyceride (Intralipid)) and then comparing the spiked sample result to that of the non-spiked sample result. The presence of bilirubin or triglycerides did not demonstrate interference in the assays. Specimens that are hemolyzed should be rejected. Lipemia demonstrates some degree of interference in the alpha-tocopherol assay. • No ion suppression was detected during post-column infusion of the internal standards. Ion suppression was also assessed by spiking internal standard into a serum sample and then performing serial dilutions with deionized water. Linear regression of the expected versus observed internal standard area, expressed in counts per seconds, would demonstrate a non-linear response in the presence of ion suppression. Linear regression of the data yielded the following results for all-trans retinol-d5: y = 1.022x and a correlation coefficient, R = 0.9975. Linear regression of the data yielded the following results for alpha-tocopherol-d6: y = 0.9553x and a correlation coefficient, R = 0.9965. No ion suppression was demonstrated. Interferences and Ion Suppression • All-trans retinol and alpha-tocopherol are essential vitamins that play a role in various cellular activities. Quantification of these vitamins can provide important clinical information for the assessment of vitamin deficiency or excess. • We have developed a high throughput LC-MS/MS assay for the determination of all- trans retinol and alpha-tocopherol levels simultaneously in serum that offers the advantages of improved specificity and shorter analytical time. Conclusions 1. Bushue N, Wan Y-JY. Retinoid pathway and cancer therapeutics. Adv Drug Deliv Rev 2010;62:1285-1298. 2. Shenkin A, Baines M, Fell GS, Lyon TDG. Vitamins and trace elements. In: Burtis CA, Ashwood ER, Bruns DE, eds. Tietz textbook of clinical chemistry and molecular diagnostics. 4th Ed. St. Louis: Elsevier Saunders 2006:1079-1087. 3. Duriancik DM, Lackey DE, Hoag KA. Vitamin A as a regulator of antigen presenting cells. J Nutr 2010;140:1395-1399. References Background: Vitamin A (retinol) is a fat-soluble vitamin that plays an essential role in the function of the retina (adaptation to dim light), is necessary for growth and differentiation of epithelial tissue, and is required for growth of bone, reproduction, and embryonic development.1,2 Vitamin A must be obtained through the diet and includes retinol, retinyl ester and beta-carotene.1 Deficiency of vitamin A has profound negative effects on the immune response leading to an increased susceptibility to infection.3 Vitamin E (alpha-tocopherol) is a fat-soluble vitamin that contributes to the normal maintenance of biomembranes, along with its requirement for proper neurological and reproductive function as well as its role as an antioxidant and free-radical scavenger protecting the integrity of unsaturated lipids in the biomembranes of all cells.2 Vitamin E is commonly obtained from dietary oils and fats such as wheat germ oil, sunflower oil, grains and nuts.2 Methodology: Deuterated stable isotopes (all-trans retinol-d5 or alpha- tocopherol-d6) were added to 50 uL of human serum as internal standards. Protein was then precipitated from the mixture by the addition of acetonitrile. All-trans retinol, alpha-tocopherol and the internal standards were extracted via an on-line extraction utilizing high-throughput liquid chromatography (TLX4, Thermo Fisher Scientific, Waltham, MA) followed by conventional liquid chromatography and analysis on a tandem mass spectrometer (API 5000, AB Sciex, Foster City, CA) equipped with a heated nebulizer ion source. Ion transitions monitored in the multiple reaction monitoring (MRM) mode were m/z 269.3 → m/z 93.1 for all-trans retinol, m/z 274.4 → m/z 93.1 for all-trans retinol-d5, m/z 430.4 → m/z 165.2 for alpha-tocopherol and m/z 436.4 → m/z 171.3 for alpha-tocopherol-d6. Calibrators consisted of six standard solutions ranging from 0 to 200 ug/dL for all-trans retinol and 0 to 30 mg/L for alpha-tocopherol. Results: Method performance was assessed using precision, linearity, recovery and specimen stability. Precision studies were performed using National Institute of Standards (NIST) standard reference material (SRM), and bovine serum spiked with all-trans retinol and alpha-tocopherol standard solutions. Intra-run precision coefficients of variation (CVs) ranged from 1.0% to 1.3% for all-trans retinol and 1.1% to 2.3% for alpha-tocopherol. All-trans retinol inter-run precision CVs ranged from 3.0% to 6.5%, and alpha-tocopherol inter-run precision CVs ranged from 2.0% to 8.2%. Linearity studies were performed using bovine serum spiked with all-trans retinol and alpha-tocopherol standard solutions. Linearity was demonstrated over each assay range (2 to 200 ug/dL for all-trans retinol and 0.5 to 30 mg/L for alpha- tocopherol) yielding the following equations: observed all-trans retinol value = 0.9824*(expected value), R2 = 0.9993; observed alpha-tocopherol value = 0.9826*(expected value) + 0.4294, R2 = 0.9967. Recovery averaged 101% for all- trans retinol and 103% for alpha-tocopherol across the assay range. A stability study demonstrated that specimens are stable at ambient, refrigerate and frozen (-20ºC or lower) temperatures for up to 14 days. Conclusions: This method provides for the simultaneous and reliable high throughput analysis of all-trans retinol and alpha-tocopherol in serum. Abstract Interference Studies: The potential for method interference from hemoglobin, bilirubin, and lipemia was assessed by spiking known concentrations of these possible interferences into bovine serum fortified with all-trans retinol or alpha-tocopherol standard solutions and comparing the data to the results obtained in the absence of interferences. Experimental Design 2011 Mayo Foundation for Medical Education and Research Deuterated stable isotope (all-trans retinol-d5 or alpha-tocopherol-d6) was added to 50 uL of serum as an internal standard. Protein was then precipitated from the mixture by the addition of acetonitrile. All-trans retinol, alpha-tocopherol and the internal standards were then extracted from the resulting supernatant via an on-line extraction utilizing high-throughput liquid chromatography (HTLC) followed by conventional liquid chromatography (LC). The mobile phases for the on-line extraction consisted of an aqueous phase (98/2 v/v, deionized water/acetonitrile, 0.005% formic acid), organic phase (methanol, 0.005% formic acid) and a cleaning solvent (50/50 v/v, acetone/isopropyl alcohol). An HTLC C18 column 0.5mm x 50mm (Thermo Scientific, Santa Clara, CA) was used for the on-line extraction. The mobile phases for the analytical chromatography consisted of an aqueous phase (98/2 v/v, deionized water/acetonitrile, 0.005% formic acid) and an organic phase (50/50 v/v, acetonitrile/methanol, 0.1% formic acid). A Kinetex C18 100mm x 4.6mm, 2.6µm (Phenomenex, Torrance, CA) was used as the analytical column. The LC-method was multiplexed utilizing a TLX-4 chromatography system. Final analysis was performed using a tandem mass spectrometer (API 5000) equipped with a heated nebulizer ion source. The operating conditions are as follows: source temperature of 450°C, nebulizer gas (GS1) at 40 and curtain gas at 20. Ion transitions monitored in the multiple reaction monitoring (MRM) mode were m/z 269.3 → m/z 93.1 for all-trans retinol, m/z 274.4 → m/z 93.1 for all-trans retinol-d5, m/z 430.4 → m/z 165.2 for alpha-tocopherol and m/z 436.4 → m/z 171.3 for alpha-tocopherol-d6. Calibrators consisted of six standard solutions ranging from 0 to 200 ug/dL for all-trans retinol and 0 to 30 mg/L for alpha-tocopherol. Assay Principle Results All-Trans Retinol Intra-assay (N=20) All-Trans Retinol Inter-assay (N=15) Mean ± SD (ug/dL) %CV Mean ± SD (ug/dL) %CV 14.6 ± 0.2 1.3 14.2 ± 0.6 4.1 29.3 ± 0.3 1.1 28.5 ± 1.6 5.8 103.7 ± 1.2 1.1 101.2 ± 5.0 5.0* Alpha-Tocopherol Intra-assay (N=20) Alpha-Tocopherol Inter-assay (N=17*, N=20) Mean ± SD (mg/L) %CV Mean ± SD (mg/L) %CV 2.1 ± 0.1 2.3 2.2 ± 0.1 5.6* 5.4 ± 0.1 1.3 5.7 ± 0.3 5.7 27.2 ± 0.2 0.9 27.7 ± 1.0 3.7 Linearity Alpha-Tocopherol Stability – Storage in Amber Tubes Day 1 (% change) Day 3 (% change) Day 7 (% change) Day 14 (% change) 20-25°C -6.3 -1.6 5.0 -8.1 2-8°C -5.7 1.4 7.3 4.9 -20°C -7.9 -0.7 3.8 -0.3 Effect of Freeze-Thaw Cycles 1 cycle 2 cycles 3 cycles 4 cycles % change -1.9 -1.3 7.6 -4.3 All-trans retinol demonstrated comparable stability data when stored under the same conditions. Precision: Intra-assay and inter-assay precision for all-trans retinol and alpha- tocopherol was demonstrated using commercially available quality control material and bovine serum spiked with all-trans retinol or alpha-tocopherol standard solutions. Intra-assay precision was determined from 20 serial measurements of each sample. Inter-assay precision was calculated from 15, 17 or 20 replicate determinations of each sample. The mean, coefficient of variation (CV) and standard deviation (SD) were calculated at each level for each method. Accuracy: The new LC-MS/MS method was compared to the existing HPLC method (N=48) performed at the Mayo Clinic, Biochemical Genetics Laboratory, Rochester, MN. Linearity: Linearity covering the all-trans retinol and alpha-tocopherol reportable ranges was assessed by performing serial dilutions of bovine serum spiked with all- trans retinol or alpha-tocopherol standard solutions. Each level was run in triplicate and plotted versus the expected concentrations. Specimen Stability: Specimen stability was assessed under ambient, refrigerate and frozen (-20ºC) storage conditions and the effect of multiple freeze thaw cycles was also evaluated. Ion Suppression: Ion suppression was assessed by post column infusion of all- trans retinol-d5 or alpha-tocopherol-d6 and data was collected at the expected retention time of all-trans retinol or alpha-tocopherol. Suppression of signal is visualized by the presence of an inverse peak. A second method to detect ion suppression was also utilized. A serum sample was spiked with all-trans retinol-d5 or alpha-tocopherol-d6 and then serially diluted using deionized water. Each level was run in triplicate and plotted versus the expected counts per second. Ion suppression would be detected with this technique via a non-linear regression line. Experimental Design y = 0.9864x + 4.0003 0 200 400 600 800 1000 1200 1400 1600 0 500 1000 1500 BGL HPLC MMLNELC-MS/MS All-Trans Retinol Comparison Alpha-Tocopherol Comparison R = 0.98 R = 0.95 All-Trans Retinol Linearity y = 0.9824x R 2 = 0.9993 0.0 50.0 100.0 150.0 200.0 0.0 50.0 100.0 150.0 200.0 Expected Measured