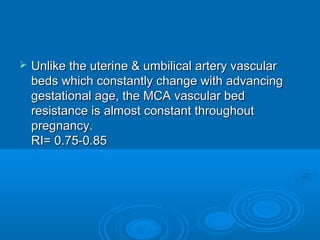
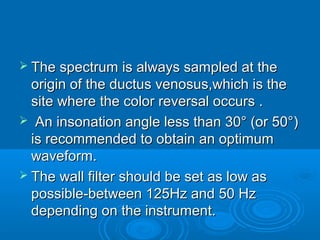
Downloaded 3,572 times
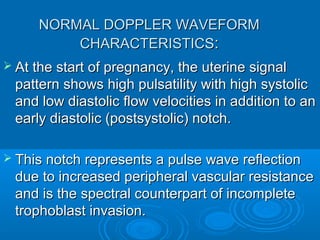

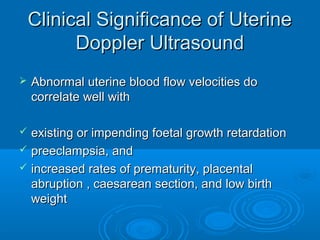

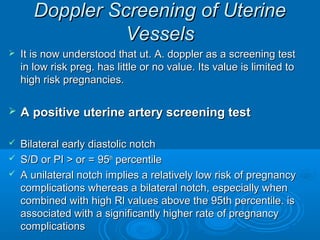


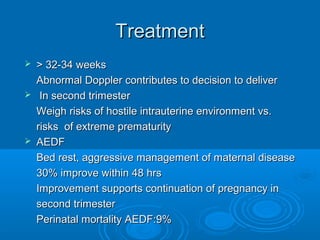
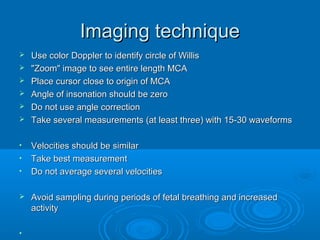
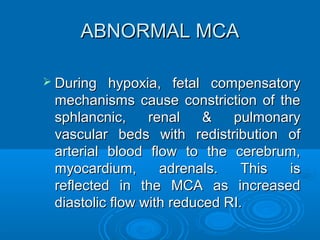
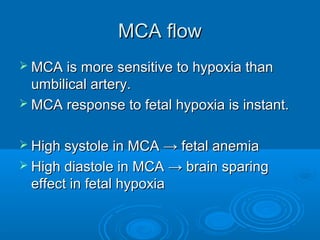
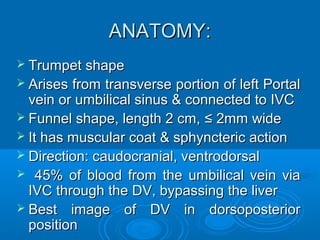
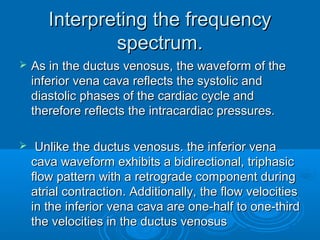
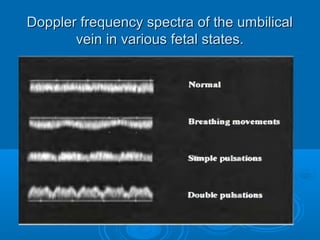
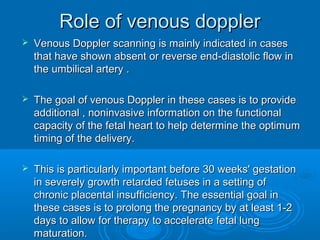
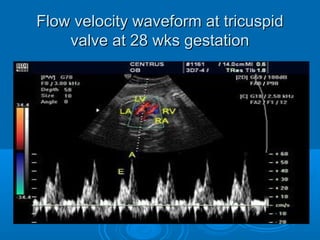
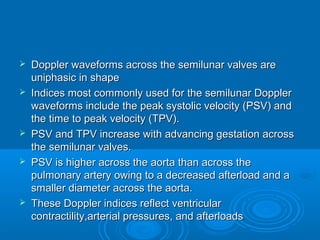
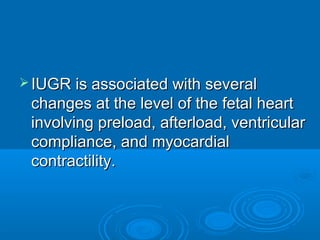
![Abnormal waveforms:
Low diastolic flow [ High resistance ] i.e
resistance indices above the 95th
percentile
AEDF
REDF
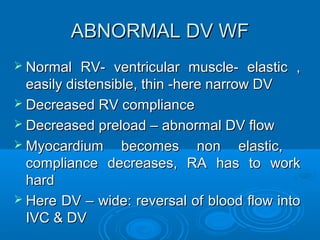
Above 3 types are an indication of
increasing resistance which correlates with
FETAL HYPOXIA.](https://image.slidesharecdn.com/yicgx0dntcopp0bhqnjj-signature-a8326c78f09981606270f38f1a5b49082740ef44d22bef0a5ab3556c7aa60744-poli-141204035905-conversion-gate01/85/Antenatal-doppler-35-320.jpg)


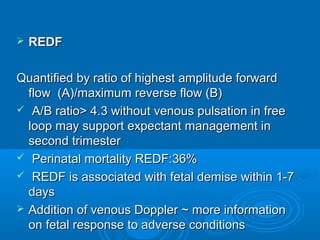

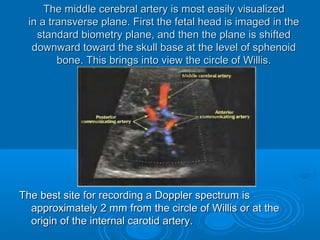


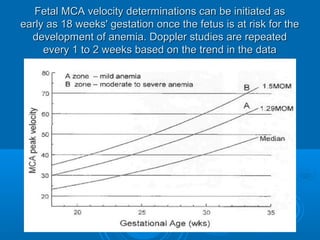


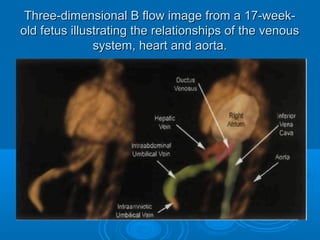
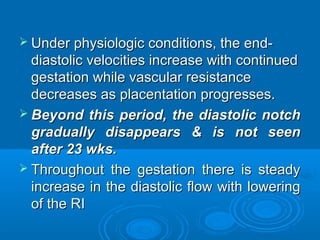
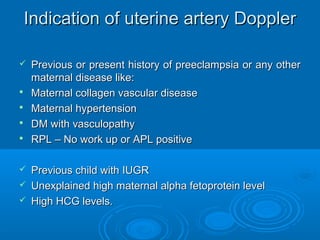
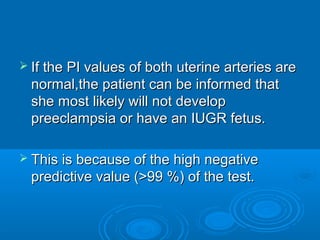
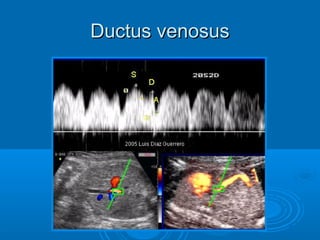
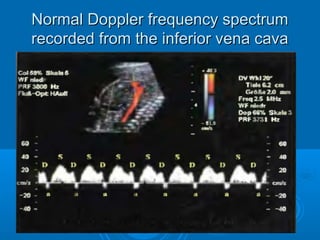
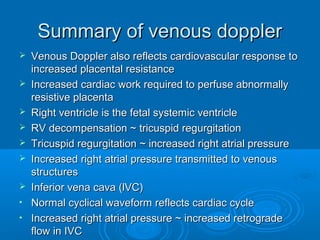
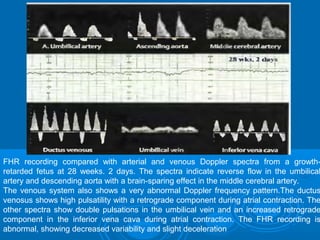
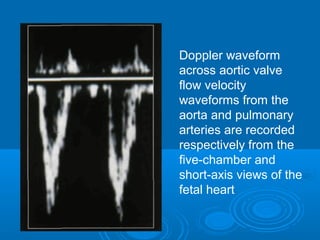
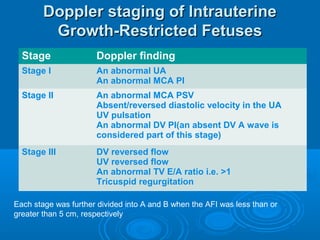
![ DV is identified in the trasverse [at the level of the portal
vein ] or sagittal section of fetal abd.
The intrahepatic segment of the umbilical vein should be
imaged first to gain rapid venous orientation.
The vein is optimally visualized either in the midsagittal
plane or in an oblique transverse scan through the fetal
abdomen (95). The intrahepatic segment of the umbilical
vein points to the site where the vein enters the ductus
venosus.
Following left portal vein as a ’c’ curve in liver , will bring
the DV into view.](https://image.slidesharecdn.com/yicgx0dntcopp0bhqnjj-signature-a8326c78f09981606270f38f1a5b49082740ef44d22bef0a5ab3556c7aa60744-poli-141204035905-conversion-gate01/85/Antenatal-doppler-86-320.jpg)


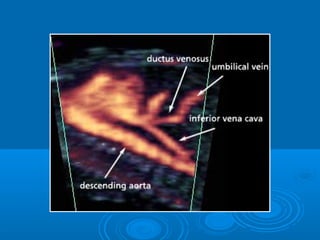
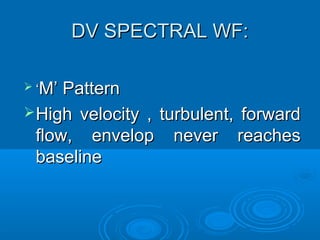
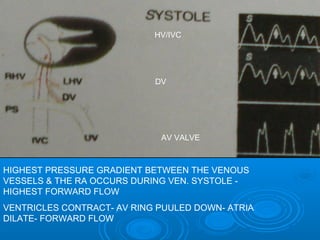
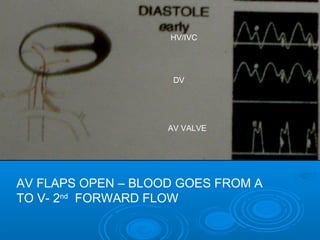
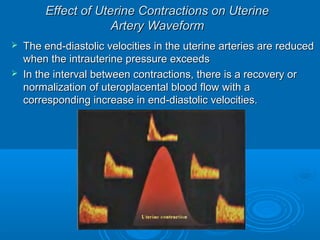
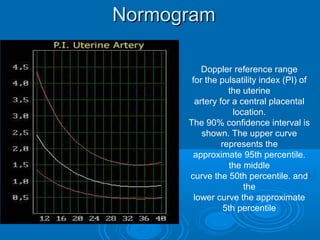
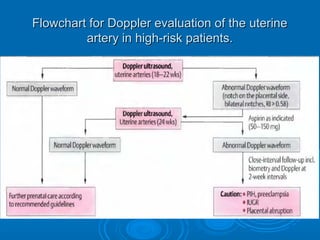
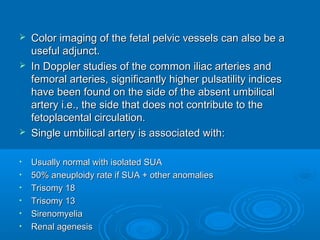
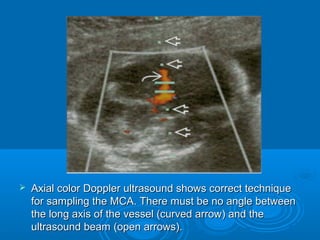
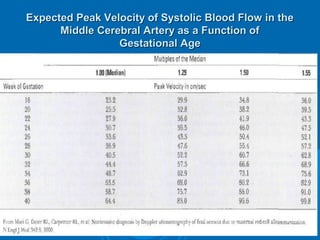
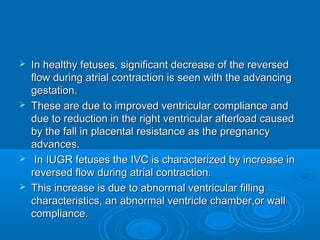
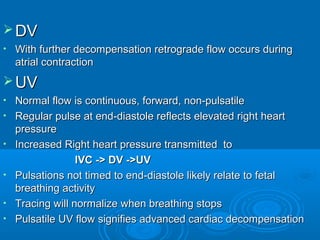
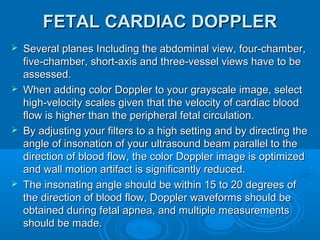
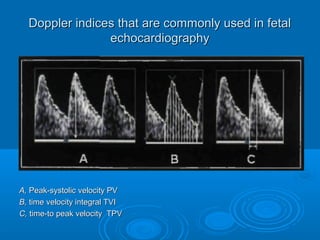
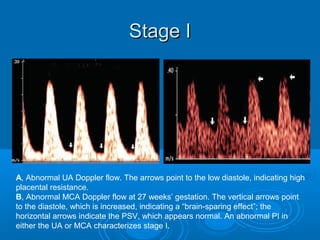
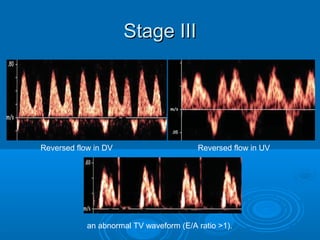
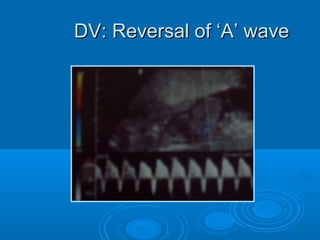
![DV – imp. event, forward flow
during atrial contraction
DV is close to heart- it reflects events of rt.
atrium
RA enlarges- ostia of IVC enlarges- RA is
full of blood, RA pressure increases than
DV pressure – only small amt. of blood
goes to RV during atria systole & through
IVC blood goes back to DV [reversal of ‘A’
wave]](https://image.slidesharecdn.com/yicgx0dntcopp0bhqnjj-signature-a8326c78f09981606270f38f1a5b49082740ef44d22bef0a5ab3556c7aa60744-poli-141204035905-conversion-gate01/85/Antenatal-doppler-100-320.jpg)
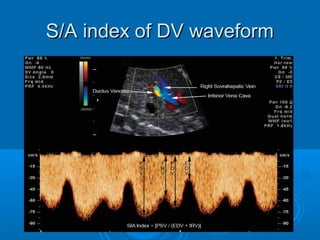
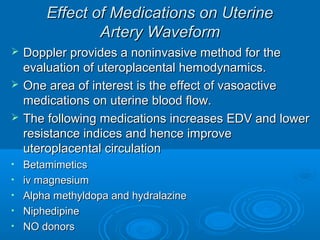
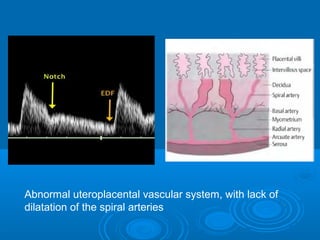
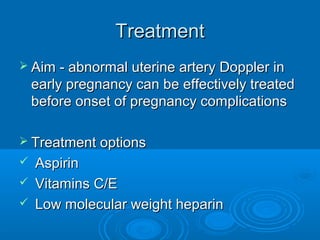
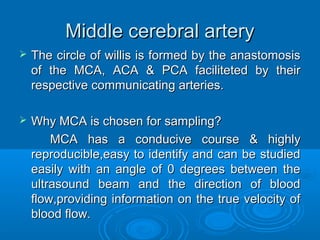
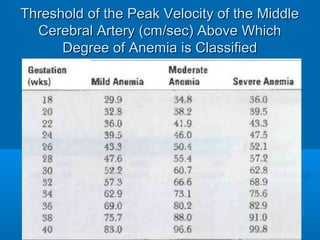
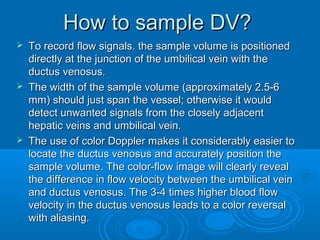
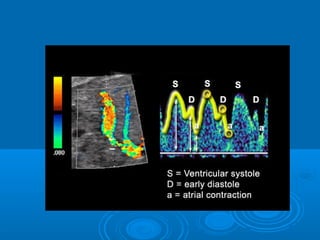
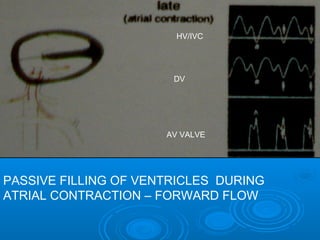
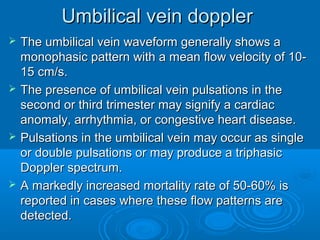
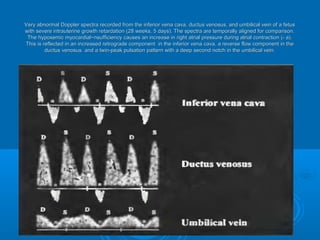
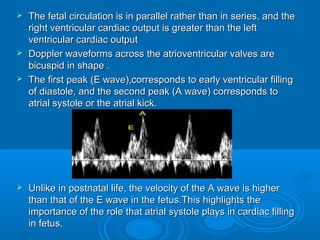
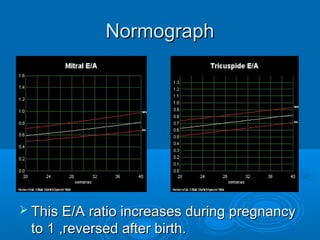
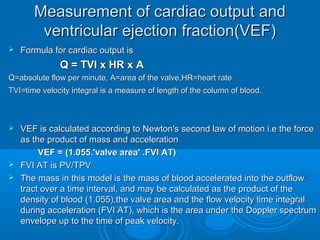
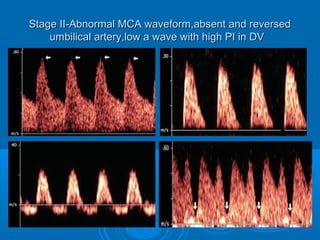
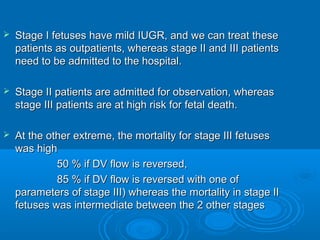
![ Ductus venosus (DV) Doppler waveforms show
2 periods of decreased velocity during
isovolumetric relaxation (isovolumetric relaxation
velocity [IRV]) and atrial contraction (A wave or
end-diastolic velocity [EDV]).
The S-wave/isovolumetric A-wave (S/A index)
for each fetus was compared to fetal/neonatal
outcomes.
(S/A) index = PSV/(IRV + EDV)](https://image.slidesharecdn.com/yicgx0dntcopp0bhqnjj-signature-a8326c78f09981606270f38f1a5b49082740ef44d22bef0a5ab3556c7aa60744-poli-141204035905-conversion-gate01/85/Antenatal-doppler-104-320.jpg)

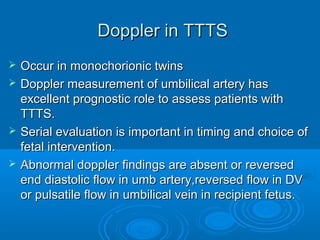
![DV: [1st trimester ]](https://image.slidesharecdn.com/yicgx0dntcopp0bhqnjj-signature-a8326c78f09981606270f38f1a5b49082740ef44d22bef0a5ab3556c7aa60744-poli-141204035905-conversion-gate01/85/Antenatal-doppler-107-320.jpg)


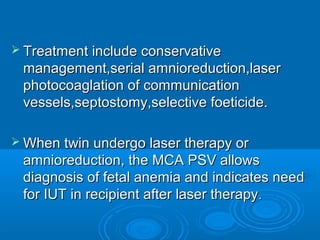
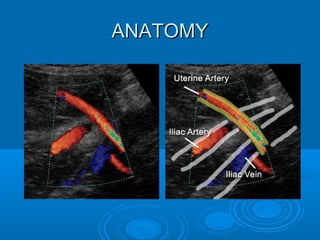
![Obstetric doppler applications
An overview
Upto 11 wks – Far, few or none
11 to14 wks – Aneuploidy screening
2nd Trimester – Congenital anomalies [e.g. aneurysm of
vein of Galen, teratoma in fetal neck, d/d lung
sequestration from micro cystic CCAM , vascular hepatic
tumors, cardiac], Uterine a. Doppler
3rd Trimester – Fetal Well being](https://image.slidesharecdn.com/yicgx0dntcopp0bhqnjj-signature-a8326c78f09981606270f38f1a5b49082740ef44d22bef0a5ab3556c7aa60744-poli-141204035905-conversion-gate01/85/Antenatal-doppler-141-320.jpg)
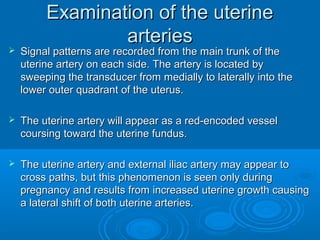
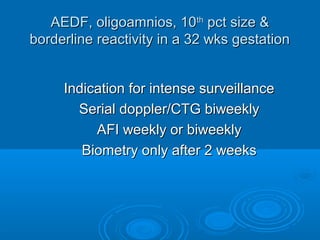
![Case : 1 Mrs. X presents for fetal growth
assessment & surveillance at 32 wks of gestation
SLF
Fetal size: 30 wks[50pct]
Est. fetal wt.–1.6kg[10pct]
HC/AC Ratio 1.1
FM good
No anomalies
Placenta – G 1
AFI - 5
Fetal tone 2
FM 2
Breathing 0
Liquor 2
CTG borderline
USG BPP
Oligoamnios, 10thpct size & borderline reactivity](https://image.slidesharecdn.com/yicgx0dntcopp0bhqnjj-signature-a8326c78f09981606270f38f1a5b49082740ef44d22bef0a5ab3556c7aa60744-poli-141204035905-conversion-gate01/85/Antenatal-doppler-142-320.jpg)
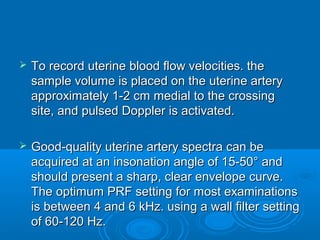
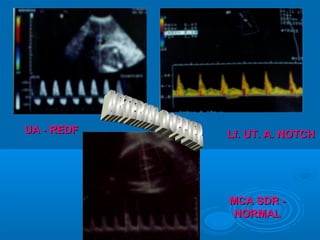
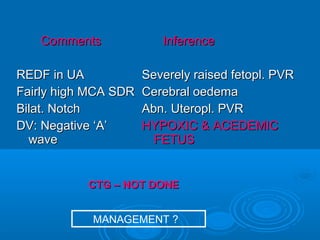
![MCA PI 1.15 [< 5th pct]
Comments
Absent diastolic flow in UA
Increased dia. Flow in MCA
Normal UT. A. Waveforms
Inference
Raised Fetopl. PVR
Early Brain sparing effect
Normal Uteropl. PVR
?? MANAGEMENT ??](https://image.slidesharecdn.com/yicgx0dntcopp0bhqnjj-signature-a8326c78f09981606270f38f1a5b49082740ef44d22bef0a5ab3556c7aa60744-poli-141204035905-conversion-gate01/85/Antenatal-doppler-143-320.jpg)
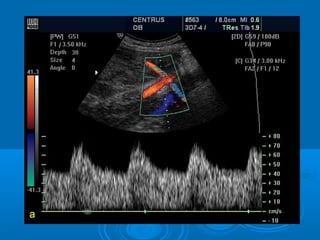
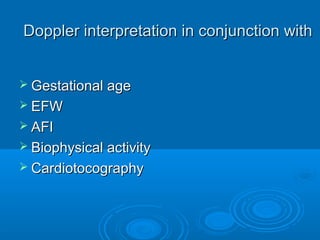
![Supportive therapy [rest, monitoring]
20 days gained
No doppler deterioration, good FM
EFW=1.7 kg, AFI 5,5,1
Steroids
LSCS when AFI Dropped 1
1.8 kg baby delivered, did well without
NICU admission
Doppler helped to recognize an at risk fetus .It
helped to prolong pregancy & thereby avoid
complications of prematurity](https://image.slidesharecdn.com/yicgx0dntcopp0bhqnjj-signature-a8326c78f09981606270f38f1a5b49082740ef44d22bef0a5ab3556c7aa60744-poli-141204035905-conversion-gate01/85/Antenatal-doppler-145-320.jpg)

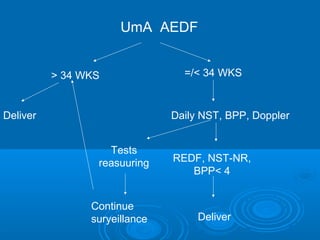
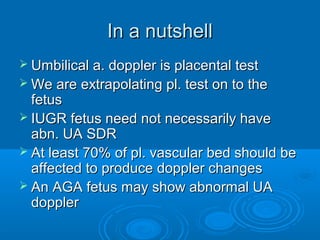
![FGR by US Biometry[ <10th pct ]
FM – Kick count – daily
Doppler, NST,BPP - Weekly
Reassuring
Continue
surveillance
>95th pct UmA DI
Rising UmA DI
AEDF
Intense
surveillance
Non – reassuring
Multiple tests
Deliver](https://image.slidesharecdn.com/yicgx0dntcopp0bhqnjj-signature-a8326c78f09981606270f38f1a5b49082740ef44d22bef0a5ab3556c7aa60744-poli-141204035905-conversion-gate01/85/Antenatal-doppler-147-320.jpg)
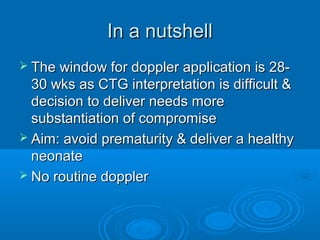
![Case: 2 Mrs. Y, 20 yrs old primi with PIH presents for a
scan. Clinically SFD ut. GA of 28 wks from dating scan. PIH
uncontrolled
USG
SLF
25 WKS
EFW:0.8 kgs [10th pct]
FM infrequent
Cardiomegaly
IVC dilated
No anomalies
Pl - G 0
AFI - 0
BIOPHYSICAL ACTIVITY
POOR
CTG not done
Symm. IUGR, Sick fetus,
Anhydamnios
Adv: Doppler](https://image.slidesharecdn.com/yicgx0dntcopp0bhqnjj-signature-a8326c78f09981606270f38f1a5b49082740ef44d22bef0a5ab3556c7aa60744-poli-141204035905-conversion-gate01/85/Antenatal-doppler-149-320.jpg)


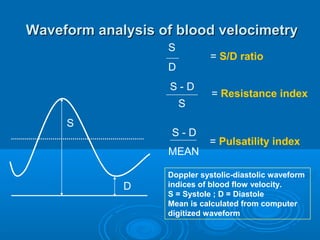
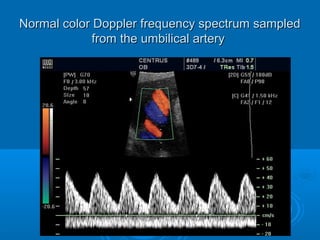
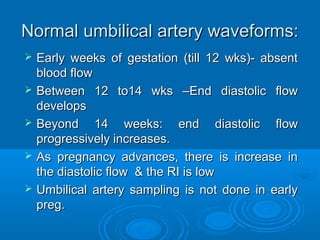
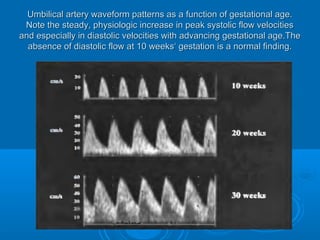
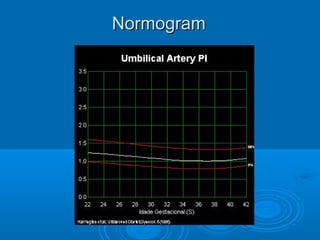
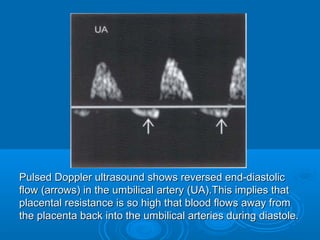
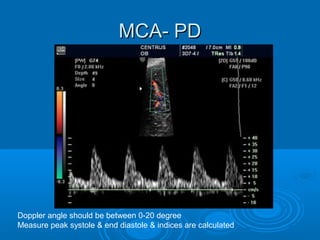
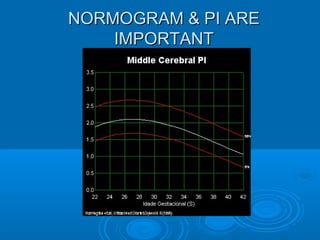
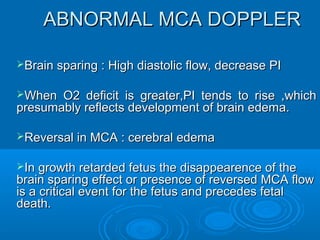
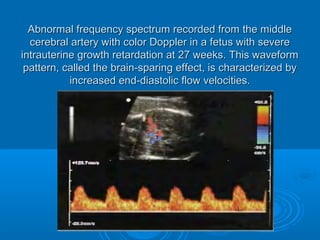
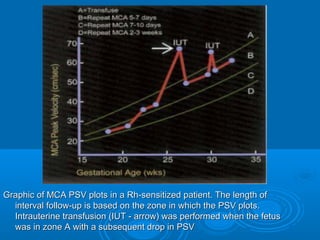
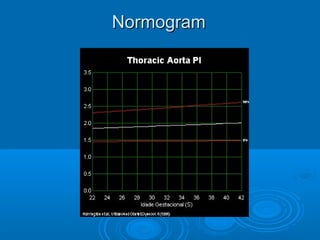
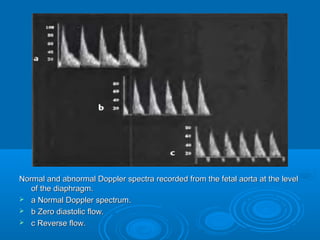
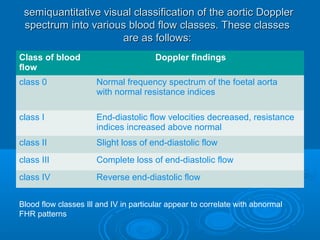
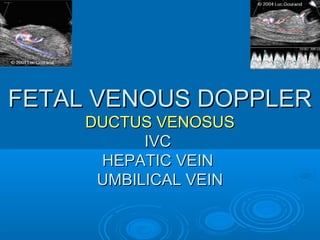
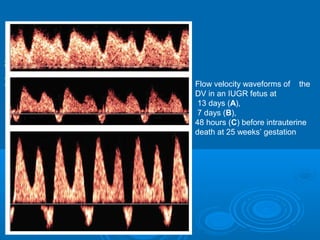
This document discusses color Doppler ultrasound techniques for fetal surveillance. It describes the anatomy of fetal and placental circulation and examines the uterine, umbilical and middle cerebral arteries. Waveform analysis using indices like S/D ratio, resistance index and pulsatility index is discussed. Normal and abnormal Doppler findings are presented along with their clinical significance and management. Precise techniques for imaging and interpreting various fetal blood vessels are provided.


![Umbilical artery doppler [1]](https://cdn.slidesharecdn.com/ss_thumbnails/umbilicalarterydoppler1-210517112207-thumbnail.jpg?width=640&height=640&fit=bounds)