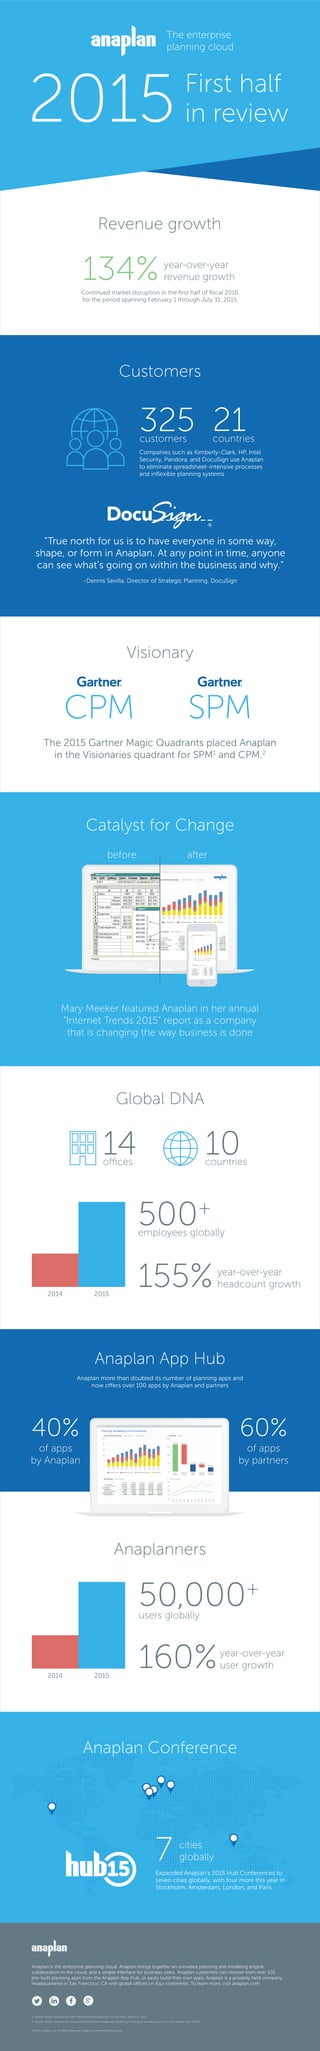
10
Global DNA
14offices countries
155%year-over-year
headcount growth
500+
employees globally
2014 2015
134%year-over-year
revenue growth
Continued market disruption in the first half of fiscal 2016
for the period spanning February 1 through July 31, 2015
Visionary
Mary Meeker featured Anaplan in her annual
“Internet Trends 2015” report as a company
that is changing the way business is done
afterbefore
Catalyst for Change
Total Company
Contract Revenue
Top Line Revenue Summary
Jan
15
Feb
15
Mar
15
Apr
15
May
15
Jun
15
Jul
15
Aug
15
Sep
15
Oct
15
Nov
15
Dec
15
10M
15M
20M
0M
5M
25M
Q1 Forecast
Professional Services Monitoring Service Revenue Whole Sale
41,603,432
(30,508,255)
11,095,177
26.67%
(4,569,926)
6,525,250
15.68%
25,432,046
Q2 FY15Q1 FY15
(19,212,883)
6,219,162
24.45%
(4,423,624)
1,795,538
7.06%
TOTAL REVENUE
TOTAL COST OF SALES
Gross Margin %
OPERATING EXPENSES
Operating Margin %
64,222,830
24,482,280
52,234,900
76,717,180
76,717,180
76,717,180
76,967180
64,222,830
Q4 FY15Q3 FY15
19,910,220
40,816,660
60,726,880
60,726,880
60,949,280
80,000,000
64,222,830
24,482,280
52,234,900
76,717,180
76,717,180
76,717,180
76,967180
FY15
GROSS PROFIT
OPERATING INCOME
Total CompanyP&L Summary
Total Company
Contract Revenue
Top Line Revenue Summary
Jan
15
Feb
15
Mar
15
Apr
15
May
15
Jun
15
10M
15M
20M
0M
5M
25M
Professional Services
Monitoring Service Revenue Whole Sale
41,603,432
(30,508,255)
11,095,177
26.67%
(4,569,926)
6,525,250
15.68%
25,432,046
Q2 FY15Q1 FY15
(19,212,883)
6,219,162
24.45%
(4,423,624)
1,795,538
7.06%
TOTAL REVENUE
TOTAL COST OF SALES
Gross Margin %
OPERATING EXPENSES
Operating Margin %
GROSS PROFIT
OPERATING INCOME
Total CompanyP&L Summary
7 cities
globally
Expanded Anaplan’s 2015 Hub Conferences to
seven cities globally, with four more this year in
Stockholm, Amsterdam, London, and Paris
160%year-over-year
user growth
50,000+
users globally
Anaplan Conference
60%
of apps
by partners
40%
of apps
by Anaplan
Anaplan more than doubled its number of planning apps and
now offers over 100 apps by Anaplan and partners
41,603,432
(30,508,255)
11,095,177
26.67%
(4,569,926)
6,525,250
15.68%
25,432,046
Q2 FY15Q1 FY15
(19,212,883)
6,219,162
24.45%
(4,423,624)
1,795,538
7.06%
TOTAL REVENUE
TOTAL COST OF SALES
Gross Margin %
OPERATING EXPENSES
Operating Margin %
64,222,830
24,482,280
52,234,900
76,717,180
76,717,180
76,717,180
76,967180
64,222,830
Q4 FY15Q3 FY15
19,910,220
40,816,660
60,726,880
60,726,880
60,949,280
80,000,000
64,222,830
24,482,280
52,234,900
76,717,180
76,717,180
76,717,180
76,967180
FY15
TOTAL REVENUE
GROSS PROFIT
OPERATING INCOME
Jan
15
Feb
15
Mar
15
Apr
15
May
15
Jun
15
Jul
15
Aug
15
Sep
15
Oct
15
Nov
15
Dec
15
10M
15M
20M
0M
5M
TOTAL
REVENUE
TOTAL COST
OF SALES
GROSS
PROFIT
OPERATING
EXPENSES
OPERATING
INCOME
100M
150M
165,997,932 -121,221,021
44,778,910
26,569,316
-18,207,594
200M
0M
50M
Total Company
Contract Revenue
Top Line Revenue Summary
Jan
15
Feb
15
Mar
15
Apr
15
May
15
Jun
15
Jul
15
Aug
15
Sep
15
Oct
15
Nov
15
Dec
15
10M
15M
20M
0M
5M
25M
Group KPIs FY15Q1 Forecast
Total CompanyP&L Summary
Planning, Budgeting, and Forecasting
Professional Services Monitoring Service Revenue Whole Sale
2014 2015
The enterprise
planning cloud
2015First half
in review
Revenue growth
Anaplan App Hub
Anaplanners
The 2015 Gartner Magic Quadrants placed Anaplan
in the Visionaries quadrant for SPM1
and CPM.2
CPM SPM
Anaplan is the enterprise planning cloud. Anaplan brings together an unrivaled planning and modeling engine,
collaboration in the cloud, and a simple interface for business users. Anaplan customers can choose from over 100
pre-built planning apps from the Anaplan App Hub, or easily build their own apps. Anaplan is a privately held company,
headquartered in San Francisco, CA with global offices on four continents. To learn more, visit anaplan.com.
© 2015 Anaplan, Inc. All Rights Reserved. Anaplan Confidential Information
1. Gartner “Magic Quadrant for Sales Performance Management” by Tad Travis, January 6, 2015.
2. Gartner “Magic Quadrant for Corporate Performance Management Suites” by Christopher Iervolino and John E. Van Decker, April 2, 2015.
“True north for us is to have everyone in some way,
shape, or form in Anaplan. At any point in time, anyone
can see what’s going on within the business and why.”
-Dennis Sevilla, Director of Strategic Planning, DocuSign
325customers
21countries
Companies such as Kimberly-Clark, HP, Intel
Security, Pandora, and DocuSign use Anaplan
to eliminate spreadsheet-intensive processes
and inflexible planning systems
Customers

Anaplan 2015 First half in review

  • 1.
    10 Global DNA 14offices countries 155%year-over-year headcountgrowth 500+ employees globally 2014 2015 134%year-over-year revenue growth Continued market disruption in the first half of fiscal 2016 for the period spanning February 1 through July 31, 2015 Visionary Mary Meeker featured Anaplan in her annual “Internet Trends 2015” report as a company that is changing the way business is done afterbefore Catalyst for Change Total Company Contract Revenue Top Line Revenue Summary Jan 15 Feb 15 Mar 15 Apr 15 May 15 Jun 15 Jul 15 Aug 15 Sep 15 Oct 15 Nov 15 Dec 15 10M 15M 20M 0M 5M 25M Q1 Forecast Professional Services Monitoring Service Revenue Whole Sale 41,603,432 (30,508,255) 11,095,177 26.67% (4,569,926) 6,525,250 15.68% 25,432,046 Q2 FY15Q1 FY15 (19,212,883) 6,219,162 24.45% (4,423,624) 1,795,538 7.06% TOTAL REVENUE TOTAL COST OF SALES Gross Margin % OPERATING EXPENSES Operating Margin % 64,222,830 24,482,280 52,234,900 76,717,180 76,717,180 76,717,180 76,967180 64,222,830 Q4 FY15Q3 FY15 19,910,220 40,816,660 60,726,880 60,726,880 60,949,280 80,000,000 64,222,830 24,482,280 52,234,900 76,717,180 76,717,180 76,717,180 76,967180 FY15 GROSS PROFIT OPERATING INCOME Total CompanyP&L Summary Total Company Contract Revenue Top Line Revenue Summary Jan 15 Feb 15 Mar 15 Apr 15 May 15 Jun 15 10M 15M 20M 0M 5M 25M Professional Services Monitoring Service Revenue Whole Sale 41,603,432 (30,508,255) 11,095,177 26.67% (4,569,926) 6,525,250 15.68% 25,432,046 Q2 FY15Q1 FY15 (19,212,883) 6,219,162 24.45% (4,423,624) 1,795,538 7.06% TOTAL REVENUE TOTAL COST OF SALES Gross Margin % OPERATING EXPENSES Operating Margin % GROSS PROFIT OPERATING INCOME Total CompanyP&L Summary 7 cities globally Expanded Anaplan’s 2015 Hub Conferences to seven cities globally, with four more this year in Stockholm, Amsterdam, London, and Paris 160%year-over-year user growth 50,000+ users globally Anaplan Conference 60% of apps by partners 40% of apps by Anaplan Anaplan more than doubled its number of planning apps and now offers over 100 apps by Anaplan and partners 41,603,432 (30,508,255) 11,095,177 26.67% (4,569,926) 6,525,250 15.68% 25,432,046 Q2 FY15Q1 FY15 (19,212,883) 6,219,162 24.45% (4,423,624) 1,795,538 7.06% TOTAL REVENUE TOTAL COST OF SALES Gross Margin % OPERATING EXPENSES Operating Margin % 64,222,830 24,482,280 52,234,900 76,717,180 76,717,180 76,717,180 76,967180 64,222,830 Q4 FY15Q3 FY15 19,910,220 40,816,660 60,726,880 60,726,880 60,949,280 80,000,000 64,222,830 24,482,280 52,234,900 76,717,180 76,717,180 76,717,180 76,967180 FY15 TOTAL REVENUE GROSS PROFIT OPERATING INCOME Jan 15 Feb 15 Mar 15 Apr 15 May 15 Jun 15 Jul 15 Aug 15 Sep 15 Oct 15 Nov 15 Dec 15 10M 15M 20M 0M 5M TOTAL REVENUE TOTAL COST OF SALES GROSS PROFIT OPERATING EXPENSES OPERATING INCOME 100M 150M 165,997,932 -121,221,021 44,778,910 26,569,316 -18,207,594 200M 0M 50M Total Company Contract Revenue Top Line Revenue Summary Jan 15 Feb 15 Mar 15 Apr 15 May 15 Jun 15 Jul 15 Aug 15 Sep 15 Oct 15 Nov 15 Dec 15 10M 15M 20M 0M 5M 25M Group KPIs FY15Q1 Forecast Total CompanyP&L Summary Planning, Budgeting, and Forecasting Professional Services Monitoring Service Revenue Whole Sale 2014 2015 The enterprise planning cloud 2015First half in review Revenue growth Anaplan App Hub Anaplanners The 2015 Gartner Magic Quadrants placed Anaplan in the Visionaries quadrant for SPM1 and CPM.2 CPM SPM Anaplan is the enterprise planning cloud. Anaplan brings together an unrivaled planning and modeling engine, collaboration in the cloud, and a simple interface for business users. Anaplan customers can choose from over 100 pre-built planning apps from the Anaplan App Hub, or easily build their own apps. Anaplan is a privately held company, headquartered in San Francisco, CA with global offices on four continents. To learn more, visit anaplan.com. © 2015 Anaplan, Inc. All Rights Reserved. Anaplan Confidential Information 1. Gartner “Magic Quadrant for Sales Performance Management” by Tad Travis, January 6, 2015. 2. Gartner “Magic Quadrant for Corporate Performance Management Suites” by Christopher Iervolino and John E. Van Decker, April 2, 2015. “True north for us is to have everyone in some way, shape, or form in Anaplan. At any point in time, anyone can see what’s going on within the business and why.” -Dennis Sevilla, Director of Strategic Planning, DocuSign 325customers 21countries Companies such as Kimberly-Clark, HP, Intel Security, Pandora, and DocuSign use Anaplan to eliminate spreadsheet-intensive processes and inflexible planning systems Customers