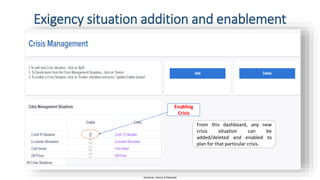
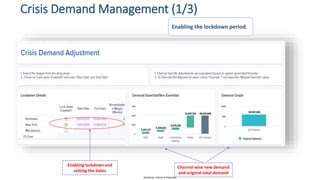
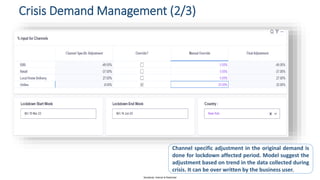
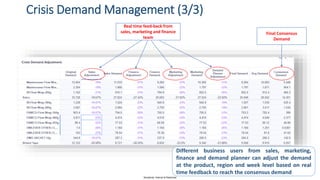
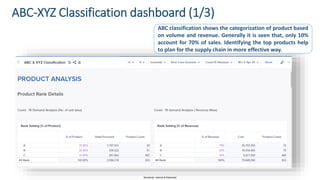
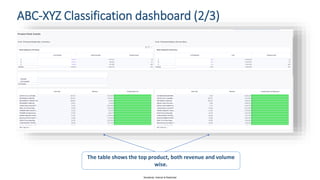
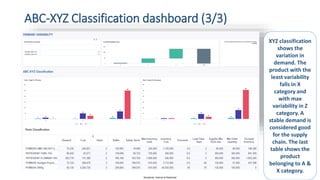
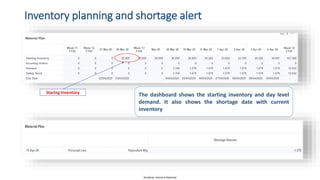
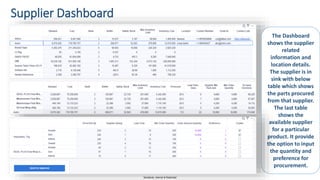
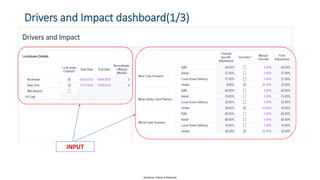
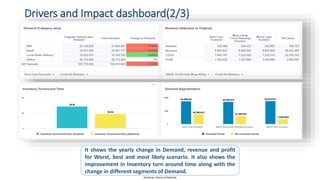
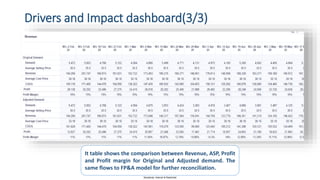
Sensitivity: Internal & Restricted
SPEED PLANNING - SCM
SNAPSHOTS
Sensitivity: Internal & Restricted
CRISIS ENABLEMENT
Sensitivity: Internal & Restricted
Exigency situation addition and enablement
From this dashboard, any new
crisis situation can be
added/deleted and enabled to
plan for that particular crisis.
Enabling
Crisis
Sensitivity: Internal & Restricted
Crisis Demand Adjustment
Sensitivity: Internal & Restricted
Crisis Demand Management (1/3)
Enabling lockdown and
setting the dates
Channel wise new demand
and original total demand
Enabling the lockdown period.
Sensitivity: Internal & Restricted
Crisis Demand Management (2/3)
Channel specific adjustment in the original demand is
done for lockdown affected period. Model suggest the
adjustment based on trend in the data collected during
crisis. It can be over written by the business user.
Sensitivity: Internal & Restricted
Crisis Demand Management (3/3)
Real time feed-back from
sales, marketing and finance
team
Final Consensus
Demand
Different business users from sales, marketing,
finance and demand planner can adjust the demand
at the product, region and week level based on real
time feedback to reach the consensus demand
Sensitivity: Internal & Restricted
ABC-XYZ Classification
Sensitivity: Internal & Restricted
ABC-XYZ Classification dashboard (1/3)
ABC classification shows the categorization of product based
on volume and revenue. Generally it is seen that, only 10%
account for 70% of sales. Identifying the top products help
to plan for the supply chain in more effective way.
Sensitivity: Internal & Restricted
ABC-XYZ Classification dashboard (2/3)
The table shows the top product, both revenue and volume
wise.
Sensitivity: Internal & Restricted
ABC-XYZ Classification dashboard (3/3)
XYZ classification
shows the
variation in
demand. The
product with the
least variability
falls in X
category and
with max
variability in Z
category. A
stable demand is
considered good
for the supply
chain. The last
table shows the
product
belonging to A &
X category.
Sensitivity: Internal & Restricted
Inventory Planning and Supplier
Dashboard
Sensitivity: Internal & Restricted
Inventory planning and shortage alert
Staring Inventory
The dashboard shows the starting inventory and day level
demand. It also shows the shortage date with current
inventory
Sensitivity: Internal & Restricted
Supplier Dashboard
The Dashboard
shows the supplier
related
information and
location details.
The supplier is in
sink with below
table which shows
the parts procured
from that supplier.
The last table
shows the
available supplier
for a particular
product. It provide
the option to input
the quantity and
preference for
procurement.
Sensitivity: Internal & Restricted
Drivers and Impact Dashboard
Sensitivity: Internal & Restricted
Drivers and Impact dashboard(1/3)
INPUT
Sensitivity: Internal & Restricted
Drivers and Impact dashboard(2/3)
It shows the yearly change in Demand, revenue and profit
for Worst, best and most likely scenario. It also shows the
improvement in Inventory turn around time along with the
change in different segments of Demand.
Sensitivity: Internal & Restricted
Drivers and Impact dashboard(3/3)
It table shows the comparison between Revenue, ASP, Profit
and Profit margin for Original and Adjusted demand. The
same flows to FP&A model for further reconciliation.

Wipro Supply Chain Management Planning

  • 1.
    Sensitivity: Internal &Restricted SPEED PLANNING - SCM SNAPSHOTS
  • 2.
    Sensitivity: Internal &Restricted CRISIS ENABLEMENT
  • 3.
    Sensitivity: Internal &Restricted Exigency situation addition and enablement From this dashboard, any new crisis situation can be added/deleted and enabled to plan for that particular crisis. Enabling Crisis
  • 4.
    Sensitivity: Internal &Restricted Crisis Demand Adjustment
  • 5.
    Sensitivity: Internal &Restricted Crisis Demand Management (1/3) Enabling lockdown and setting the dates Channel wise new demand and original total demand Enabling the lockdown period.
  • 6.
    Sensitivity: Internal &Restricted Crisis Demand Management (2/3) Channel specific adjustment in the original demand is done for lockdown affected period. Model suggest the adjustment based on trend in the data collected during crisis. It can be over written by the business user.
  • 7.
    Sensitivity: Internal &Restricted Crisis Demand Management (3/3) Real time feed-back from sales, marketing and finance team Final Consensus Demand Different business users from sales, marketing, finance and demand planner can adjust the demand at the product, region and week level based on real time feedback to reach the consensus demand
  • 8.
    Sensitivity: Internal &Restricted ABC-XYZ Classification
  • 9.
    Sensitivity: Internal &Restricted ABC-XYZ Classification dashboard (1/3) ABC classification shows the categorization of product based on volume and revenue. Generally it is seen that, only 10% account for 70% of sales. Identifying the top products help to plan for the supply chain in more effective way.
  • 10.
    Sensitivity: Internal &Restricted ABC-XYZ Classification dashboard (2/3) The table shows the top product, both revenue and volume wise.
  • 11.
    Sensitivity: Internal &Restricted ABC-XYZ Classification dashboard (3/3) XYZ classification shows the variation in demand. The product with the least variability falls in X category and with max variability in Z category. A stable demand is considered good for the supply chain. The last table shows the product belonging to A & X category.
  • 12.
    Sensitivity: Internal &Restricted Inventory Planning and Supplier Dashboard
  • 13.
    Sensitivity: Internal &Restricted Inventory planning and shortage alert Staring Inventory The dashboard shows the starting inventory and day level demand. It also shows the shortage date with current inventory
  • 14.
    Sensitivity: Internal &Restricted Supplier Dashboard The Dashboard shows the supplier related information and location details. The supplier is in sink with below table which shows the parts procured from that supplier. The last table shows the available supplier for a particular product. It provide the option to input the quantity and preference for procurement.
  • 15.
    Sensitivity: Internal &Restricted Drivers and Impact Dashboard
  • 16.
    Sensitivity: Internal &Restricted Drivers and Impact dashboard(1/3) INPUT
  • 17.
    Sensitivity: Internal &Restricted Drivers and Impact dashboard(2/3) It shows the yearly change in Demand, revenue and profit for Worst, best and most likely scenario. It also shows the improvement in Inventory turn around time along with the change in different segments of Demand.
  • 18.
    Sensitivity: Internal &Restricted Drivers and Impact dashboard(3/3) It table shows the comparison between Revenue, ASP, Profit and Profit margin for Original and Adjusted demand. The same flows to FP&A model for further reconciliation.