
Recommended
More Related Content
What's hot
What's hot (20)
Similar to Analysis and Diagnosis of a clinical case using clinical, biochemical and analytical methods
Similar to Analysis and Diagnosis of a clinical case using clinical, biochemical and analytical methods (20)
Recently uploaded
Recently uploaded (20)
Analysis and Diagnosis of a clinical case using clinical, biochemical and analytical methods
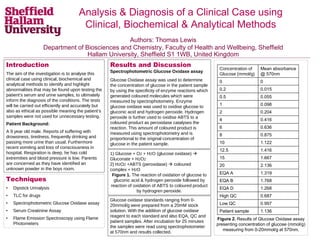
- 1. Introduction The aim of the investigation is to analyse this clinical case using clinical, biochemical and analytical methods to identify and highlight abnormalities that may be found upon testing the patient’s serum and urine samples, to ultimately inform the diagnosis of the conditions. The tests will be carried out efficiently and accurately but also as ethical as possible meaning the patient’s samples were not used for unnecessary testing. Patient Background: A 9 year old male. Reports of suffering with drowsiness, tiredness, frequently drinking and passing more urine than usual. Furthermore recent vomiting and loss of consciousness in hospital. Respiration is deep, he has cold extremities and blood pressure is low. Parents are concerned as they have identified an unknown powder in the boys room. Figure 2. Results of Glucose Oxidase assay presenting concentration of glucose (mmol/g) measuring from 0-20mmol/g at 570nm. Results and Discussion Spectrophotometric Glucose Oxidase assay Glucose Oxidase assay was used to determine the concentration of glucose in the patient sample by using the specificity of enzyme reactions which generated coloured molecules which were measured by spectrophotometry. Enzyme glucose oxidase was used to oxidise glucose to gluconic acid and hydrogen peroxide. Hydrogen peroxide is further used to oxidise ABTS to a coloured product as peroxidase catalyses the reaction. This amount of coloured product is measured using spectrophotometry and is proportional to the original concentration of glucose in the patient sample. Department of Biosciences Authors: Thomas Lewis Department of Biosciences and Chemistry, Faculty of Health and Wellbeing, Sheffield Hallam University, Sheffield S1 1WB, United Kingdom Analysis & Diagnosis of a Clinical Case using Clinical, Biochemical & Analytical Methods Techniques • Dipstick Urinalysis • TLC for drugs • Spectrophotometric Glucose Oxidase assay • Serum Creatinine Assay • Flame Emission Spectroscopy using Flame Photometers 1) Glucose + O2 + H2O (glucose oxidase) Gluconate + H2O2 2) H2O2 +ABTS (peroxidase) coloured complex + H2O Figure 1. The reaction of oxidation of glucose to gluconic acid & hydrogen peroxide followed by reaction of oxidation of ABTS to coloured product by hydrogren peroxide. Concentration of Glucose (mmol/g) Mean absorbance @ 570nm 0 0 0.2 0.015 0.5 0.055 1 0.098 2 0.204 4 0.416 6 0.636 8 0.875 10 1.122 12.5 1.416 15 1.667 20 2.136 EQA A 1.319 EQA B 1.768 EQA D 1.268 High QC 0.687 Low QC 0.997 Patient sample 1.136 Glucose oxidase standards ranging from 0- 20mmol/g were prepared from a 20mM stock solution. With the addition of glucose oxidase reagent to each standard and also EQA, QC and patient samples. After incubation for 25 minutes the samples were read using spectrophotometer at 570nm and results collected.
- 2. Materials and Methods Dipstick Urinalysis Basic urine examination to determine glucose, protein (albumin), ketones concentration and pH of urine by dipping test strip into patient urine sample. This technique works as the acid-base indicator changes colour in the presence of i.e. protein (albumin) as protons are removed from the indicator and bind to albumin binding sites (Bartos, et al. 2016). TLC for drugs Simple analysis technique used to determine the identity of unknown powder content found in Patient A’s bedroom. Standards of analgesics were run to compare the unknown to. Caffeine standard was also run. Solution was extracted from the unknown powder by dissolving in ethanol. The standards and unknown were spotted onto TLC plate which was then placed in TLC developing solvent and left to run until solvent had risen just above the top of the plate. Analysis was then undertook by calculating Rf value to determine identity of unknown. Flame Emission Spectroscopy using Flame Photometers Bioanalytical technique using Flame Photometers (FP) to determine levels of serum electrolytes Na+ and K+ in patient sample. FP uses the principle of a simple flame test by introducing the sample to the flame. The electrons become excited but then lose energy by emitting light of a specific wavelength. This is measured allowing the concentration of the electrolytes to be estimated. Sets of standards were produced using stock sodium and potassium solutions. The standards were then aspirated followed by QC samples and the patient sample. A calibration graph was plotted for each electrolyte and the patient sample read off each to determine electrolyte concentration. Conclusions Dipstick urinalysis shows abnormally high glucose concentration in patient urine, supported by further analysis by glucose oxidase assay. Serum creatinine analysis proved to be inconclusive however high glucose concentration and low potassium and sodium levels are traits associated with diabetes or renal failure. References Vladimir Bartos et al. (2016). Clinical Biochemistry (1st ed). ISBN 978-80-246-3497-5 (pdf) Additional Results Dipstick Urinalysis This method of determination is most sensitive to protein (albumin) and the result of protein in Patient A urine sample was negative. Dipstick urinalysis also determined an abnormality in slightly raised ketones concentration at 15mg/dL, which can cause low K+ levels as found below from Flame Emission Spectroscopy. However pH of patient serum sample was within healthy range and no concern. TLC for drugs This method determined the putative identity of the unknown powder as paracetamol. Flame Emission Spectroscopy using Flame Photometers This method determined the concentration of Na+ in the patient sample to be 40 mmol L-1 and the concentration of K+ to be 0.9mmol L-1. These results are abnormally very low. Serum Creatinine Assay Calculation to determine creatinine concentration proved to be inconclusive therefore if there was more time this assay should be conducted again to conclude the clinical investigation. -0.5 0 0.5 1 1.5 2 2.5 0 5 10 15 20 25 Absorbanceat570nm Concentration (mmol L-1) Determination of glucose concentration in biological sample using spectroscopy. Figure 3. Calibration graph of patient sample using glucose oxidase assay to determine glucose concentration. Glucose concentration from original patient sample was calculated = 53 mmol L-1. This result certainly is abnormal as it is very high above the normal reference range of a healthy individual. Serum Creatinine Assay Standards and patient samples were prepared and assayed using 96-well plate protocol before being loaded with working reagent. Plate was incubated for 1 minute then the absorbance measured at 492nm by plate reader. After a further 4 mins incubation the absorbance was measured again. Sample Abs @ 492nm 1min Abs @ 492nm 5min 1 0.044 0.046 2 0.045 0.046 3 0.043 0.045 Mean 0.044 0.0456 Patient 0.0463 0.0463 Control 0.043 0.0443 Figure 4. Results of Serum Creatinine assay presenting absorbance of samples at 492nm at 1 minute and 5 minutes.