


![bipin_ppt_most_important[1] - Read-Only.pptx](https://cdn.slidesharecdn.com/ss_thumbnails/bipinpptmostimportant1-read-only-251220122435-b3a2f11c-thumbnail.jpg?width=640&height=640&fit=bounds)
DM Garby_Vitamin C AACC 2011
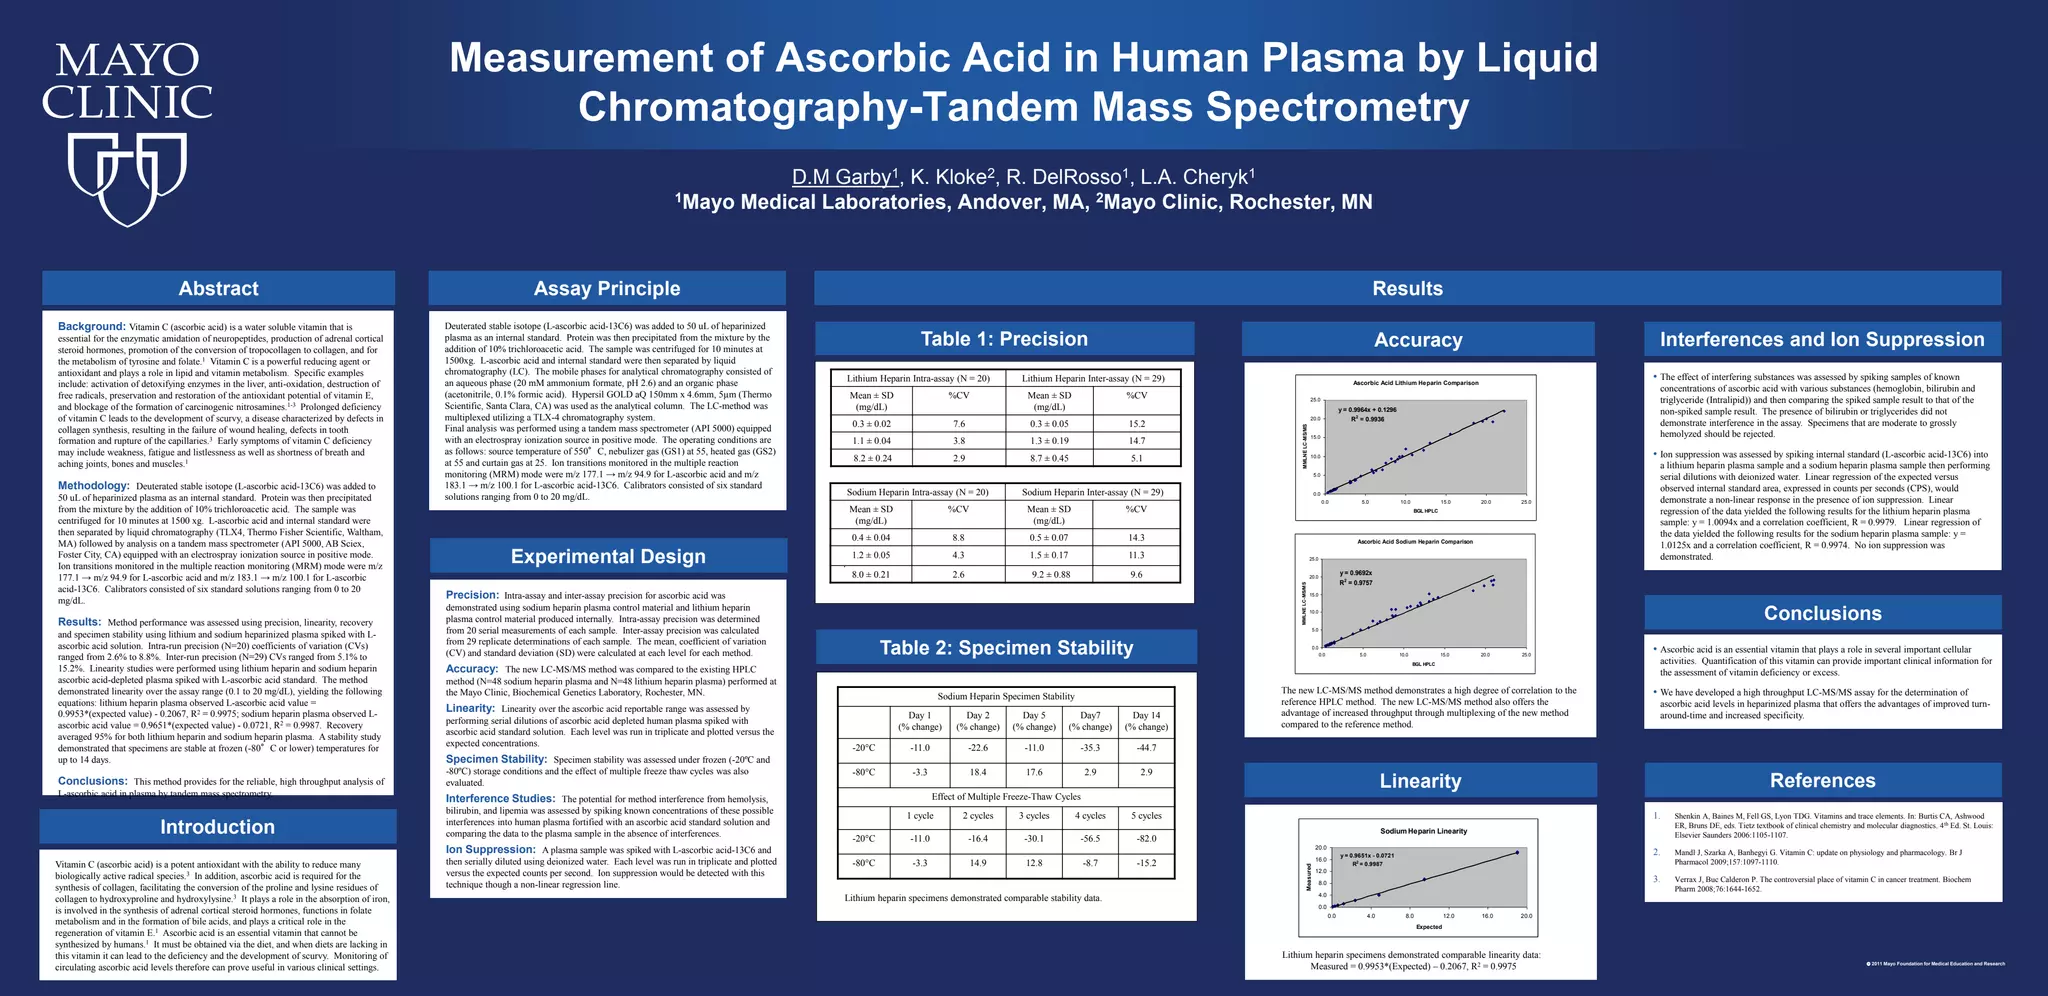
- 1. Lithium heparin specimensdemonstrated comparable stability data. Table 2: Specimen Stability The new LC-MS/MS method demonstrates a high degree of correlation to the reference HPLC method. The new LC-MS/MS method also offers the advantage of increased throughput through multiplexing of the new method compared to the reference method. Accuracy Measurement of Ascorbic Acid in Human Plasma by Liquid Chromatography-Tandem Mass Spectrometry Ascorbic Acid Lithium Heparin Comparison y = 0.9964x + 0.1296 R2 = 0.9936 0.0 5.0 10.0 15.0 20.0 25.0 0.0 5.0 10.0 15.0 20.0 25.0 BGL HPLC MMLNELC-MS/MS D.M Garby1, K. Kloke2, R. DelRosso1, L.A. Cheryk1 1Mayo Medical Laboratories, Andover, MA, 2Mayo Clinic, Rochester, MN Table 1: Precision . • The effect of interfering substances was assessed by spiking samples of known concentrations of ascorbic acid with various substances (hemoglobin, bilirubin and triglyceride (Intralipid)) and then comparing the spiked sample result to that of the non-spiked sample result. The presence of bilirubin or triglycerides did not demonstrate interference in the assay. Specimens that are moderate to grossly hemolyzed should be rejected. • Ion suppression was assessed by spiking internal standard (L-ascorbic acid-13C6) into a lithium heparin plasma sample and a sodium heparin plasma sample then performing serial dilutions with deionized water. Linear regression of the expected versus observed internal standard area, expressed in counts per seconds (CPS), would demonstrate a non-linear response in the presence of ion suppression. Linear regression of the data yielded the following results for the lithium heparin plasma sample: y = 1.0094x and a correlation coefficient, R = 0.9979. Linear regression of the data yielded the following results for the sodium heparin plasma sample: y = 1.0125x and a correlation coefficient, R = 0.9974. No ion suppression was demonstrated. Interferences and Ion Suppression • Ascorbic acid is an essential vitamin that plays a role in several important cellular activities. Quantification of this vitamin can provide important clinical information for the assessment of vitamin deficiency or excess. • We have developed a high throughput LC-MS/MS assay for the determination of ascorbic acid levels in heparinized plasma that offers the advantages of improved turn- around-time and increased specificity. Conclusions 1. Shenkin A, Baines M, Fell GS, Lyon TDG. Vitamins and trace elements. In: Burtis CA, Ashwood ER, Bruns DE, eds. Tietz textbook of clinical chemistry and molecular diagnostics. 4th Ed. St. Louis: Elsevier Saunders 2006:1105-1107. 2. Mandl J, Szarka A, Banhegyi G. Vitamin C: update on physiology and pharmacology. Br J Pharmacol 2009;157:1097-1110. 3. Verrax J, Buc Calderon P. The controversial place of vitamin C in cancer treatment. Biochem Pharm 2008;76:1644-1652. References Background: Vitamin C (ascorbic acid) is a water soluble vitamin that is essential for the enzymatic amidation of neuropeptides, production of adrenal cortical steroid hormones, promotion of the conversion of tropocollagen to collagen, and for the metabolism of tyrosine and folate.1 Vitamin C is a powerful reducing agent or antioxidant and plays a role in lipid and vitamin metabolism. Specific examples include: activation of detoxifying enzymes in the liver, anti-oxidation, destruction of free radicals, preservation and restoration of the antioxidant potential of vitamin E, and blockage of the formation of carcinogenic nitrosamines.1-3 Prolonged deficiency of vitamin C leads to the development of scurvy, a disease characterized by defects in collagen synthesis, resulting in the failure of wound healing, defects in tooth formation and rupture of the capillaries.3 Early symptoms of vitamin C deficiency may include weakness, fatigue and listlessness as well as shortness of breath and aching joints, bones and muscles.1 Methodology: Deuterated stable isotope (L-ascorbic acid-13C6) was added to 50 uL of heparinized plasma as an internal standard. Protein was then precipitated from the mixture by the addition of 10% trichloroacetic acid. The sample was centrifuged for 10 minutes at 1500 xg. L-ascorbic acid and internal standard were then separated by liquid chromatography (TLX4, Thermo Fisher Scientific, Waltham, MA) followed by analysis on a tandem mass spectrometer (API 5000, AB Sciex, Foster City, CA) equipped with an electrospray ionization source in positive mode. Ion transitions monitored in the multiple reaction monitoring (MRM) mode were m/z 177.1 → m/z 94.9 for L-ascorbic acid and m/z 183.1 → m/z 100.1 for L-ascorbic acid-13C6. Calibrators consisted of six standard solutions ranging from 0 to 20 mg/dL. Results: Method performance was assessed using precision, linearity, recovery and specimen stability using lithium and sodium heparinized plasma spiked with L- ascorbic acid solution. Intra-run precision (N=20) coefficients of variation (CVs) ranged from 2.6% to 8.8%. Inter-run precision (N=29) CVs ranged from 5.1% to 15.2%. Linearity studies were performed using lithium heparin and sodium heparin ascorbic acid-depleted plasma spiked with L-ascorbic acid standard. The method demonstrated linearity over the assay range (0.1 to 20 mg/dL), yielding the following equations: lithium heparin plasma observed L-ascorbic acid value = 0.9953*(expected value) - 0.2067, R2 = 0.9975; sodium heparin plasma observed L- ascorbic acid value = 0.9651*(expected value) - 0.0721, R2 = 0.9987. Recovery averaged 95% for both lithium heparin and sodium heparin plasma. A stability study demonstrated that specimens are stable at frozen (-80°C or lower) temperatures for up to 14 days. Conclusions: This method provides for the reliable, high throughput analysis of L-ascorbic acid in plasma by tandem mass spectrometry. Abstract Vitamin C (ascorbic acid) is a potent antioxidant with the ability to reduce many biologically active radical species.3 In addition, ascorbic acid is required for the synthesis of collagen, facilitating the conversion of the proline and lysine residues of collagen to hydroxyproline and hydroxylysine.3 It plays a role in the absorption of iron, is involved in the synthesis of adrenal cortical steroid hormones, functions in folate metabolism and in the formation of bile acids, and plays a critical role in the regeneration of vitamin E.1 Ascorbic acid is an essential vitamin that cannot be synthesized by humans.1 It must be obtained via the diet, and when diets are lacking in this vitamin it can lead to the deficiency and the development of scurvy. Monitoring of circulating ascorbic acid levels therefore can prove useful in various clinical settings. Introduction Precision: Intra-assay and inter-assay precision for ascorbic acid was demonstrated using sodium heparin plasma control material and lithium heparin plasma control material produced internally. Intra-assay precision was determined from 20 serial measurements of each sample. Inter-assay precision was calculated from 29 replicate determinations of each sample. The mean, coefficient of variation (CV) and standard deviation (SD) were calculated at each level for each method. Accuracy: The new LC-MS/MS method was compared to the existing HPLC method (N=48 sodium heparin plasma and N=48 lithium heparin plasma) performed at the Mayo Clinic, Biochemical Genetics Laboratory, Rochester, MN. Linearity: Linearity over the ascorbic acid reportable range was assessed by performing serial dilutions of ascorbic acid depleted human plasma spiked with ascorbic acid standard solution. Each level was run in triplicate and plotted versus the expected concentrations. Specimen Stability: Specimen stability was assessed under frozen (-20ºC and -80ºC) storage conditions and the effect of multiple freeze thaw cycles was also evaluated. Interference Studies: The potential for method interference from hemolysis, bilirubin, and lipemia was assessed by spiking known concentrations of these possible interferences into human plasma fortified with an ascorbic acid standard solution and comparing the data to the plasma sample in the absence of interferences. Ion Suppression: A plasma sample was spiked with L-ascorbic acid-13C6 and then serially diluted using deionized water. Each level was run in triplicate and plotted versus the expected counts per second. Ion suppression would be detected with this technique though a non-linear regression line. Experimental Design 2011 Mayo Foundation for Medical Education and Research Deuterated stable isotope (L-ascorbic acid-13C6) was added to 50 uL of heparinized plasma as an internal standard. Protein was then precipitated from the mixture by the addition of 10% trichloroacetic acid. The sample was centrifuged for 10 minutes at 1500xg. L-ascorbic acid and internal standard were then separated by liquid chromatography (LC). The mobile phases for analytical chromatography consisted of an aqueous phase (20 mM ammonium formate, pH 2.6) and an organic phase (acetonitrile, 0.1% formic acid). Hypersil GOLD aQ 150mm x 4.6mm, 5µm (Thermo Scientific, Santa Clara, CA) was used as the analytical column. The LC-method was multiplexed utilizing a TLX-4 chromatography system. Final analysis was performed using a tandem mass spectrometer (API 5000) equipped with an electrospray ionization source in positive mode. The operating conditions are as follows: source temperature of 550°C, nebulizer gas (GS1) at 55, heated gas (GS2) at 55 and curtain gas at 25. Ion transitions monitored in the multiple reaction monitoring (MRM) mode were m/z 177.1 → m/z 94.9 for L-ascorbic acid and m/z 183.1 → m/z 100.1 for L-ascorbic acid-13C6. Calibrators consisted of six standard solutions ranging from 0 to 20 mg/dL. Assay Principle Results Lithium Heparin Intra-assay (N = 20) Lithium Heparin Inter-assay (N = 29) Mean ± SD (mg/dL) %CV Mean ± SD (mg/dL) %CV 0.3 ± 0.02 7.6 0.3 ± 0.05 15.2 1.1 ± 0.04 3.8 1.3 ± 0.19 14.7 8.2 ± 0.24 2.9 8.7 ± 0.45 5.1 Sodium Heparin Intra-assay (N = 20) Sodium Heparin Inter-assay (N = 29) Mean ± SD (mg/dL) %CV Mean ± SD (mg/dL) %CV 0.4 ± 0.04 8.8 0.5 ± 0.07 14.3 1.2 ± 0.05 4.3 1.5 ± 0.17 11.3 8.0 ± 0.21 2.6 9.2 ± 0.88 9.6 Lithium heparin specimens demonstrated comparable linearity data: Measured = 0.9953*(Expected) – 0.2067, R2 = 0.9975 Linearity Ascorbic Acid Lithium Heparin Comparison y = 0.9964x + 0.1296 R2 = 0.9936 0.0 5.0 10.0 15.0 20.0 25.0 0.0 5.0 10.0 15.0 20.0 25.0 BGL HPLC MMLNELC-MS/MS Ascorbic Acid Sodium Heparin Comparison y = 0.9692x R2 = 0.9757 0.0 5.0 10.0 15.0 20.0 25.0 0.0 5.0 10.0 15.0 20.0 25.0 BGL HPLC MMLNELC-MS/MS Sodium Heparin Specimen Stability Day 1 (% change) Day 2 (% change) Day 5 (% change) Day7 (% change) Day 14 (% change) -20°C -11.0 -22.6 -11.0 -35.3 -44.7 -80°C -3.3 18.4 17.6 2.9 2.9 Effect of Multiple Freeze-Thaw Cycles 1 cycle 2 cycles 3 cycles 4 cycles 5 cycles -20°C -11.0 -16.4 -30.1 -56.5 -82.0 -80°C -3.3 14.9 12.8 -8.7 -15.2 Sodium Heparin Linearity y = 0.9651x - 0.0721 R 2 = 0.9987 0.0 4.0 8.0 12.0 16.0 20.0 0.0 4.0 8.0 12.0 16.0 20.0 Expected Measured