SOFTWARE ENGINEERING
SOFTWARE ENGINEERING
CHAPTEROBJECTIVES
● Understand how graphical models can be used to represent software
systems and why several types of model are needed to fully represent a
system;
● Understand the fundamental system modeling perspectives of context,
interaction, structure, and behavior;
● Understand the principal diagram types in the Unified Modeling
Language (UML) and how these diagrams may be used in system
modeling
SOFTWARE ENGINEERING
SOFTWARE ENGINEERING
SYSTEMMODELING
System modeling is the process of developing abstract models of a system,
with each model presenting a different view or perspective of that system.
System modeling now usually means representing a system using some kind
of graphical notation based on diagram types in the Unified Modeling
Language (UML).
5.
SOFTWARE ENGINEERING
SOFTWARE ENGINEERING
SYSTEMMODELING
The graphical representation of the system which the software developer
wants to develop is called a system model. The system is developed based
on user requirements and system requirements.
The system models describe the system in detail using graphical notation.
SOFTWARE ENGINEERING
SOFTWARE ENGINEERING
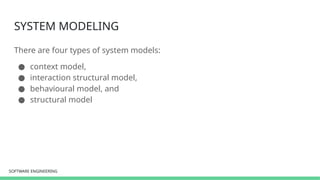
CONTEXTMODEL
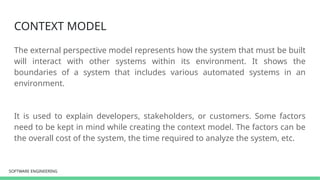
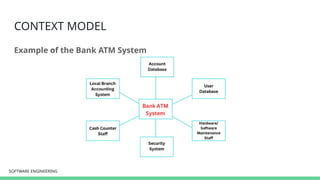
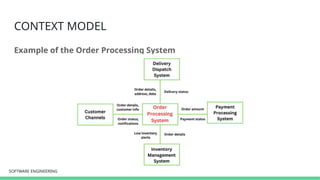
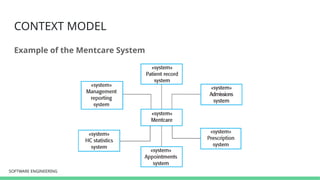
The external perspective model represents how the system that must be built
will interact with other systems within its environment. It shows the
boundaries of a system that includes various automated systems in an
environment.
It is used to explain developers, stakeholders, or customers. Some factors
need to be kept in mind while creating the context model. The factors can be
the overall cost of the system, the time required to analyze the system, etc.
SOFTWARE ENGINEERING
SOFTWARE ENGINEERING
INTERACTIONMODEL
All systems involve interaction of some kind. This can be user interaction,
which involves user inputs and outputs; interaction between the software
being developed and other systems in its environment; or interaction
between the components of a software system.
14.
SOFTWARE ENGINEERING
SOFTWARE ENGINEERING
INTERACTIONMODEL
There are two related approaches to interaction modeling:
● Use case modeling - which is mostly used to model interactions
between a system and external agents (human users or other systems)
● Sequence diagrams - which are used to model interactions between
system components, although external agents may also be included.
15.
SOFTWARE ENGINEERING
SOFTWARE ENGINEERING
INTERACTIONMODEL
Use Case Modeling
Use case modeling was originally developed by Ivar Jacobsen in the 1990s
(Jacobsen et al. 1993), and a UML diagram type to support use case modeling
is part of the UML.
16.
SOFTWARE ENGINEERING
SOFTWARE ENGINEERING
INTERACTIONMODEL
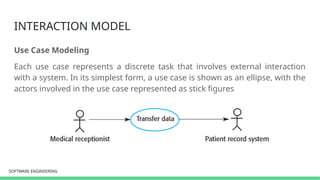
Use Case Modeling
Each use case represents a discrete task that involves external interaction
with a system. In its simplest form, a use case is shown as an ellipse, with the
actors involved in the use case represented as stick figures
SOFTWARE ENGINEERING
SOFTWARE ENGINEERING
INTERACTIONMODEL
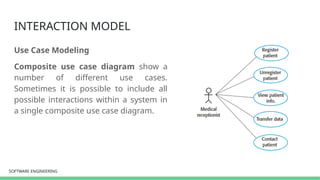
Use Case Modeling
Composite use case diagram show a
number of different use cases.
Sometimes it is possible to include all
possible interactions within a system in
a single composite use case diagram.
19.
SOFTWARE ENGINEERING
SOFTWARE ENGINEERING
INTERACTIONMODEL
Sequence Modeling
Sequence diagrams in the UML are primarily used to model the interactions
between the actors and the objects in a system and the interactions between
the objects themselves.
As the name implies, a sequence diagram shows the sequence of interactions
that take place during a particular use case or use case instance.
20.
SOFTWARE ENGINEERING
SOFTWARE ENGINEERING
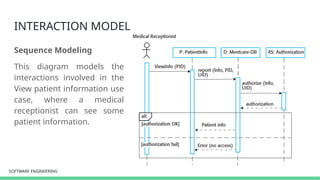
INTERACTIONMODEL
Sequence Modeling
This diagram models the
interactions involved in the
View patient information use
case, where a medical
receptionist can see some
patient information.
SOFTWARE ENGINEERING
SOFTWARE ENGINEERING
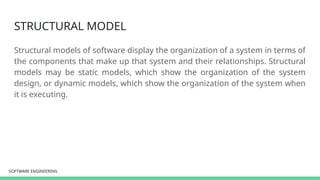
STRUCTURALMODEL
Structural models of software display the organization of a system in terms of
the components that make up that system and their relationships. Structural
models may be static models, which show the organization of the system
design, or dynamic models, which show the organization of the system when
it is executing.
23.
SOFTWARE ENGINEERING
SOFTWARE ENGINEERING
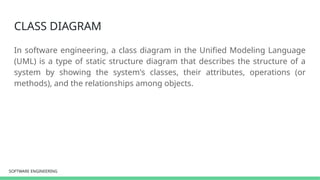
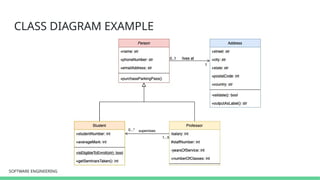
CLASSDIAGRAM
In software engineering, a class diagram in the Unified Modeling Language
(UML) is a type of static structure diagram that describes the structure of a
system by showing the system's classes, their attributes, operations (or
methods), and the relationships among objects.
24.
SOFTWARE ENGINEERING
SOFTWARE ENGINEERING
CLASSDIAGRAM
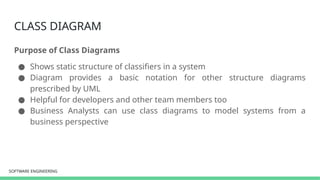
Purpose of Class Diagrams
● Shows static structure of classifiers in a system
● Diagram provides a basic notation for other structure diagrams
prescribed by UML
● Helpful for developers and other team members too
● Business Analysts can use class diagrams to model systems from a
business perspective
SOFTWARE ENGINEERING
SOFTWARE ENGINEERING
CLASSDIAGRAM
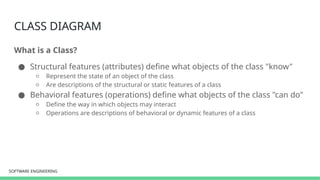
What is a Class?
● Structural features (attributes) define what objects of the class "know"
○ Represent the state of an object of the class
○ Are descriptions of the structural or static features of a class
● Behavioral features (operations) define what objects of the class "can do"
○ Define the way in which objects may interact
○ Operations are descriptions of behavioral or dynamic features of a class
27.
SOFTWARE ENGINEERING
SOFTWARE ENGINEERING
CLASSDIAGRAM
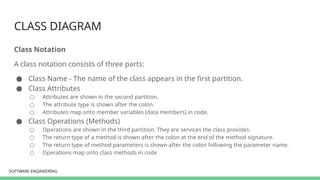
Class Notation
A class notation consists of three parts:
● Class Name - The name of the class appears in the first partition.
● Class Attributes
○ Attributes are shown in the second partition.
○ The attribute type is shown after the colon.
○ Attributes map onto member variables (data members) in code.
● Class Operations (Methods)
○ Operations are shown in the third partition. They are services the class provides.
○ The return type of a method is shown after the colon at the end of the method signature.
○ The return type of method parameters is shown after the colon following the parameter name.
○ Operations map onto class methods in code
28.
SOFTWARE ENGINEERING
SOFTWARE ENGINEERING
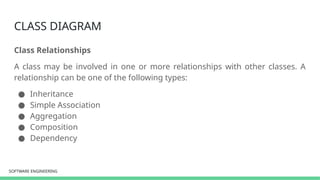
CLASSDIAGRAM
Class Relationships
A class may be involved in one or more relationships with other classes. A
relationship can be one of the following types:
● Inheritance
● Simple Association
● Aggregation
● Composition
● Dependency
29.
SOFTWARE ENGINEERING
SOFTWARE ENGINEERING
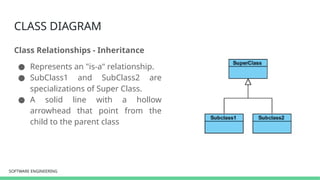
CLASSDIAGRAM
Class Relationships - Inheritance
● Represents an "is-a" relationship.
● SubClass1 and SubClass2 are
specializations of Super Class.
● A solid line with a hollow
arrowhead that point from the
child to the parent class
30.
SOFTWARE ENGINEERING
SOFTWARE ENGINEERING
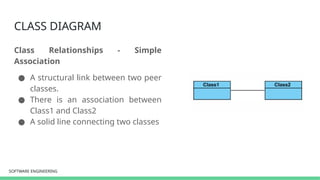
CLASSDIAGRAM
Class Relationships - Simple
Association
● A structural link between two peer
classes.
● There is an association between
Class1 and Class2
● A solid line connecting two classes
31.
SOFTWARE ENGINEERING
SOFTWARE ENGINEERING
CLASSDIAGRAM
Class Relationships - Aggregation
A special type of association. It
represents a "part of" relationship.
● Class2 is part of Class1.
● Many instances (denoted by the *) of
Class2 can be associated with Class1.
● A solid line with an unfilled diamond
at the association end connected to
the class of composite
32.
SOFTWARE ENGINEERING
SOFTWARE ENGINEERING
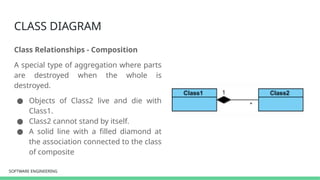
CLASSDIAGRAM
Class Relationships - Composition
A special type of aggregation where parts
are destroyed when the whole is
destroyed.
● Objects of Class2 live and die with
Class1.
● Class2 cannot stand by itself.
● A solid line with a filled diamond at
the association connected to the class
of composite
33.
SOFTWARE ENGINEERING
SOFTWARE ENGINEERING
CLASSDIAGRAM
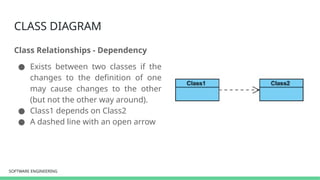
Class Relationships - Dependency
● Exists between two classes if the
changes to the definition of one
may cause changes to the other
(but not the other way around).
● Class1 depends on Class2
● A dashed line with an open arrow
SOFTWARE ENGINEERING
SOFTWARE ENGINEERING
BEHAVIORALMODELS
Behavioral models are models of the dynamic behavior of a system as it is
executing. They show what happens or what is supposed to happen when a
system responds to a stimulus from its environment. These stimuli may be
either data or events:
● Data becomes available that has to be processed by the system. The
availability of the data triggers the processing.
● An event happens that triggers system processing. Events may have
associated data, although this is not always the case.
37.
SOFTWARE ENGINEERING
SOFTWARE ENGINEERING
DATA-DRIVENMODELING
Data-driven models show the sequence of actions involved in processing
input data and generating an associated output.
Data-driven models were among the first graphical software models. In the
1970s, structured design methods used data-flow diagrams (DFDs) as a way
to illustrate the processing steps in a system.
38.
SOFTWARE ENGINEERING
SOFTWARE ENGINEERING
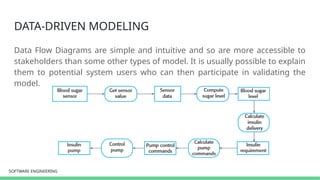
DATA-DRIVENMODELING
Data Flow Diagrams are simple and intuitive and so are more accessible to
stakeholders than some other types of model. It is usually possible to explain
them to potential system users who can then participate in validating the
model.
39.
SOFTWARE ENGINEERING
SOFTWARE ENGINEERING
DATA-DRIVENMODELING
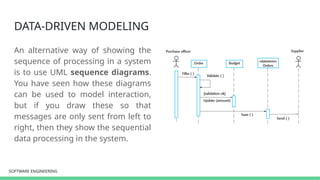
An alternative way of showing the
sequence of processing in a system
is to use UML sequence diagrams.
You have seen how these diagrams
can be used to model interaction,
but if you draw these so that
messages are only sent from left to
right, then they show the sequential
data processing in the system.
40.
SOFTWARE ENGINEERING
SOFTWARE ENGINEERING
EVENT-DRIVENMODELING
Event-driven modeling shows how a system responds to external and internal
events. It is based on the assumption that a system has a finite number of
states and that events (stimuli) may cause a transition from one state to
another.
For example, a system controlling a valve may move from a state “Valve
open” to a state “Valve closed” when an operator command (the stimulus) is
received.
41.
SOFTWARE ENGINEERING
SOFTWARE ENGINEERING
EVENT-DRIVENMODELING
This view of a system is particularly appropriate for real-time systems. Event-
driven modeling is used extensively when designing and documenting real-
time systems.
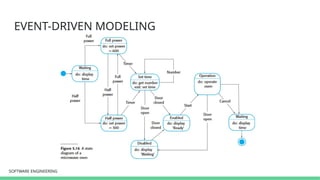
The UML supports event-based modeling using state diagrams, which are
based on Statecharts (Harel 1987). State diagrams show system states and
events that cause transitions from one state to another. They do not show the
flow of data within the system but may include additional information on the
computations carried out in each state.
42.
SOFTWARE ENGINEERING
SOFTWARE ENGINEERING
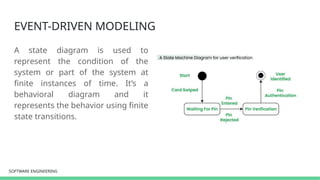
EVENT-DRIVENMODELING
A state diagram is used to
represent the condition of the
system or part of the system at
finite instances of time. It’s a
behavioral diagram and it
represents the behavior using finite
state transitions.