Download to read offline

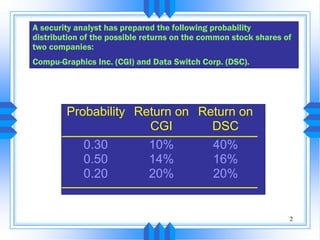
![Standard Deviation and Variance
Measures the extent of deviation of returns
from the average value of return
The square of standard deviation is called
variance
Computation of Standard deviation and
Variance can be Historical[ Ex-post] or
Expected –[Ex-ante]](https://image.slidesharecdn.com/fm-unit-2-part-11-180105163930/85/Fm-unit-2-part-1-1-12-320.jpg)


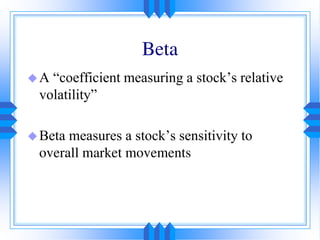
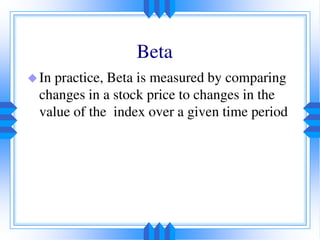
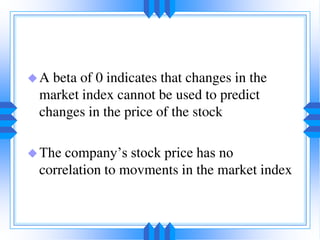
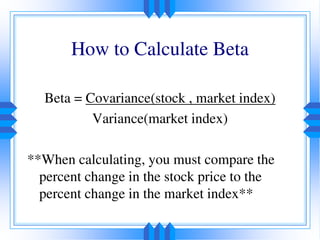
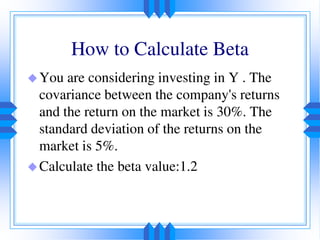


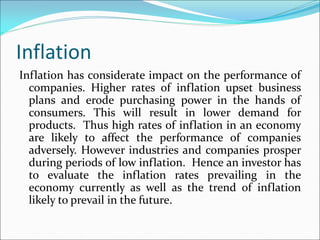


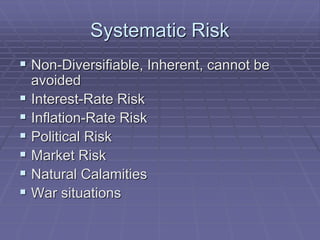
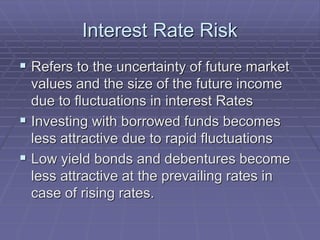
This document discusses various types of risk that impact investments, including systematic risk and unsystematic risk. Systematic risk, also called market risk, cannot be avoided and includes interest rate risk, inflation risk, political risk, and natural disasters. Unsystematic risk is specific to a company or industry and is diversifiable. The document also provides examples of how inflation and interest rate changes can impact bond returns. It defines beta as a measure of a stock's volatility compared to the overall market and discusses how beta is used to assess risk. Finally, it summarizes the steps of fundamental analysis, including economic, industry, and company analysis.


