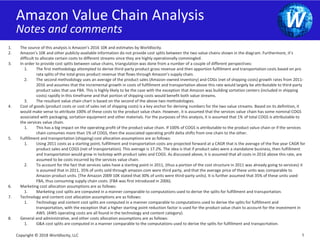
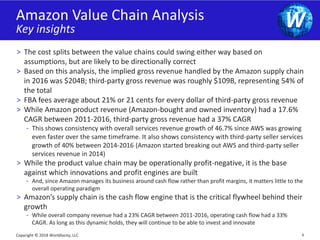
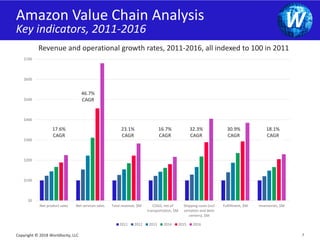
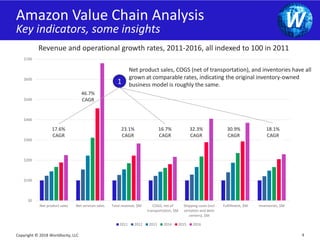
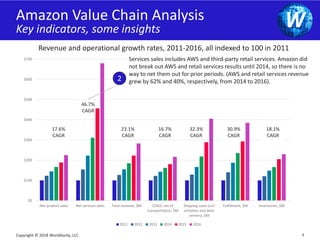
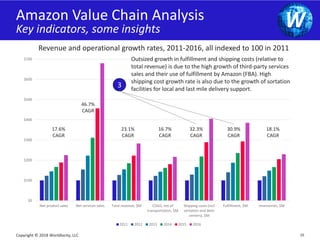
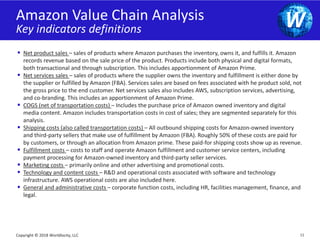
SlideShare a Scribd company logo
1 of 14
Download to read offline
worldlocityThink beyond. Execute smarter.
Amazon Value Chain
Analysis
A quick analysis based on publicly-
available information
Kelly Thomas, CEO, Worldlocity
12 February, 2018
2
WSafe Harbor Statement
Copyright © 2018 Worldlocity, LLC
Analysis information provided in this document is based only on publicly-
available information, judgments, and associated assumptions. Individual
assumptions may or may not be accurate. Assumptions that are inaccurate
could lead to incorrect analysis conclusions. The information is provided to
further discussion and should not be used for decision-making, without further
validation.
3
WAmazon Value Chain Analysis
Commentary
Copyright © 2018 Worldlocity, LLC
The following commentary also appears on www.worldlocity.com
Amazon is the juggernaut retail corporation of our day and there is much interest in how they do things. Just about every retailer in the world has had to come to grips
with how to address Amazon's onslaught. Walmart, the world's largest retailer, is bound and determined to not have Amazon do to them what Walmart did to Sears,
Kmart, and others. Retailers lament that Amazon runs a high-growth, zero-profit business model, and is rewarded for doing so by the investment community, while these
same retailers are held to a different set of rules by the same investment community. Amazon's answer to this is that they just focus on customers, providing ever more
innovative ways to serve customers; everything else just flows from that focus. The investment community says that Amazon could turn into an incredible profit engine
at any time. But is this true, and if so, how will they do it?
Using only information available in Amazon's 10K reports, and making some basic assumptions and calculations, Worldlocity has assembled a profile of Amazon's
business, in the form of a value chain chart, which is shown on the following slide. For this analysis, we separated Amazon's business into two segments: 1) their retail
products business; and 2) their services business. Their retail products business includes all physical product sales for which they own the inventory, along with various
digital products sales, which are downloadable. Their services business includes retail third-party product sales for which they get commissions and fees, and also
includes subscription services, Amazon Web Services (AWS), and certain advertising and co-branding products.
One caveat: this analysis relies on assumptions and cost allocations, for which there is no publicly available information. Having said that, while the numbers lack
precision, they are most likely directionally correct. This analysis shows that Amazon, on an operating basis, loses about 2 cents for every dollar of products it sells using
its traditional selling model in which it owns the product inventory, while it makes roughly 15 cents for every dollar it sells through its services business (which includes
AWS, which has operating margins of 25%). The net result of the two is that Amazon overall makes about 3 cents in operating profit for every 1 dollar it sells overall. (If
readers of this analysis disagree or have better data to improve it, please contact Worldlocity). Thus, it's the business innovations that resulted from the original business
model that are the profit engines now, and possibly into the future. It's difficult to see how the original business model, given its cost structure, can make money
comparable to that of a traditional retailer (without some combination of price increases, cost reductions, and service reductions).
This of course poses significant challenges for traditional retailers, who do not have a marketplace operation or an AWS to subsidize their product-based ecommerce.
Thus, they will have to subsidize it out of their brick-and-mortar operations, diluting the margins there. Walmart is rapidly trying to ramp up its third-party marketplace
operation, not just to match the choice of Amazon, but presumably to also provide fatter margins.
Finally, Amazon's supply chain is a cash-generation machine, with a 2016 cash-to-cash cycle of approximately minus 35; this equates to about $13B in cash on a 2016
end-of-year revenue basis (a more precise calculation would time-phase it over the year of 2016). This money float, courtesy of its supply chain, is one of the critical
flywheels of the Amazon success story. In a sense, it is not unlike the float on insurance premiums that Warren Buffet has historically used as an investment vehicle. It's a
powerful statement for supply chain management.
The net-net is that Amazon manages its business around cash flow, rather than bottom-line profit and profit margins. Its cash flow from operations in 2016 was $16.4B,
and its free cash flow was $9.7B.
4
WAmazon Value Chain Analysis
Amazon and third-party products (2016)
Copyright © 2018 Worldlocity, LLC
Product Supply
(Amazon
Suppliers, COGS)
Amazon sold and managed products (inventory owned by Amazon)
Source: Amazon 2016 10K; Worldlocity analysis
$71.4B
Fulfillment by
Amazon and Paid
Third-Parties
$8.5B
$71,377 $8,506
$71,377
$7,738 $3,146 $4,217 $1,567
75.4% 9.0% 8.2% 3.3% 4.5% 1.7%
$79,883 $87,622 $90,767 $94,985 $96,552
Transportation Marketing Technology and
Content
General &
Administrative
and other
Operating
Margin
$7.7B $3.1B $4.2B $1.6B -$1.9B
-$1,887
-2.0%
$94,665
$136B
Revenue
Third-party sellers, FBA, AWS, and other services
Product Supply
(Third-Party
Suppliers, COGS)
$0.7B
Fulfillment by
Amazon and Paid
Third-Parties
$9.1B
$721 $9,113
$721
$8,429 $4,087 $11,868 $1,032
1.7% 22.1% 20.4% 9.9% 28.7% 2.5%
$9,834 $18,262 $22,350 $34,217 $35,249
Transportation Marketing Technology and
Content
General &
Administrative
and other
Operating
Margin
$8.4B $4.1B $11.9B $1.0B $6.1B
$6,073
14.7%
$41,322
$4.2B Op
Margin
1
2
Notes: numbers in boxes are in $M; FBA=fulfillment by Amazon.
5
WAmazon Value Chain Analysis
Notes and comments
Copyright © 2018 Worldlocity, LLC
1. The source of this analysis is Amazon’s 2016 10K and estimates by Worldlocity.
2. Amazon’s 10K and other publicly-available information do not provide cost splits between the two value chains shown in the diagram. Furthermore, it’s
difficult to allocate certain costs to different streams since they are highly operationally commingled.
3. In order to provide cost splits between value chains, triangulation was done from a number of a couple of different perspectives:
1. The first methodology attempted to derive third-party product gross revenue and then apportion fulfillment and transportation costs based on pro
rata splits of the total gross product revenue that flows through Amazon’s supply chain.
2. The second methodology uses an average of the product sales (Amazon-owned inventory) and COGs (net of shipping costs) growth rates from 2011-
2016 and assumes that the incremental growth in costs of fulfillment and transportation above this rate would largely be attributable to third-party
product sales that use FBA. This is highly likely to be the case with the exception that Amazon was building sortation centers (included in shipping
costs) rapidly in this timeframe and that portion of shipping costs would benefit both value streams.
3. The resultant value chain chart is based on the second of the above two methodologies.
4. Cost of goods (product costs or cost of sales net of shipping costs) is a key anchor for deriving numbers for the two value streams. Based on its definition, it
would make sense to attribute 100% of these costs to the product value chain. However, it is assumed that the services value chain has some nominal COGS
associated with packaging, sortation equipment and other materials. For the purposes of this analysis, it is assumed that 1% of total COGS is attributable to
the services value chain.
1. This has a big impact on the operating profit of the product value chain. If 100% of COGS is attributable to the product value chain or if the services
chain consumes more than 1% of COGS, then the associated operating profit delta shifts from one chain to the other.
5. Fulfillment and transportation (shipping) cost allocation assumptions are as follows:
1. Using 2011 costs as a starting point, fulfillment and transportation costs are projected forward at a CAGR that is the average of the five year CAGR for
product sales and COGS (net of transportation). This average is 17.2%. The idea is that if product sales were a standalone business, then fulfillment
and transportation would grow in lockstep with product sales and COGS. As discussed above, it is assumed that all costs in 2016 above this rate, are
assumed to be costs incurred by the services value chain.
2. To account for the fact that services sales have a starting point in 2011, (thus a portion of the cost structure in 2011 was already going to services) it
is assumed that in 2011, 35% of units sold through amazon.com were third party, and that the average price of these units was comparable to
Amazon product units. (The Amazon 2009 10K stated that 30% of units were third-party units). It is further assumed that 35% of these units used
FBA, thus consuming supply chain costs. (FBA was first introduced in 2006).
6. Marketing cost allocation assumptions are as follows:
1. Marketing cost splits are computed in a manner comparable to computations used to derive the splits for fulfillment and transportation.
7. Technology and content cost allocation assumptions are as follows:
1. Technology and content cost splits are computed in a manner comparable to computations used to derive the splits for fulfillment and
transportation, with the exception that a higher starting point reduction factor is used for the product value chain to account for the investment in
AWS. (AWS operating costs are all found in the technology and content category).
8. General and administrative, and other costs allocation assumptions are as follows:
1. G&A cost splits are computed in a manner comparable to the computations used to derive the splits for fulfillment and transportation.
6
WAmazon Value Chain Analysis
Key insights
> The cost splits between the value chains could swing either way based on
assumptions, but are likely to be directionally correct
> Based on this analysis, the implied gross revenue handled by the Amazon supply chain
in 2016 was $204B; third-party gross revenue was roughly $109B, representing 54% of
the total
> FBA fees average about 21% or 21 cents for every dollar of third-party gross revenue
> While Amazon product revenue (Amazon-bought and owned inventory) had a 17.6%
CAGR between 2011-2016, third-party gross revenue had a 37% CAGR
- This shows consistency with overall services revenue growth of 46.7% since AWS was growing
even faster over the same timeframe. It also shows consistency with third-party seller services
growth of 40% between 2014-2016 (Amazon started breaking out AWS and third-party seller
services revenue in 2014)
> While the product value chain may be operationally profit-negative, it is the base
against which innovations and profit engines are built
- And, since Amazon manages its business around cash flow rather than profit margins, it matters little to the
overall operating paradigm
> Amazon’s supply chain is the cash flow engine that is the critical flywheel behind their
growth
- While overall company revenue had a 23% CAGR between 2011-2016, operating cash flow had a 33%
CAGR. As long as this dynamic holds, they will continue to be able to invest and innovate
Copyright © 2018 Worldlocity, LLC
7
WAmazon Value Chain Analysis
Key indicators, 2011-2016
Copyright © 2018 Worldlocity, LLC
Revenue and operational growth rates, 2011-2016, all indexed to 100 in 2011
$0
$100
$200
$300
$400
$500
$600
$700
Net product sales Net services sales Total revenue, $M COGS, net of
transportation, $M
Shipping costs (incl
sortation and deliv
centers), $M
Fulfillment, $M Inventories, $M
2011 2012 2013 2014 2015 2016
17.6%
CAGR
46.7%
CAGR
23.1%
CAGR
16.7%
CAGR
32.3%
CAGR
30.9%
CAGR
18.1%
CAGR
8
WAmazon Value Chain Analysis
Key indicators, some insights
Copyright © 2018 Worldlocity, LLC
Revenue and operational growth rates, 2011-2016, all indexed to 100 in 2011
$0
$100
$200
$300
$400
$500
$600
$700
Net product sales Net services sales Total revenue, $M COGS, net of
transportation, $M
Shipping costs (incl
sortation and deliv
centers), $M
Fulfillment, $M Inventories, $M
2011 2012 2013 2014 2015 2016
17.6%
CAGR
46.7%
CAGR
23.1%
CAGR
16.7%
CAGR
32.3%
CAGR
30.9%
CAGR
18.1%
CAGR
Net product sales, COGS (net of transportation), and inventories have all
grown at comparable rates, indicating the original inventory-owned
business model is roughly the same.1
9
WAmazon Value Chain Analysis
Key indicators, some insights
Copyright © 2018 Worldlocity, LLC
Revenue and operational growth rates, 2011-2016, all indexed to 100 in 2011
$0
$100
$200
$300
$400
$500
$600
$700
Net product sales Net services sales Total revenue, $M COGS, net of
transportation, $M
Shipping costs (incl
sortation and deliv
centers), $M
Fulfillment, $M Inventories, $M
2011 2012 2013 2014 2015 2016
17.6%
CAGR
46.7%
CAGR
23.1%
CAGR
16.7%
CAGR
32.3%
CAGR
30.9%
CAGR
18.1%
CAGR
Services sales includes AWS and third-party retail services. Amazon did
not break out AWS and retail services results until 2014, so there is no
way to net them out for prior periods. (AWS and retail services revenue
grew by 62% and 40%, respectively, from 2014 to 2016).2
10
WAmazon Value Chain Analysis
Key indicators, some insights
Copyright © 2018 Worldlocity, LLC
Revenue and operational growth rates, 2011-2016, all indexed to 100 in 2011
$0
$100
$200
$300
$400
$500
$600
$700
Net product sales Net services sales Total revenue, $M COGS, net of
transportation, $M
Shipping costs (incl
sortation and deliv
centers), $M
Fulfillment, $M Inventories, $M
2011 2012 2013 2014 2015 2016
17.6%
CAGR
46.7%
CAGR
23.1%
CAGR
16.7%
CAGR
32.3%
CAGR
30.9%
CAGR
18.1%
CAGR
Outsized growth in fulfillment and shipping costs (relative to
total revenue) is due to the high growth of third-party services
sales and their use of fulfillment by Amazon (FBA). High
shipping cost growth rate is also due to the growth of sortation
facilities for local and last mile delivery support.
3
11
WAmazon Value Chain Analysis
Key indicators definitions
Copyright © 2018 Worldlocity, LLC
▪ Net product sales – sales of products where Amazon purchases the inventory, owns it, and fulfills it. Amazon
records revenue based on the sale price of the product. Products include both physical and digital formats,
both transactional and through subscription. This includes apportionment of Amazon Prime.
▪ Net services sales – sales of products where the supplier owns the inventory and fulfillment is either done by
the supplier or fulfilled by Amazon (FBA). Services sales are based on fees associated with he product sold, not
the gross price to the end customer. Net services sales also includes AWS, subscription services, advertising,
and co-branding. This includes an apportionment of Amazon Prime.
▪ COGS (net of transportation costs) – Includes the purchase price of Amazon owned inventory and digital
media content. Amazon includes transportation costs in cost of sales; they are segmented separately for this
analysis.
▪ Shipping costs (also called transportation costs) – All outbound shipping costs for Amazon-owned inventory
and third-party sellers that make use of fulfillment by Amazon (FBA). Roughly 50% of these costs are paid for
by customers, or through an allocation from Amazon prime. These paid-for shipping costs show up as revenue.
▪ Fulfillment costs – costs to staff and operate Amazon fulfillment and customer service centers, including
payment processing for Amazon-owned inventory and third-party seller services.
▪ Marketing costs – primarily online and other advertising and promotional costs.
▪ Technology and content costs – R&D and operational costs associated with software and technology
infrastructure. AWS operational costs are also included here.
▪ General and administrative costs – corporate function costs, including HR, facilities management, finance, and
legal.
12
WAmazon Value Chain Analysis
Cash Conversion Cycle, 2011-2016
Copyright © 2018 Worldlocity, LLC
Remarkable consistency in the cash conversion cycle, year-in and year-out. This is the engine that keeps the
flywheel going and is a critical part of how Amazon operationally manages its business.
48.9 47.9 49.9 48.3
52.2
47.4
19.5
22.8 23.4 23.0 21.9 22.4
109.1 105.7
101.9
96.3
103.9 104.7
-40.7
-35.1
-28.7
-25.0
-29.8
-34.9
-50.0
-30.0
-10.0
10.0
30.0
50.0
70.0
90.0
110.0
2011 2012 2013 2014 2015 2016
Days in inventory Days in receivables Days in payables Cash-to-cash, days
13
WAmazon Value Chain
Fulfillment space growth
Copyright © 2018 Worldlocity, LLC
0
20,000
40,000
60,000
80,000
100,000
120,000
140,000
160,000
180,000
2011 2012 2013 2014 2015 2016
Office space square footage (1000s) Fulfillment and data center square footage (1000s)
Office, fulfillment and data center square footage (1000s)
▪ At the end of 2016, Amazon had 160M square feet of space for fulfillment and data centers (Amazon does not break out its data center
space separately; it is also assumed this number includes sortation space).
▪ Amazon leases 96% of its overall floor space, using a combination of operating and capital leases.
▪ Fulfillment and data center square footage had a 29.4% CAGR between 2011-2016. This is another triangulation point for deducing
product gross revenue flow through its supply chain.
▪ Analysis suggests that Amazon drives about $1,300/year in gross product revenue per square foot of fulfillment space.
▪ In a sign of accelerating third-party FBA sales, Amazon added, in 2016, nearly as much fulfillment space as their total space at the end of
2011, when they were a $48B company.
www.worldlocity.com
worldlocityThink beyond. Execute smarter.

More Related Content

What's hot

Supply Chain Management of Amazon
Supply Chain Management of AmazonSupply Chain Management of Amazon
Supply Chain Management of AmazonPriyankaJagwani1
 
Strategy Presentation on Amazon
Strategy Presentation on AmazonStrategy Presentation on Amazon
Strategy Presentation on AmazonGabbi Baker
 
Supply chain mngt of amazon
Supply chain mngt of amazonSupply chain mngt of amazon
Supply chain mngt of amazonAlitsia Dereza
 
Amazon's European Distribution Strategy Case Study
Amazon's European Distribution Strategy Case StudyAmazon's European Distribution Strategy Case Study
Amazon's European Distribution Strategy Case StudyYASSER ELSEDAWY
 
Wal mart case study supply chain management
Wal mart case study supply chain management Wal mart case study supply chain management
Wal mart case study supply chain management ANKIT GANGWAL
 
Amazon's Operational Strategy
Amazon's Operational StrategyAmazon's Operational Strategy
Amazon's Operational StrategyTalhaMTZ
 
Amazon strategic management
Amazon strategic managementAmazon strategic management
Amazon strategic managementrinuemma
 
Walmart scm
Walmart scmWalmart scm
Walmart scmartki
 
Walmart Supply Chain Management Practices
Walmart Supply Chain Management PracticesWalmart Supply Chain Management Practices
Walmart Supply Chain Management PracticesJatin Mendiratta
 
Supply chain management of walmart
Supply chain management of walmartSupply chain management of walmart
Supply chain management of walmartDharmik Bhatt
 
Amazon Case Study 2021
Amazon Case Study 2021Amazon Case Study 2021
Amazon Case Study 2021DevAdnani
 
Case study on amazon
Case study on amazonCase study on amazon
Case study on amazonAnnamalai Ram
 
A glympse on the supply chain system of amazon
A glympse on the supply chain system of amazonA glympse on the supply chain system of amazon
A glympse on the supply chain system of amazonAshik S Nair
 
Case amazon
Case amazonCase amazon
Case amazonTHAO BUI
 

What's hot (20)

E-Logisitics PPT
E-Logisitics PPTE-Logisitics PPT
E-Logisitics PPT
 
Supply Chain Management of Amazon
Supply Chain Management of AmazonSupply Chain Management of Amazon
Supply Chain Management of Amazon
 
Strategy Presentation on Amazon
Strategy Presentation on AmazonStrategy Presentation on Amazon
Strategy Presentation on Amazon
 
Project on amazon
Project on amazonProject on amazon
Project on amazon
 
Supply chain mngt of amazon
Supply chain mngt of amazonSupply chain mngt of amazon
Supply chain mngt of amazon
 
Amazon's European Distribution Strategy Case Study
Amazon's European Distribution Strategy Case StudyAmazon's European Distribution Strategy Case Study
Amazon's European Distribution Strategy Case Study
 
Wal mart case study supply chain management
Wal mart case study supply chain management Wal mart case study supply chain management
Wal mart case study supply chain management
 
Amazon's Operational Strategy
Amazon's Operational StrategyAmazon's Operational Strategy
Amazon's Operational Strategy
 
Amazon strategic management
Amazon strategic managementAmazon strategic management
Amazon strategic management
 
Amazon case study
Amazon case studyAmazon case study
Amazon case study
 
Walmart scm
Walmart scmWalmart scm
Walmart scm
 
Amazon
Amazon Amazon
Amazon
 
Walmart Supply Chain Management Practices
Walmart Supply Chain Management PracticesWalmart Supply Chain Management Practices
Walmart Supply Chain Management Practices
 
Supply chain management of walmart
Supply chain management of walmartSupply chain management of walmart
Supply chain management of walmart
 
Amazon Case Study 2021
Amazon Case Study 2021Amazon Case Study 2021
Amazon Case Study 2021
 
Case study on amazon
Case study on amazonCase study on amazon
Case study on amazon
 
Operation Management for Walmart
Operation Management for WalmartOperation Management for Walmart
Operation Management for Walmart
 
A glympse on the supply chain system of amazon
A glympse on the supply chain system of amazonA glympse on the supply chain system of amazon
A glympse on the supply chain system of amazon
 
Supply Chain Management of ZARA
Supply Chain Management of ZARASupply Chain Management of ZARA
Supply Chain Management of ZARA
 
Case amazon
Case amazonCase amazon
Case amazon
 

Similar to Amazon Supply Chain Analysis

Amazon Post Q1 2020 Results
Amazon Post Q1 2020 ResultsAmazon Post Q1 2020 Results
Amazon Post Q1 2020 Resultsthomas paulson
 
Amazon A Corporate Strategic Analysis
Amazon  A Corporate Strategic AnalysisAmazon  A Corporate Strategic Analysis
Amazon A Corporate Strategic AnalysisEmma Burke
 
Amazon go feasibility study
Amazon go feasibility studyAmazon go feasibility study
Amazon go feasibility studyAmmine Ait
 
Amzn q2 20 learnings and the outlook for its business, retail, and our economy
Amzn q2 20 learnings and the outlook for its business, retail, and our economyAmzn q2 20 learnings and the outlook for its business, retail, and our economy
Amzn q2 20 learnings and the outlook for its business, retail, and our economythomas paulson
 
A-Z: The Emergence of Amazon as a Global 3PL
A-Z: The Emergence of Amazon as a Global 3PLA-Z: The Emergence of Amazon as a Global 3PL
A-Z: The Emergence of Amazon as a Global 3PLAdelante SCM
 
The Epic Struggle between Amazon and Walmart
The Epic Struggle between Amazon and WalmartThe Epic Struggle between Amazon and Walmart
The Epic Struggle between Amazon and WalmartAimee Peterson
 
Amazon Financial PerformanceIntroduction Amazon is o.docx
Amazon Financial PerformanceIntroduction Amazon is o.docxAmazon Financial PerformanceIntroduction Amazon is o.docx
Amazon Financial PerformanceIntroduction Amazon is o.docxnettletondevon
 
Amazon go feasibility study
Amazon go feasibility studyAmazon go feasibility study
Amazon go feasibility studyAmmine Ait
 
Amazon inc. logistics expansion
Amazon inc.   logistics expansionAmazon inc.   logistics expansion
Amazon inc. logistics expansionSharat Prakash
 
Amazon strategic and financial planning
Amazon strategic and financial planningAmazon strategic and financial planning
Amazon strategic and financial planningSujal Padhiyar
 
1Managerial Report for Case Problem Amazon.com lnc.”Execu.docx
1Managerial Report for Case Problem Amazon.com lnc.”Execu.docx1Managerial Report for Case Problem Amazon.com lnc.”Execu.docx
1Managerial Report for Case Problem Amazon.com lnc.”Execu.docxdrennanmicah
 
1Amazon Corporate Social ResponsibilityJeannette Sta
1Amazon Corporate Social ResponsibilityJeannette Sta1Amazon Corporate Social ResponsibilityJeannette Sta
1Amazon Corporate Social ResponsibilityJeannette StaTatianaMajor22
 
SSCM_Marc_Sala_Integration of Kiva Robots in Amazon - copia
SSCM_Marc_Sala_Integration of Kiva Robots in Amazon - copiaSSCM_Marc_Sala_Integration of Kiva Robots in Amazon - copia
SSCM_Marc_Sala_Integration of Kiva Robots in Amazon - copiaMarc Sala Casals
 
Final Business Model and Strategic Plan Paper_Graded 9
Final Business Model and Strategic Plan Paper_Graded 9Final Business Model and Strategic Plan Paper_Graded 9
Final Business Model and Strategic Plan Paper_Graded 9Michelle Broadbelt
 
Grading Scale RubricRunning head PROJECT MANAGEMENT PLA.docx
Grading Scale RubricRunning head PROJECT MANAGEMENT PLA.docxGrading Scale RubricRunning head PROJECT MANAGEMENT PLA.docx
Grading Scale RubricRunning head PROJECT MANAGEMENT PLA.docxwhittemorelucilla
 
Is there-hope-for-amazon-paper1993
Is there-hope-for-amazon-paper1993Is there-hope-for-amazon-paper1993
Is there-hope-for-amazon-paper1993MANAMI TALUKDER
 

Similar to Amazon Supply Chain Analysis (20)

Amazon Post Q1 2020 Results
Amazon Post Q1 2020 ResultsAmazon Post Q1 2020 Results
Amazon Post Q1 2020 Results
 
Amazonlogistics.pdf
Amazonlogistics.pdfAmazonlogistics.pdf
Amazonlogistics.pdf
 
Amazon A Corporate Strategic Analysis
Amazon  A Corporate Strategic AnalysisAmazon  A Corporate Strategic Analysis
Amazon A Corporate Strategic Analysis
 
amazon.pptx
amazon.pptxamazon.pptx
amazon.pptx
 
Amazon go feasibility study
Amazon go feasibility studyAmazon go feasibility study
Amazon go feasibility study
 
Amzn q2 20 learnings and the outlook for its business, retail, and our economy
Amzn q2 20 learnings and the outlook for its business, retail, and our economyAmzn q2 20 learnings and the outlook for its business, retail, and our economy
Amzn q2 20 learnings and the outlook for its business, retail, and our economy
 
A-Z: The Emergence of Amazon as a Global 3PL
A-Z: The Emergence of Amazon as a Global 3PLA-Z: The Emergence of Amazon as a Global 3PL
A-Z: The Emergence of Amazon as a Global 3PL
 
The Epic Struggle between Amazon and Walmart
The Epic Struggle between Amazon and WalmartThe Epic Struggle between Amazon and Walmart
The Epic Struggle between Amazon and Walmart
 
Amazon Financial PerformanceIntroduction Amazon is o.docx
Amazon Financial PerformanceIntroduction Amazon is o.docxAmazon Financial PerformanceIntroduction Amazon is o.docx
Amazon Financial PerformanceIntroduction Amazon is o.docx
 
Amazon go feasibility study
Amazon go feasibility studyAmazon go feasibility study
Amazon go feasibility study
 
Amazon inc. logistics expansion
Amazon inc.   logistics expansionAmazon inc.   logistics expansion
Amazon inc. logistics expansion
 
Amazon strategic and financial planning
Amazon strategic and financial planningAmazon strategic and financial planning
Amazon strategic and financial planning
 
1Managerial Report for Case Problem Amazon.com lnc.”Execu.docx
1Managerial Report for Case Problem Amazon.com lnc.”Execu.docx1Managerial Report for Case Problem Amazon.com lnc.”Execu.docx
1Managerial Report for Case Problem Amazon.com lnc.”Execu.docx
 
1Amazon Corporate Social ResponsibilityJeannette Sta
1Amazon Corporate Social ResponsibilityJeannette Sta1Amazon Corporate Social ResponsibilityJeannette Sta
1Amazon Corporate Social ResponsibilityJeannette Sta
 
SSCM_Marc_Sala_Integration of Kiva Robots in Amazon - copia
SSCM_Marc_Sala_Integration of Kiva Robots in Amazon - copiaSSCM_Marc_Sala_Integration of Kiva Robots in Amazon - copia
SSCM_Marc_Sala_Integration of Kiva Robots in Amazon - copia
 
Amazon Vs Alibaba.pdf
Amazon Vs Alibaba.pdfAmazon Vs Alibaba.pdf
Amazon Vs Alibaba.pdf
 
Case Study 1
Case Study 1Case Study 1
Case Study 1
 
Final Business Model and Strategic Plan Paper_Graded 9
Final Business Model and Strategic Plan Paper_Graded 9Final Business Model and Strategic Plan Paper_Graded 9
Final Business Model and Strategic Plan Paper_Graded 9
 
Grading Scale RubricRunning head PROJECT MANAGEMENT PLA.docx
Grading Scale RubricRunning head PROJECT MANAGEMENT PLA.docxGrading Scale RubricRunning head PROJECT MANAGEMENT PLA.docx
Grading Scale RubricRunning head PROJECT MANAGEMENT PLA.docx
 
Is there-hope-for-amazon-paper1993
Is there-hope-for-amazon-paper1993Is there-hope-for-amazon-paper1993
Is there-hope-for-amazon-paper1993
 

Recently uploaded

8447779800, Low rate Call girls in Shivaji Enclave Delhi NCR
8447779800, Low rate Call girls in Shivaji Enclave Delhi NCR8447779800, Low rate Call girls in Shivaji Enclave Delhi NCR
8447779800, Low rate Call girls in Shivaji Enclave Delhi NCRashishs7044
 
MAHA Global and IPR: Do Actions Speak Louder Than Words?
MAHA Global and IPR: Do Actions Speak Louder Than Words?MAHA Global and IPR: Do Actions Speak Louder Than Words?
MAHA Global and IPR: Do Actions Speak Louder Than Words?Olivia Kresic
 
Youth Involvement in an Innovative Coconut Value Chain by Mwalimu Menza
Youth Involvement in an Innovative Coconut Value Chain by Mwalimu MenzaYouth Involvement in an Innovative Coconut Value Chain by Mwalimu Menza
Youth Involvement in an Innovative Coconut Value Chain by Mwalimu Menzaictsugar
 
(Best) ENJOY Call Girls in Faridabad Ex | 8377087607
(Best) ENJOY Call Girls in Faridabad Ex | 8377087607(Best) ENJOY Call Girls in Faridabad Ex | 8377087607
(Best) ENJOY Call Girls in Faridabad Ex | 8377087607dollysharma2066
 
Marketplace and Quality Assurance Presentation - Vincent Chirchir
Marketplace and Quality Assurance Presentation - Vincent ChirchirMarketplace and Quality Assurance Presentation - Vincent Chirchir
Marketplace and Quality Assurance Presentation - Vincent Chirchirictsugar
 
Kenya’s Coconut Value Chain by Gatsby Africa
Kenya’s Coconut Value Chain by Gatsby AfricaKenya’s Coconut Value Chain by Gatsby Africa
Kenya’s Coconut Value Chain by Gatsby Africaictsugar
 
Case study on tata clothing brand zudio in detail
Case study on tata clothing brand zudio in detailCase study on tata clothing brand zudio in detail
Case study on tata clothing brand zudio in detailAriel592675
 
2024 Numerator Consumer Study of Cannabis Usage
2024 Numerator Consumer Study of Cannabis Usage2024 Numerator Consumer Study of Cannabis Usage
2024 Numerator Consumer Study of Cannabis UsageNeil Kimberley
 
Global Scenario On Sustainable and Resilient Coconut Industry by Dr. Jelfina...
Global Scenario On Sustainable  and Resilient Coconut Industry by Dr. Jelfina...Global Scenario On Sustainable  and Resilient Coconut Industry by Dr. Jelfina...
Global Scenario On Sustainable and Resilient Coconut Industry by Dr. Jelfina...ictsugar
 
NewBase 19 April 2024 Energy News issue - 1717 by Khaled Al Awadi.pdf
NewBase  19 April  2024  Energy News issue - 1717 by Khaled Al Awadi.pdfNewBase  19 April  2024  Energy News issue - 1717 by Khaled Al Awadi.pdf
NewBase 19 April 2024 Energy News issue - 1717 by Khaled Al Awadi.pdfKhaled Al Awadi
 
BEST Call Girls In Old Faridabad ✨ 9773824855 ✨ Escorts Service In Delhi Ncr,
BEST Call Girls In Old Faridabad ✨ 9773824855 ✨ Escorts Service In Delhi Ncr,BEST Call Girls In Old Faridabad ✨ 9773824855 ✨ Escorts Service In Delhi Ncr,
BEST Call Girls In Old Faridabad ✨ 9773824855 ✨ Escorts Service In Delhi Ncr,noida100girls
 
Call Us 📲8800102216📞 Call Girls In DLF City Gurgaon
Call Us 📲8800102216📞 Call Girls In DLF City GurgaonCall Us 📲8800102216📞 Call Girls In DLF City Gurgaon
Call Us 📲8800102216📞 Call Girls In DLF City Gurgaoncallgirls2057
 
Pitch Deck Teardown: Geodesic.Life's $500k Pre-seed deck
Pitch Deck Teardown: Geodesic.Life's $500k Pre-seed deckPitch Deck Teardown: Geodesic.Life's $500k Pre-seed deck
Pitch Deck Teardown: Geodesic.Life's $500k Pre-seed deckHajeJanKamps
 
Call Girls In Sikandarpur Gurgaon ❤️8860477959_Russian 100% Genuine Escorts I...
Call Girls In Sikandarpur Gurgaon ❤️8860477959_Russian 100% Genuine Escorts I...Call Girls In Sikandarpur Gurgaon ❤️8860477959_Russian 100% Genuine Escorts I...
Call Girls In Sikandarpur Gurgaon ❤️8860477959_Russian 100% Genuine Escorts I...lizamodels9
 
Market Sizes Sample Report - 2024 Edition
Market Sizes Sample Report - 2024 EditionMarket Sizes Sample Report - 2024 Edition
Market Sizes Sample Report - 2024 EditionMintel Group
 
Lowrate Call Girls In Sector 18 Noida ❤️8860477959 Escorts 100% Genuine Servi...
Lowrate Call Girls In Sector 18 Noida ❤️8860477959 Escorts 100% Genuine Servi...Lowrate Call Girls In Sector 18 Noida ❤️8860477959 Escorts 100% Genuine Servi...
Lowrate Call Girls In Sector 18 Noida ❤️8860477959 Escorts 100% Genuine Servi...lizamodels9
 
8447779800, Low rate Call girls in Tughlakabad Delhi NCR
8447779800, Low rate Call girls in Tughlakabad Delhi NCR8447779800, Low rate Call girls in Tughlakabad Delhi NCR
8447779800, Low rate Call girls in Tughlakabad Delhi NCRashishs7044
 
Keppel Ltd. 1Q 2024 Business Update Presentation Slides
Keppel Ltd. 1Q 2024 Business Update  Presentation SlidesKeppel Ltd. 1Q 2024 Business Update  Presentation Slides
Keppel Ltd. 1Q 2024 Business Update Presentation SlidesKeppelCorporation
 
Islamabad Escorts | Call 03274100048 | Escort Service in Islamabad
Islamabad Escorts | Call 03274100048 | Escort Service in IslamabadIslamabad Escorts | Call 03274100048 | Escort Service in Islamabad
Islamabad Escorts | Call 03274100048 | Escort Service in IslamabadAyesha Khan
 

Recently uploaded (20)

8447779800, Low rate Call girls in Shivaji Enclave Delhi NCR
8447779800, Low rate Call girls in Shivaji Enclave Delhi NCR8447779800, Low rate Call girls in Shivaji Enclave Delhi NCR
8447779800, Low rate Call girls in Shivaji Enclave Delhi NCR
 
MAHA Global and IPR: Do Actions Speak Louder Than Words?
MAHA Global and IPR: Do Actions Speak Louder Than Words?MAHA Global and IPR: Do Actions Speak Louder Than Words?
MAHA Global and IPR: Do Actions Speak Louder Than Words?
 
Youth Involvement in an Innovative Coconut Value Chain by Mwalimu Menza
Youth Involvement in an Innovative Coconut Value Chain by Mwalimu MenzaYouth Involvement in an Innovative Coconut Value Chain by Mwalimu Menza
Youth Involvement in an Innovative Coconut Value Chain by Mwalimu Menza
 
(Best) ENJOY Call Girls in Faridabad Ex | 8377087607
(Best) ENJOY Call Girls in Faridabad Ex | 8377087607(Best) ENJOY Call Girls in Faridabad Ex | 8377087607
(Best) ENJOY Call Girls in Faridabad Ex | 8377087607
 
Marketplace and Quality Assurance Presentation - Vincent Chirchir
Marketplace and Quality Assurance Presentation - Vincent ChirchirMarketplace and Quality Assurance Presentation - Vincent Chirchir
Marketplace and Quality Assurance Presentation - Vincent Chirchir
 
Kenya’s Coconut Value Chain by Gatsby Africa
Kenya’s Coconut Value Chain by Gatsby AfricaKenya’s Coconut Value Chain by Gatsby Africa
Kenya’s Coconut Value Chain by Gatsby Africa
 
Case study on tata clothing brand zudio in detail
Case study on tata clothing brand zudio in detailCase study on tata clothing brand zudio in detail
Case study on tata clothing brand zudio in detail
 
2024 Numerator Consumer Study of Cannabis Usage
2024 Numerator Consumer Study of Cannabis Usage2024 Numerator Consumer Study of Cannabis Usage
2024 Numerator Consumer Study of Cannabis Usage
 
Global Scenario On Sustainable and Resilient Coconut Industry by Dr. Jelfina...
Global Scenario On Sustainable  and Resilient Coconut Industry by Dr. Jelfina...Global Scenario On Sustainable  and Resilient Coconut Industry by Dr. Jelfina...
Global Scenario On Sustainable and Resilient Coconut Industry by Dr. Jelfina...
 
Japan IT Week 2024 Brochure by 47Billion (English)
Japan IT Week 2024 Brochure by 47Billion (English)Japan IT Week 2024 Brochure by 47Billion (English)
Japan IT Week 2024 Brochure by 47Billion (English)
 
NewBase 19 April 2024 Energy News issue - 1717 by Khaled Al Awadi.pdf
NewBase  19 April  2024  Energy News issue - 1717 by Khaled Al Awadi.pdfNewBase  19 April  2024  Energy News issue - 1717 by Khaled Al Awadi.pdf
NewBase 19 April 2024 Energy News issue - 1717 by Khaled Al Awadi.pdf
 
BEST Call Girls In Old Faridabad ✨ 9773824855 ✨ Escorts Service In Delhi Ncr,
BEST Call Girls In Old Faridabad ✨ 9773824855 ✨ Escorts Service In Delhi Ncr,BEST Call Girls In Old Faridabad ✨ 9773824855 ✨ Escorts Service In Delhi Ncr,
BEST Call Girls In Old Faridabad ✨ 9773824855 ✨ Escorts Service In Delhi Ncr,
 
Call Us 📲8800102216📞 Call Girls In DLF City Gurgaon
Call Us 📲8800102216📞 Call Girls In DLF City GurgaonCall Us 📲8800102216📞 Call Girls In DLF City Gurgaon
Call Us 📲8800102216📞 Call Girls In DLF City Gurgaon
 
Pitch Deck Teardown: Geodesic.Life's $500k Pre-seed deck
Pitch Deck Teardown: Geodesic.Life's $500k Pre-seed deckPitch Deck Teardown: Geodesic.Life's $500k Pre-seed deck
Pitch Deck Teardown: Geodesic.Life's $500k Pre-seed deck
 
Call Girls In Sikandarpur Gurgaon ❤️8860477959_Russian 100% Genuine Escorts I...
Call Girls In Sikandarpur Gurgaon ❤️8860477959_Russian 100% Genuine Escorts I...Call Girls In Sikandarpur Gurgaon ❤️8860477959_Russian 100% Genuine Escorts I...
Call Girls In Sikandarpur Gurgaon ❤️8860477959_Russian 100% Genuine Escorts I...
 
Market Sizes Sample Report - 2024 Edition
Market Sizes Sample Report - 2024 EditionMarket Sizes Sample Report - 2024 Edition
Market Sizes Sample Report - 2024 Edition
 
Lowrate Call Girls In Sector 18 Noida ❤️8860477959 Escorts 100% Genuine Servi...
Lowrate Call Girls In Sector 18 Noida ❤️8860477959 Escorts 100% Genuine Servi...Lowrate Call Girls In Sector 18 Noida ❤️8860477959 Escorts 100% Genuine Servi...
Lowrate Call Girls In Sector 18 Noida ❤️8860477959 Escorts 100% Genuine Servi...
 
8447779800, Low rate Call girls in Tughlakabad Delhi NCR
8447779800, Low rate Call girls in Tughlakabad Delhi NCR8447779800, Low rate Call girls in Tughlakabad Delhi NCR
8447779800, Low rate Call girls in Tughlakabad Delhi NCR
 
Keppel Ltd. 1Q 2024 Business Update Presentation Slides
Keppel Ltd. 1Q 2024 Business Update  Presentation SlidesKeppel Ltd. 1Q 2024 Business Update  Presentation Slides
Keppel Ltd. 1Q 2024 Business Update Presentation Slides
 
Islamabad Escorts | Call 03274100048 | Escort Service in Islamabad
Islamabad Escorts | Call 03274100048 | Escort Service in IslamabadIslamabad Escorts | Call 03274100048 | Escort Service in Islamabad
Islamabad Escorts | Call 03274100048 | Escort Service in Islamabad
 

Amazon Supply Chain Analysis

  • 1. worldlocityThink beyond. Execute smarter. Amazon Value Chain Analysis A quick analysis based on publicly- available information Kelly Thomas, CEO, Worldlocity 12 February, 2018
  • 2. 2 WSafe Harbor Statement Copyright © 2018 Worldlocity, LLC Analysis information provided in this document is based only on publicly- available information, judgments, and associated assumptions. Individual assumptions may or may not be accurate. Assumptions that are inaccurate could lead to incorrect analysis conclusions. The information is provided to further discussion and should not be used for decision-making, without further validation.
  • 3. 3 WAmazon Value Chain Analysis Commentary Copyright © 2018 Worldlocity, LLC The following commentary also appears on www.worldlocity.com Amazon is the juggernaut retail corporation of our day and there is much interest in how they do things. Just about every retailer in the world has had to come to grips with how to address Amazon's onslaught. Walmart, the world's largest retailer, is bound and determined to not have Amazon do to them what Walmart did to Sears, Kmart, and others. Retailers lament that Amazon runs a high-growth, zero-profit business model, and is rewarded for doing so by the investment community, while these same retailers are held to a different set of rules by the same investment community. Amazon's answer to this is that they just focus on customers, providing ever more innovative ways to serve customers; everything else just flows from that focus. The investment community says that Amazon could turn into an incredible profit engine at any time. But is this true, and if so, how will they do it? Using only information available in Amazon's 10K reports, and making some basic assumptions and calculations, Worldlocity has assembled a profile of Amazon's business, in the form of a value chain chart, which is shown on the following slide. For this analysis, we separated Amazon's business into two segments: 1) their retail products business; and 2) their services business. Their retail products business includes all physical product sales for which they own the inventory, along with various digital products sales, which are downloadable. Their services business includes retail third-party product sales for which they get commissions and fees, and also includes subscription services, Amazon Web Services (AWS), and certain advertising and co-branding products. One caveat: this analysis relies on assumptions and cost allocations, for which there is no publicly available information. Having said that, while the numbers lack precision, they are most likely directionally correct. This analysis shows that Amazon, on an operating basis, loses about 2 cents for every dollar of products it sells using its traditional selling model in which it owns the product inventory, while it makes roughly 15 cents for every dollar it sells through its services business (which includes AWS, which has operating margins of 25%). The net result of the two is that Amazon overall makes about 3 cents in operating profit for every 1 dollar it sells overall. (If readers of this analysis disagree or have better data to improve it, please contact Worldlocity). Thus, it's the business innovations that resulted from the original business model that are the profit engines now, and possibly into the future. It's difficult to see how the original business model, given its cost structure, can make money comparable to that of a traditional retailer (without some combination of price increases, cost reductions, and service reductions). This of course poses significant challenges for traditional retailers, who do not have a marketplace operation or an AWS to subsidize their product-based ecommerce. Thus, they will have to subsidize it out of their brick-and-mortar operations, diluting the margins there. Walmart is rapidly trying to ramp up its third-party marketplace operation, not just to match the choice of Amazon, but presumably to also provide fatter margins. Finally, Amazon's supply chain is a cash-generation machine, with a 2016 cash-to-cash cycle of approximately minus 35; this equates to about $13B in cash on a 2016 end-of-year revenue basis (a more precise calculation would time-phase it over the year of 2016). This money float, courtesy of its supply chain, is one of the critical flywheels of the Amazon success story. In a sense, it is not unlike the float on insurance premiums that Warren Buffet has historically used as an investment vehicle. It's a powerful statement for supply chain management. The net-net is that Amazon manages its business around cash flow, rather than bottom-line profit and profit margins. Its cash flow from operations in 2016 was $16.4B, and its free cash flow was $9.7B.
  • 4. 4 WAmazon Value Chain Analysis Amazon and third-party products (2016) Copyright © 2018 Worldlocity, LLC Product Supply (Amazon Suppliers, COGS) Amazon sold and managed products (inventory owned by Amazon) Source: Amazon 2016 10K; Worldlocity analysis $71.4B Fulfillment by Amazon and Paid Third-Parties $8.5B $71,377 $8,506 $71,377 $7,738 $3,146 $4,217 $1,567 75.4% 9.0% 8.2% 3.3% 4.5% 1.7% $79,883 $87,622 $90,767 $94,985 $96,552 Transportation Marketing Technology and Content General & Administrative and other Operating Margin $7.7B $3.1B $4.2B $1.6B -$1.9B -$1,887 -2.0% $94,665 $136B Revenue Third-party sellers, FBA, AWS, and other services Product Supply (Third-Party Suppliers, COGS) $0.7B Fulfillment by Amazon and Paid Third-Parties $9.1B $721 $9,113 $721 $8,429 $4,087 $11,868 $1,032 1.7% 22.1% 20.4% 9.9% 28.7% 2.5% $9,834 $18,262 $22,350 $34,217 $35,249 Transportation Marketing Technology and Content General & Administrative and other Operating Margin $8.4B $4.1B $11.9B $1.0B $6.1B $6,073 14.7% $41,322 $4.2B Op Margin 1 2 Notes: numbers in boxes are in $M; FBA=fulfillment by Amazon.
  • 5. 5 WAmazon Value Chain Analysis Notes and comments Copyright © 2018 Worldlocity, LLC 1. The source of this analysis is Amazon’s 2016 10K and estimates by Worldlocity. 2. Amazon’s 10K and other publicly-available information do not provide cost splits between the two value chains shown in the diagram. Furthermore, it’s difficult to allocate certain costs to different streams since they are highly operationally commingled. 3. In order to provide cost splits between value chains, triangulation was done from a number of a couple of different perspectives: 1. The first methodology attempted to derive third-party product gross revenue and then apportion fulfillment and transportation costs based on pro rata splits of the total gross product revenue that flows through Amazon’s supply chain. 2. The second methodology uses an average of the product sales (Amazon-owned inventory) and COGs (net of shipping costs) growth rates from 2011- 2016 and assumes that the incremental growth in costs of fulfillment and transportation above this rate would largely be attributable to third-party product sales that use FBA. This is highly likely to be the case with the exception that Amazon was building sortation centers (included in shipping costs) rapidly in this timeframe and that portion of shipping costs would benefit both value streams. 3. The resultant value chain chart is based on the second of the above two methodologies. 4. Cost of goods (product costs or cost of sales net of shipping costs) is a key anchor for deriving numbers for the two value streams. Based on its definition, it would make sense to attribute 100% of these costs to the product value chain. However, it is assumed that the services value chain has some nominal COGS associated with packaging, sortation equipment and other materials. For the purposes of this analysis, it is assumed that 1% of total COGS is attributable to the services value chain. 1. This has a big impact on the operating profit of the product value chain. If 100% of COGS is attributable to the product value chain or if the services chain consumes more than 1% of COGS, then the associated operating profit delta shifts from one chain to the other. 5. Fulfillment and transportation (shipping) cost allocation assumptions are as follows: 1. Using 2011 costs as a starting point, fulfillment and transportation costs are projected forward at a CAGR that is the average of the five year CAGR for product sales and COGS (net of transportation). This average is 17.2%. The idea is that if product sales were a standalone business, then fulfillment and transportation would grow in lockstep with product sales and COGS. As discussed above, it is assumed that all costs in 2016 above this rate, are assumed to be costs incurred by the services value chain. 2. To account for the fact that services sales have a starting point in 2011, (thus a portion of the cost structure in 2011 was already going to services) it is assumed that in 2011, 35% of units sold through amazon.com were third party, and that the average price of these units was comparable to Amazon product units. (The Amazon 2009 10K stated that 30% of units were third-party units). It is further assumed that 35% of these units used FBA, thus consuming supply chain costs. (FBA was first introduced in 2006). 6. Marketing cost allocation assumptions are as follows: 1. Marketing cost splits are computed in a manner comparable to computations used to derive the splits for fulfillment and transportation. 7. Technology and content cost allocation assumptions are as follows: 1. Technology and content cost splits are computed in a manner comparable to computations used to derive the splits for fulfillment and transportation, with the exception that a higher starting point reduction factor is used for the product value chain to account for the investment in AWS. (AWS operating costs are all found in the technology and content category). 8. General and administrative, and other costs allocation assumptions are as follows: 1. G&A cost splits are computed in a manner comparable to the computations used to derive the splits for fulfillment and transportation.
  • 6. 6 WAmazon Value Chain Analysis Key insights > The cost splits between the value chains could swing either way based on assumptions, but are likely to be directionally correct > Based on this analysis, the implied gross revenue handled by the Amazon supply chain in 2016 was $204B; third-party gross revenue was roughly $109B, representing 54% of the total > FBA fees average about 21% or 21 cents for every dollar of third-party gross revenue > While Amazon product revenue (Amazon-bought and owned inventory) had a 17.6% CAGR between 2011-2016, third-party gross revenue had a 37% CAGR - This shows consistency with overall services revenue growth of 46.7% since AWS was growing even faster over the same timeframe. It also shows consistency with third-party seller services growth of 40% between 2014-2016 (Amazon started breaking out AWS and third-party seller services revenue in 2014) > While the product value chain may be operationally profit-negative, it is the base against which innovations and profit engines are built - And, since Amazon manages its business around cash flow rather than profit margins, it matters little to the overall operating paradigm > Amazon’s supply chain is the cash flow engine that is the critical flywheel behind their growth - While overall company revenue had a 23% CAGR between 2011-2016, operating cash flow had a 33% CAGR. As long as this dynamic holds, they will continue to be able to invest and innovate Copyright © 2018 Worldlocity, LLC
  • 7. 7 WAmazon Value Chain Analysis Key indicators, 2011-2016 Copyright © 2018 Worldlocity, LLC Revenue and operational growth rates, 2011-2016, all indexed to 100 in 2011 $0 $100 $200 $300 $400 $500 $600 $700 Net product sales Net services sales Total revenue, $M COGS, net of transportation, $M Shipping costs (incl sortation and deliv centers), $M Fulfillment, $M Inventories, $M 2011 2012 2013 2014 2015 2016 17.6% CAGR 46.7% CAGR 23.1% CAGR 16.7% CAGR 32.3% CAGR 30.9% CAGR 18.1% CAGR
  • 8. 8 WAmazon Value Chain Analysis Key indicators, some insights Copyright © 2018 Worldlocity, LLC Revenue and operational growth rates, 2011-2016, all indexed to 100 in 2011 $0 $100 $200 $300 $400 $500 $600 $700 Net product sales Net services sales Total revenue, $M COGS, net of transportation, $M Shipping costs (incl sortation and deliv centers), $M Fulfillment, $M Inventories, $M 2011 2012 2013 2014 2015 2016 17.6% CAGR 46.7% CAGR 23.1% CAGR 16.7% CAGR 32.3% CAGR 30.9% CAGR 18.1% CAGR Net product sales, COGS (net of transportation), and inventories have all grown at comparable rates, indicating the original inventory-owned business model is roughly the same.1
  • 9. 9 WAmazon Value Chain Analysis Key indicators, some insights Copyright © 2018 Worldlocity, LLC Revenue and operational growth rates, 2011-2016, all indexed to 100 in 2011 $0 $100 $200 $300 $400 $500 $600 $700 Net product sales Net services sales Total revenue, $M COGS, net of transportation, $M Shipping costs (incl sortation and deliv centers), $M Fulfillment, $M Inventories, $M 2011 2012 2013 2014 2015 2016 17.6% CAGR 46.7% CAGR 23.1% CAGR 16.7% CAGR 32.3% CAGR 30.9% CAGR 18.1% CAGR Services sales includes AWS and third-party retail services. Amazon did not break out AWS and retail services results until 2014, so there is no way to net them out for prior periods. (AWS and retail services revenue grew by 62% and 40%, respectively, from 2014 to 2016).2
  • 10. 10 WAmazon Value Chain Analysis Key indicators, some insights Copyright © 2018 Worldlocity, LLC Revenue and operational growth rates, 2011-2016, all indexed to 100 in 2011 $0 $100 $200 $300 $400 $500 $600 $700 Net product sales Net services sales Total revenue, $M COGS, net of transportation, $M Shipping costs (incl sortation and deliv centers), $M Fulfillment, $M Inventories, $M 2011 2012 2013 2014 2015 2016 17.6% CAGR 46.7% CAGR 23.1% CAGR 16.7% CAGR 32.3% CAGR 30.9% CAGR 18.1% CAGR Outsized growth in fulfillment and shipping costs (relative to total revenue) is due to the high growth of third-party services sales and their use of fulfillment by Amazon (FBA). High shipping cost growth rate is also due to the growth of sortation facilities for local and last mile delivery support. 3
  • 11. 11 WAmazon Value Chain Analysis Key indicators definitions Copyright © 2018 Worldlocity, LLC ▪ Net product sales – sales of products where Amazon purchases the inventory, owns it, and fulfills it. Amazon records revenue based on the sale price of the product. Products include both physical and digital formats, both transactional and through subscription. This includes apportionment of Amazon Prime. ▪ Net services sales – sales of products where the supplier owns the inventory and fulfillment is either done by the supplier or fulfilled by Amazon (FBA). Services sales are based on fees associated with he product sold, not the gross price to the end customer. Net services sales also includes AWS, subscription services, advertising, and co-branding. This includes an apportionment of Amazon Prime. ▪ COGS (net of transportation costs) – Includes the purchase price of Amazon owned inventory and digital media content. Amazon includes transportation costs in cost of sales; they are segmented separately for this analysis. ▪ Shipping costs (also called transportation costs) – All outbound shipping costs for Amazon-owned inventory and third-party sellers that make use of fulfillment by Amazon (FBA). Roughly 50% of these costs are paid for by customers, or through an allocation from Amazon prime. These paid-for shipping costs show up as revenue. ▪ Fulfillment costs – costs to staff and operate Amazon fulfillment and customer service centers, including payment processing for Amazon-owned inventory and third-party seller services. ▪ Marketing costs – primarily online and other advertising and promotional costs. ▪ Technology and content costs – R&D and operational costs associated with software and technology infrastructure. AWS operational costs are also included here. ▪ General and administrative costs – corporate function costs, including HR, facilities management, finance, and legal.
  • 12. 12 WAmazon Value Chain Analysis Cash Conversion Cycle, 2011-2016 Copyright © 2018 Worldlocity, LLC Remarkable consistency in the cash conversion cycle, year-in and year-out. This is the engine that keeps the flywheel going and is a critical part of how Amazon operationally manages its business. 48.9 47.9 49.9 48.3 52.2 47.4 19.5 22.8 23.4 23.0 21.9 22.4 109.1 105.7 101.9 96.3 103.9 104.7 -40.7 -35.1 -28.7 -25.0 -29.8 -34.9 -50.0 -30.0 -10.0 10.0 30.0 50.0 70.0 90.0 110.0 2011 2012 2013 2014 2015 2016 Days in inventory Days in receivables Days in payables Cash-to-cash, days
  • 13. 13 WAmazon Value Chain Fulfillment space growth Copyright © 2018 Worldlocity, LLC 0 20,000 40,000 60,000 80,000 100,000 120,000 140,000 160,000 180,000 2011 2012 2013 2014 2015 2016 Office space square footage (1000s) Fulfillment and data center square footage (1000s) Office, fulfillment and data center square footage (1000s) ▪ At the end of 2016, Amazon had 160M square feet of space for fulfillment and data centers (Amazon does not break out its data center space separately; it is also assumed this number includes sortation space). ▪ Amazon leases 96% of its overall floor space, using a combination of operating and capital leases. ▪ Fulfillment and data center square footage had a 29.4% CAGR between 2011-2016. This is another triangulation point for deducing product gross revenue flow through its supply chain. ▪ Analysis suggests that Amazon drives about $1,300/year in gross product revenue per square foot of fulfillment space. ▪ In a sign of accelerating third-party FBA sales, Amazon added, in 2016, nearly as much fulfillment space as their total space at the end of 2011, when they were a $48B company.