Animal agriculture adaptation planning guide (climate change)LPE Learning Center
This 44-page publication produced by the AACC project is a planning guide to help guide farmers through the process of future farm planning considering climate change.
Format: Factsheet or Publication - Reference: Schmidt, D., E. Whitefield, D. Smith. 2014. Produced for Animal Agriculture in a Changing Climate Project.
What is the difference when talking about weather versus climate? How do you measure and describe the atmosphere? How are models used in predicting weather or climate? For more on this topic, visit: http://extension.org/60702
What are some of the basic principles and terminology involved in climate change? Learn more about the Earth's atmosphere, energy balance, and how the greenhouse effect can alter both climate and weather. What is climate forcing? What is climate feedback? For more on this topic, visit: http://extension.org/60702
The current state of cap-and-trade in the U.S. and the mandatory greenhouse g...LPE Learning Center
Where is U.S. policy and voluntary markets current at in terms of cap-and-trade? What is the mandatory greenhouse gas reporting rule and how does it apply to animal agriculture? For more on this topic, visit: http://extension.org/60702
Mitigation of greenhouse gas emissions in animal agricultureLPE Learning Center
What steps can animal agriculture take to reduce (mitigate) the greenhouse gas emissions from their farms? What is carbon sequestration and how will that play a role? For more on this topic, visit: http://extension.org/60702
Contribution of greenhouse gas emissions: animal agriculture in perspectiveLPE Learning Center
What are the emissions of relevant greenhouse gases from animal agriculture production and how does that compare to other industries? For more on this topic, visit: http://extension.org/60702
User capabilities and next generation phosphorus (p) indicesLPE Learning Center
Full proceedings available at: http://www.extension.org/72814
The phosphorus (P) index is the primary approach to identify field management strategies and/or manure application strategies likely to lead to excessive risk of P loss. It has been over 40 years since the first research connecting agronomic P management and water quality and over 20 years since the initial publication defining a P Index. This session will consider opportunities to build on and expand existing P Index strategies to make them more effective at protecting water quality and friendlier to the target user.
Full proceedings available at: http://www.extension.org/72818
Phosphorus indices provide relative loss ratings that then have a corresponding management response. Because most state Phosphorus Indices are qualitative it is not clear how the relative loss rating corresponds to actual phosphorus inputs into the receiving water and how the receiving water would react to these additions. Even with qualitative Phosphorus Indices, unless the water resource has a specific Total Maximum Daily Load, it is not clear how losses correspond to water quality outcomes. These issues will be discussed in the context of the 590 Natural Resources Conservation Standard for nutrient management.
Full proceedings available at: http://www.extension.org/72868
There has been a tremendous amount of activity and funding of conservation programs with regional and watershed-specific cost-share initiatives. While there have been some successes, water quality response in many areas has not been as great as expected. This has led many to question the efficacy of these measures and to call for stricter land and nutrient management strategies. In many cases, this limited response has been due to the legacies of past management activities, where sinks and stores of phosphorus along the land-freshwater continuum mask the effects of reductions in edge-of-field losses of phosphorus.
Estimation of phosphorus loss from agricultural land in the southern region o...LPE Learning Center
Full Proceedings is available at: http://www.extension.org/72817
The purpose of our work was to determine, within the southern region (AL, AR, FL, GA, KY, LA, MS, NC, OK, SC, TN, and TX), the feasibility of using different models to determine potential phosphorus loss from agricultural fields in lieu of phosphorus indices.
Estimation of phosphorus loss from agricultural land in the heartland region ...LPE Learning Center
Full Proceedings is available at: http://www.extension.org/72813
Phosphorus (P) indices are a key tool to minimize P loss from agricultural fields but there is insufficient water quality data to fully test them. Our goal is to use the Agricultural Policy/Environmental eXtender Model (APEX), calibrated with existing edge-of-field runoff data, to refine P indices and demonstrate their utility as a field assessment tool capable of protecting water quality. In this phase of the project our goal is to use existing small-watershed data from the Heartland Region (IA, KS, MO and NE) to determine the level of calibration needed for APEX before using the model to generate estimates of P loads appropriate for evaluating a P Index.
Checking ambition with reality the pros and cons of different approaches to s...LPE Learning Center
Full proceedings available at: http://www.extension.org/72793
The revision of the USDA-NRCS national standard for nutrient management in 2011 was driven, in part, by inconsistencies in state phosphorus (P) indices, rekindling debates over standardizing indices at regional or national scales. Reasonable arguments exist for maintaining the status quo, which allows for state specific site assessment approaches, as well as for regional and national P Indices, which would take advantage of expertise, resources and technologies that may not exist locally. In addition, a diversity of site assessment approaches have now been proposed that differ from the original P Index. Understanding the benefits and limitations provided with these approaches is key to advancing site assessment for P management.
Removing phosphorus from drainage water the phosphorus removal structureLPE Learning Center
Full proceedings available at: http://www.extension.org/72839
We constructed a phosphorus (P) removal structure on a poultry farm in Eastern OK; this is a BMP that can remove dissolved P loading in the short term until soil legacy P concentrations decrease below levels of environmental concern. A P removal structure contains P sorbing materials (PSMs) and are placed in a location to intercept runoff or subsurface drainage with high dissolved P concentrations. As high P water flows through the PSMs, dissolved P is sorbed onto the materials by several potential mechanisms, allowing low P water to exit the structure. While they vary in form, P removal structures contain three main elements: 1) use of a filter material that has a high affinity for P, 2) containment of the material, and 3) the ability to remove that material and replace it after it becomes saturated with P and is no longer effective.
Legacy phosphorus in calcareous soils effects of long term poultry litter app...LPE Learning Center
Full proceedings available at: http://www.extension.org/72864
Livestock manures, including poultry litter, are often applied to soil as crop fertilizer or as a disposal mechanism near livestock housing. Manures can improve soil quality and fertility; however, over-application can result in negative environmental consequences, such as eutrophication of surface waters following runoff of soluble or particulate-associate phosphorus (P). In soil, P exists in many forms (inorganic/organic, labile/stable) and the fate of manure P is highly dependent upon soil properties, including soil texture and microbial activity. The Houston Black series is a calcareous (~17% calcium carbonate), high-clay soil that occupies roughly 12.6 million acres in east-central Texas. These Blackland vertizols are agronomically important for the production of cotton, corn, hay, and other crops, but their high calcium and clay content could lead to accumulation of P in forms that are not readily available for plant utilization. Accumulated P could serve as a source of legacy P if mineralized or otherwise transformed in situ or transported with soil particles in runoff.
Identify and synthesize methods to refine phosphorus indices from three regio...LPE Learning Center
The full proceedings paper is at: http://www.extension.org/72867
This project was started to work with regional CIG projects to calibrate and harmonize Phosphorus Indices across the U.S., demonstrate their accuracy in identifying the magnitude and extent of phosphorus loss risk, and provide suggestions to refine or improve existing Indices. This research is important to provide consistency among state Phosphorus Indices and their subsequent recommendations.
Modeling phosphorus runoff in the chesapeake bay region to test the phosphoru...LPE Learning Center
Full Proceedings available at: http://www.extension.org/72795
The revision of USDA-NRCS’s standard for nutrient management coincided with significant assessment of the performance of Phosphorus (P) Indices in the six states that are tied to the Chesapeake Bay watershed. The 64,000 square mile watershed is the focus of unprecedented activity around nutrient management as a result of a 2011 Total Maximum Daily Load for P, nitrogen (N), and sediment under the Clean Water Act. In addition, the state of Maryland had required updates to it’s original P Index, resulting in broad scrutiny by various interest groups. Within this setting, USDA-NRCS funded a multi-state project to help advance the testing and harmonization of P-based management in the Chesapeake region.
Measuring Nitrous Oxide & Methane from Feedyard Surfaces - the NFT-NSS Chambe...LPE Learning Center
Full proceedings at: http://www.extension.org/72909 Accurate estimation of greenhouse gas emissions, including nitrous oxide and methane, from open beef cattle feedlots is an increasing concern given the current and potential future reporting requirements for GHG emissions. Research measuring emission fluxes of GHGs from open beef cattle feedlots, however, has been very limited. Soil and environmental scientists have long used various chamber based techniques, particularly non-flow-through - non-steady-state (NFT-NSS) chambers for measuring soil fluxes. Adaptation of this technique to feedyards presents a series of challenges, including spatial variability, presence of animals, chamber base installation issues, gas sample collection and storage, concentration analysis range, and flux calculations.
Feeding Strategies to Mitigate Cost and Environmental Footprint of Pig Produc...LPE Learning Center
Full proceedings at: http://www.extension.org/72746 The livestock sector is one of main drivers of the environmental footprint. Animal feed is a key to sustainable meat production. Researchers are looking for environmentally sustainable feeding strategies that will lower diet cost, agricultural use of land, water depletion, and climate change impact. We used linear models to formulate 4 single-objective diets including least-cost, least-land use, least-water depletion, and least-climate change impact diets. Preliminary results showed that the use of wheat and wheat middlings hold potential to reduce pig diet cost and the environmental footprint.
Often we believe “if they only understood the facts, they would agree with us.” However, this method only works with a small part of the population. Opinion formation is very complex and includes many other factors besides scientific facts, such as emotion, values, and trust.
Fear-based messaging has been frequently used as an attempt to provide a spark that will lead to further learning and behavioral changes. However, these messages must be coupled with both information and support in order to be effective. Without these two resources, people often suffer from feelings of helplessness, remoteness, and lack of control over the situation which all prevent behavior change from occurring. For more, visit: http://www.extension.org/69114
Climate science part 3 - climate models and predicted climate changeLPE Learning Center
Many lines of evidence, from ice cores to marine deposits, indicate that Earth’s temperature, sea level, and distribution of plant and animal species have varied substantially throughout history. Ice cores from Antarctica suggest that over the past 400,000 years global temperature has varied as much as 10 degrees Celsius through ice ages and periods warmer than today. Before human influence, natural factors (such as the pattern of earth’s orbit and changes in ocean currents) are believed to be responsible for climate changes. For more, visit: http://www.extension.org/69150
for more, http://www.extension.org/69093 Changes in precipitation and temperature vary by region. In general the US is seeing more precipitation and the timing and intensity of precipitation is also changing. While global temperatures are increasing, it is the variability and intensity of temperatures that are of greatest consequence to animal agriculture.
Climate Is Always Changing: Regional, National, and Global Trends (and how th...LPE Learning Center
For more, visit: http://www.extension.org/70286 Weather happens and the climate is always changing. Farmers are very in tune with these changes because weather is critical to any farming operation. What are the current weather trends in your area? Is it hotter? dryer? cooler? warmer? Is the growing season longer? Has the first frost date changed?
There is a real possibility that the weather of 30 years ago is not what we are seeing today or will see 30 years from now. The video to the right gives an overview of some of the weather trends.
The Indian economy is classified into different sectors to simplify the analysis and understanding of economic activities. For Class 10, it's essential to grasp the sectors of the Indian economy, understand their characteristics, and recognize their importance. This guide will provide detailed notes on the Sectors of the Indian Economy Class 10, using specific long-tail keywords to enhance comprehension.
For more information, visit-www.vavaclasses.com
Students, digital devices and success - Andreas Schleicher - 27 May 2024..pptxEduSkills OECD
Andreas Schleicher presents at the OECD webinar ‘Digital devices in schools: detrimental distraction or secret to success?’ on 27 May 2024. The presentation was based on findings from PISA 2022 results and the webinar helped launch the PISA in Focus ‘Managing screen time: How to protect and equip students against distraction’ https://www.oecd-ilibrary.org/education/managing-screen-time_7c225af4-en and the OECD Education Policy Perspective ‘Students, digital devices and success’ can be found here - https://oe.cd/il/5yV
Palestine last event orientationfvgnh .pptxRaedMohamed3
An EFL lesson about the current events in Palestine. It is intended to be for intermediate students who wish to increase their listening skills through a short lesson in power point.
We all have good and bad thoughts from time to time and situation to situation. We are bombarded daily with spiraling thoughts(both negative and positive) creating all-consuming feel , making us difficult to manage with associated suffering. Good thoughts are like our Mob Signal (Positive thought) amidst noise(negative thought) in the atmosphere. Negative thoughts like noise outweigh positive thoughts. These thoughts often create unwanted confusion, trouble, stress and frustration in our mind as well as chaos in our physical world. Negative thoughts are also known as “distorted thinking”.
How to Create Map Views in the Odoo 17 ERPCeline George
The map views are useful for providing a geographical representation of data. They allow users to visualize and analyze the data in a more intuitive manner.
The Roman Empire A Historical Colossus.pdfkaushalkr1407
The Roman Empire, a vast and enduring power, stands as one of history's most remarkable civilizations, leaving an indelible imprint on the world. It emerged from the Roman Republic, transitioning into an imperial powerhouse under the leadership of Augustus Caesar in 27 BCE. This transformation marked the beginning of an era defined by unprecedented territorial expansion, architectural marvels, and profound cultural influence.
The empire's roots lie in the city of Rome, founded, according to legend, by Romulus in 753 BCE. Over centuries, Rome evolved from a small settlement to a formidable republic, characterized by a complex political system with elected officials and checks on power. However, internal strife, class conflicts, and military ambitions paved the way for the end of the Republic. Julius Caesar’s dictatorship and subsequent assassination in 44 BCE created a power vacuum, leading to a civil war. Octavian, later Augustus, emerged victorious, heralding the Roman Empire’s birth.
Under Augustus, the empire experienced the Pax Romana, a 200-year period of relative peace and stability. Augustus reformed the military, established efficient administrative systems, and initiated grand construction projects. The empire's borders expanded, encompassing territories from Britain to Egypt and from Spain to the Euphrates. Roman legions, renowned for their discipline and engineering prowess, secured and maintained these vast territories, building roads, fortifications, and cities that facilitated control and integration.
The Roman Empire’s society was hierarchical, with a rigid class system. At the top were the patricians, wealthy elites who held significant political power. Below them were the plebeians, free citizens with limited political influence, and the vast numbers of slaves who formed the backbone of the economy. The family unit was central, governed by the paterfamilias, the male head who held absolute authority.
Culturally, the Romans were eclectic, absorbing and adapting elements from the civilizations they encountered, particularly the Greeks. Roman art, literature, and philosophy reflected this synthesis, creating a rich cultural tapestry. Latin, the Roman language, became the lingua franca of the Western world, influencing numerous modern languages.
Roman architecture and engineering achievements were monumental. They perfected the arch, vault, and dome, constructing enduring structures like the Colosseum, Pantheon, and aqueducts. These engineering marvels not only showcased Roman ingenuity but also served practical purposes, from public entertainment to water supply.
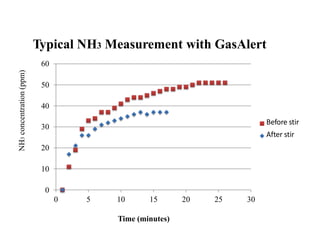
1. Typical NH3 Measurement with GasAlert
60
NH3 concentration (ppm)
50
40
Before stir
30
After stir
20
10
0
0 5 10 15 20 25 30
Time (minutes)
2. Manure Temperature Treatment Comparison
17.0
Manure Temp (℃)
16.5 a
b b
b
16.0 c c c
d
15.5
15.0
No MTM MTM No MTM No MTM MTM No MTM MTM
MTM
W/o Solids With solids W/o solids With solids
AD manure Non -AD manure
Pabcd <0.004
3. Manure pH Treatment Comparison
9.0
8.5 a ab
ab b
Manure pH
8.0 c
d
7.5
e e
7.0
6.5
No MTM MTM No MTM MTM No MTM MTM No MTM MTM
W/o Solids With solids W/o solids With solids
AD manure Non -AD manure
Pabcde<0.06
4. Manure pH Week Effect Comparison
9.0
a
Manure pH
8.5 b
c
d d
8.0 e
g f
7.5 gh
i hi i
7.0
6.5
1st 2nd 3rd 5th 7th 8th 10th 11th 12th 13th 15th 17th
Estimate 7.3 7.2 7.3 7.2 7.4 7.5 7.8 8.1 8.1 8.3 8.4 8.5
Pabcdefghi <0.06
5. Pre and Post Mixing Average NH3 Treatment Comparison
40
35
Average NH3 (ppm)
30
25
20 a
Pre Mixing
a a a
PostMixing
15 a a a a
b b
10
b c c
5 b b b
0
No MTM MTM No MTM MTM No MTM MTM No MTM MTM
W/o Solids With solids W/o solids With solids
Pabc <0.03 AD manure Non -AD manure
6. Pre and Post Mixing NH3 Peak Treatment Comparison
40
Peak NH3 (ppm)
35
a a a a
30
a a a a
25
b b
20 Pre Mixing
15 b b PostMixing
c c
10 b b
5
0
No MTM MTM No MTM MTM No MTM MTM No MTM MTM
W/o Solids With solids W/o solids With solids
Pabc <0.03 AD manure Non -AD manure
7. Pre and Post stir NH3 Flux treatment comparison
140
120
(µg/min/m2)
100 a a a a
80 ab
a ab b Post Mixing
60 Pre Mixing
b b
b
40 c c b
c c
20
0
No MTM MTM No MTM MTM No MTM MTM No MTM MTM
W/o Solids With solids W/o solids With solids
AD manure Non -AD manure
Pabc <0.06