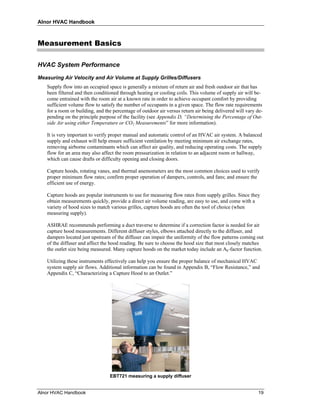
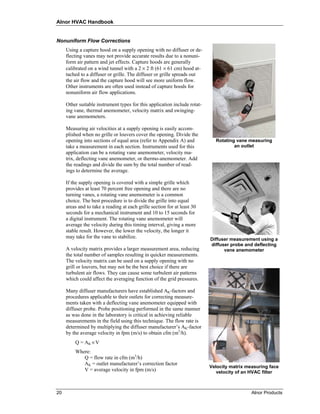
The document provides an overview of instrumentation and measurement techniques for HVAC systems. It discusses various types of measurement devices like capture hoods, thermo-anemometers, manometers, and gas analyzers. It also covers common HVAC measurements such as air velocity, volume, static pressure, temperature, humidity and gas concentrations. Measurement basics are explained for tasks like duct traversing, clean room certification, and determining outside air percentages.


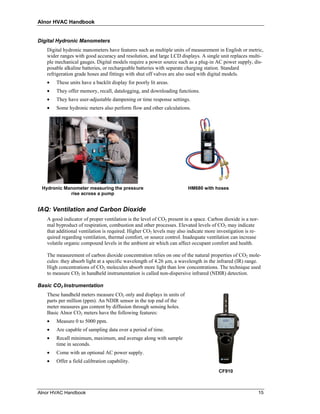
![Alnor HVAC Handbook
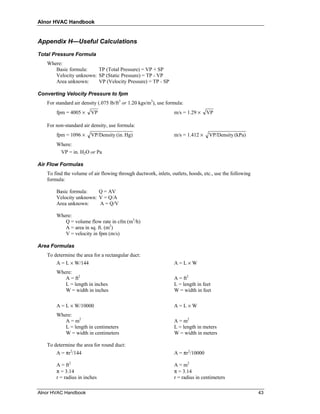
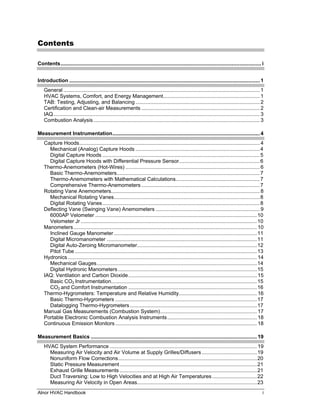
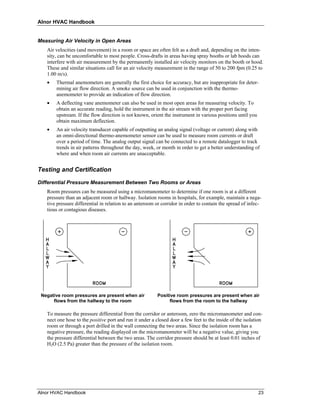
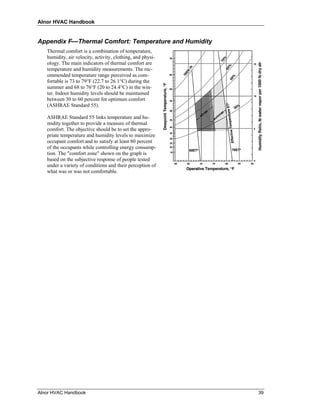
Appendix G—Density Correction
Velocity is generally expressed in one of two ways: actual (true) velocity or standard velocity. Actual
velocity is the average speed at which the molecules are traveling. Standard velocity is referenced to
standard conditions (using a reference of 70°F [21.1°C] and 29.92 in. Hg [101.4 kPa]) and is equal to
the actual velocity of the air only when the air is at standard density. The Alnor calibration facilities
adjust the actual velocity so that the same number of molecules per unit time are passing over the
probe, as if the density were standard density. This makes the instruments display standard velocity.
As a practical matter, many users do not concern themselves with standard versus actual air velocity
corrections unless the density of air in their application is more than 10 percent different from standard
air density.
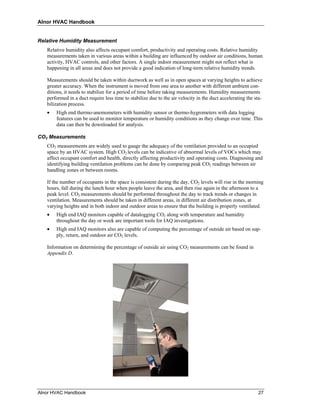
Density Correction for Thermo-Anemometers
Thermo-anemometer sensors measure mass air flow velocity which is a measurement of the air mass
moving past the sensor and is displayed as standard velocity. Air mass is what gives air its heat holding
capacity. Since thermal anemometers measure air mass and display it as standard velocity, many peo-
ple doing measurements on indoor air are more concerned with standard air velocity.
Standard readings can be converted to actual air velocity to compensate for temperature and barometric
pressures. Actual or standard measurements will give the same readings at standard conditions (using a
reference of 70°F [21.1°C] and 29.92 in. Hg [101.4 kPa]), but not if pressure or temperature stray from
standard conditions.
To calculate actual air velocity, multiply the standard velocity reading indicated by the thermo-
anemometer by the following density correction factor:
Actual Velocity = (Standard Velocity) [(460 + T) / (460 + 70)] × 29.92 / Pm
or
Actual Velocity = (Standard Velocity) [(273 + Tm) / (273 + 21.1)] × 101.4 / P
Where:
T = Ambient temperature in degrees Fahrenheit
Pm = Ambient pressure in inches of Hg.
Tm = Ambient temperature in degrees Centigrade
P = Ambient pressure in kPa
Density Correction for Pressure Based Manometers or Deflecting Vane Anemometers
Manometers and deflecting vane anemometers read a nominal velocity that is neither standard nor ac-
tual, but a combination of both. This is the velocity read by any Pitot tube and pressure device that
does not perform a density correction.
When Bernoulli’s equation is applied to the Pitot-static probe, the resultant equation has the form
( )
fpm = 4005 ΔP (in. H 2 O) m/s = 1.29 ΔP (Pa) when the density of the air is 0.075 lb/ft2
(0.366 kgs/m3). The velocity values displayed by the pressure instrument are the actual velocities only
if the density where the Pitot probe measurements are being taken is 0.075 lb/ft2 (0.366 kgs/m3).
Otherwise, a correction step must be performed to obtain a correct value.
Nominal velocity is a velocity reading that is between actual and standard velocity. It is a good estima-
tion of the actual or standard velocity. Nominal measurements are made using a pitot tube.
Actual velocity is the velocity at which a molecule would be traveling in the air stream.
Standard velocity is the velocity as if the measurement was taken with a thermal anemometer at stan-
dard temperature and barometric pressure.
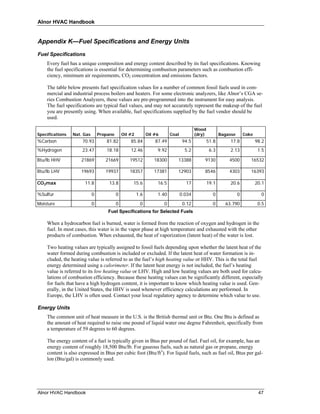
40 Alnor Products](https://image.slidesharecdn.com/alnorhvachandbook-111207035705-phpapp01/85/Alnor-hvac-handbook-46-320.jpg)
![Alnor HVAC Handbook
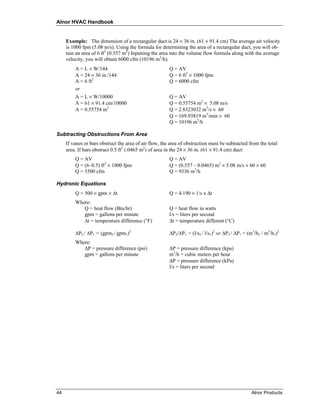
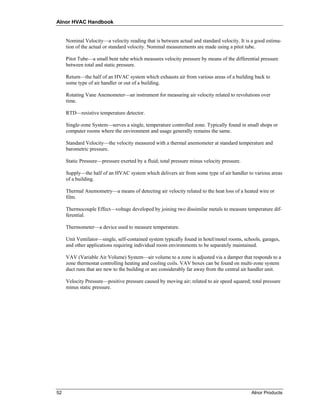
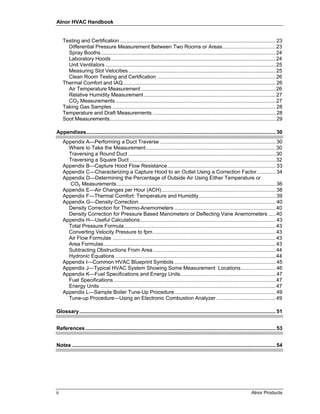
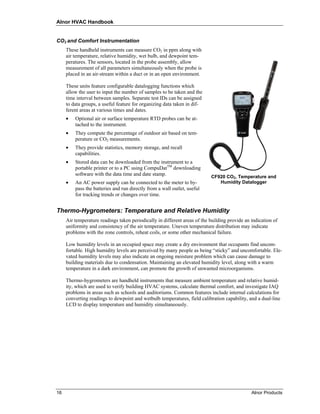
Standard (or mass) velocity in imperial units may be calculated by applying the following formula.
V (standard) = V (displayed) × [P(actual) / P(standard)]½
Where:
V (displayed) = Velocity displayed by manometer
P (standard) = 29.92 in. Hg
P (actual) = Density of air where the pitot tube is located
Actual (or True) velocity may be calculated by applying the following formula.
V (actual) = V (displayed) × [P(standard) / P(actual)]½
Where:
V (displayed) = Velocity displayed by manometer
P (standard) = 29.92 in. Hg
P (actual) = Density of air where the pitot tube is located
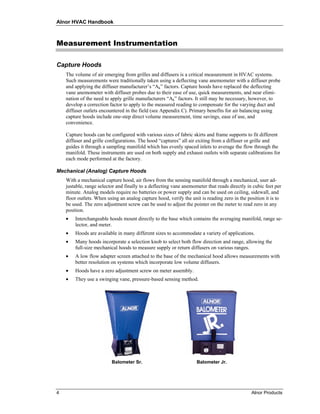
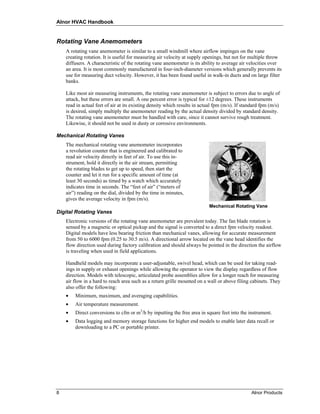
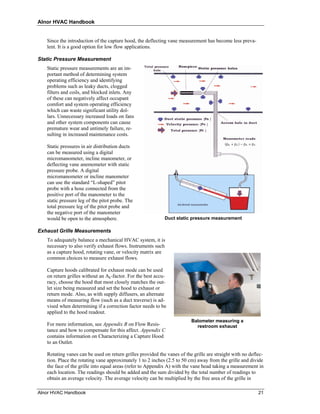
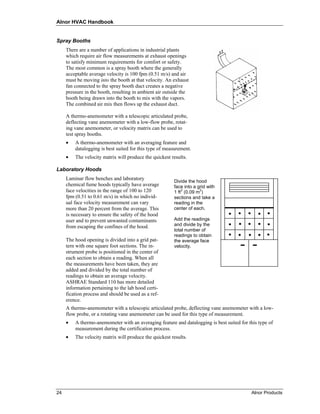
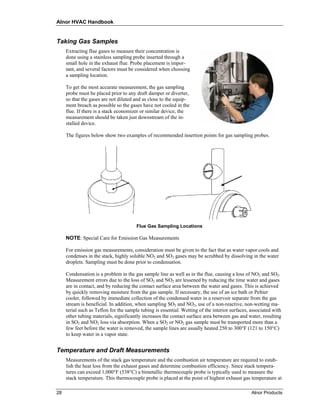
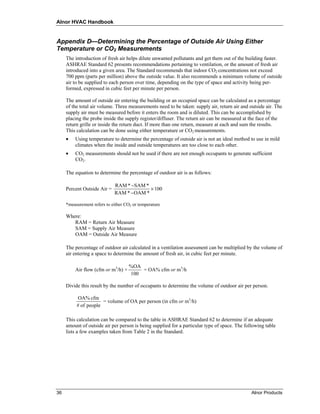
Altitude versus Barometric Pressure
7200
6900
6600
6300
6000
5700
5400
5100
4800
4500
Altitude in Feet
4200
3900
3600
3300
3000
2700
2400
2100
1800
1500
1200
900
600
300
0
.6
.8
.7
2
8
6
4
3
2
2
1
1
1
2
2
3
5
6
8
2
5
7
4
7
1
.9
.2
.9
.6
.3
.0
.7
.4
.1
.8
.5
.2
.9
.6
.3
.0
.5
.2
.9
.4
.1
.9
29
24
23
29
29
28
28
28
28
27
27
27
26
26
26
25
25
25
25
24
24
23
23
23
22
Barom etric Pressure, InHg
Note: This chart is intended to give the general indication of pressure at various altitudes when refer-
enced to sea level. This chart does not take into consideration the day-to-day variations of barometric
pressure.
In the United States, the barometric pressure reported by the National Weather Service is corrected to
sea level and, therefore, cannot be used unless your measurements are taken at sea level. The pre-
ferred method is to use the atmospheric pressure at the location of the measurement.
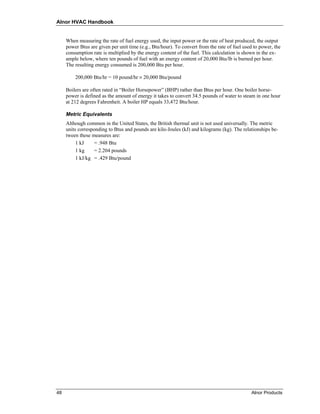
Alnor HVAC Handbook 41](https://image.slidesharecdn.com/alnorhvachandbook-111207035705-phpapp01/85/Alnor-hvac-handbook-47-320.jpg)
![Alnor HVAC Handbook
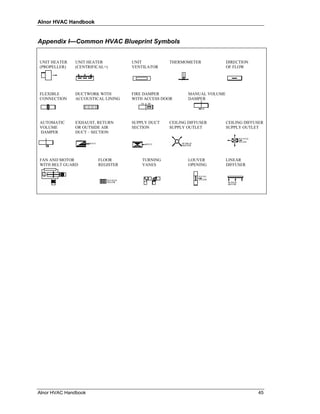
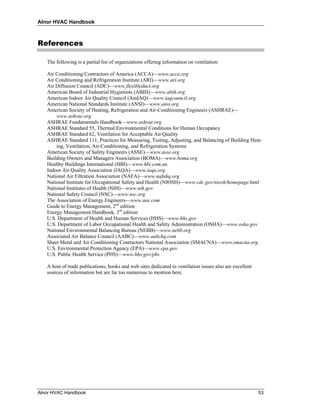
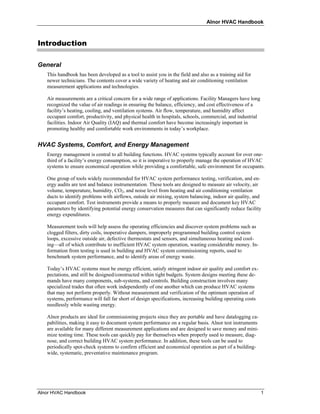
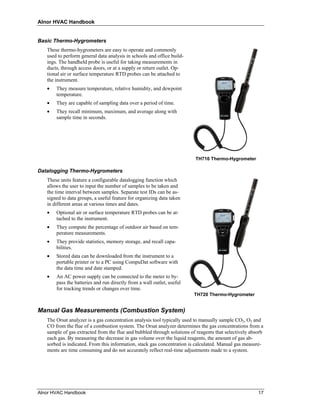
Standard (or mass) velocity in metric units may be calculated by applying the following formula.
V (standard) = V (displayed) × [P(actual) / P(standard)]½
Where:
V (displayed) = Velocity displayed by manometer
P (standard) = 101.4 kPa
P (actual) = Density of air where the pitot tube is located
Actual (or True) velocity may be calculated by applying the following formula.
V (actual) = V (displayed) × [P(standard) / P(actual)]½
Where:
V (displayed) = Velocity displayed by manometer
P (standard) = 101.4 kPa
P (actual) = Density of air where the pitot tube is located
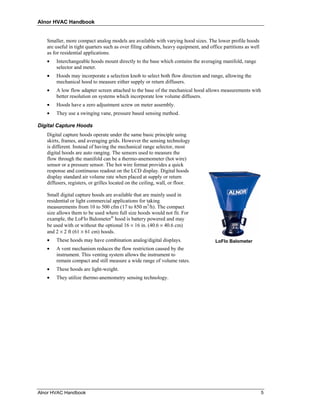
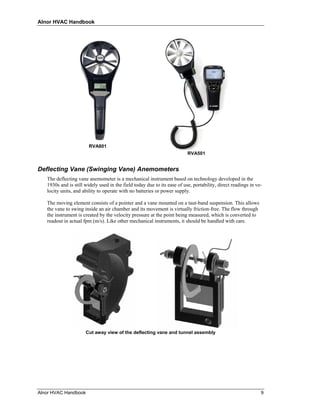
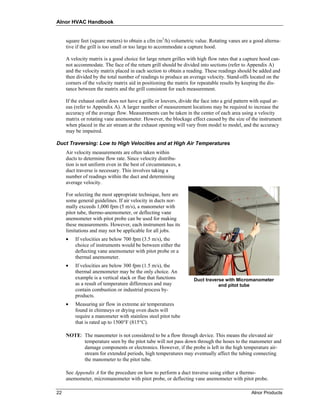
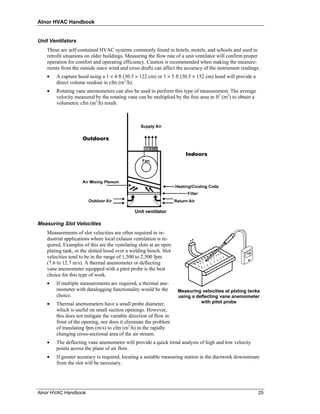
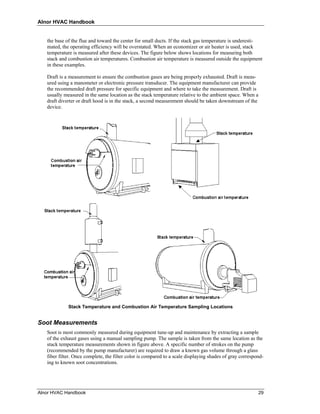
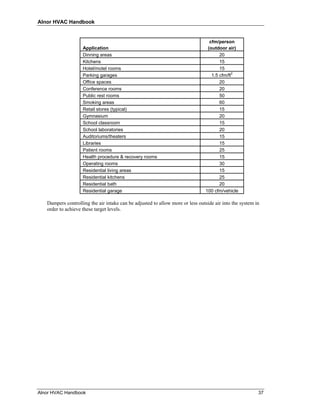
Altitude versus Barometric Chart
2500
2400
2300
2200
2100
2000
1900
1800
1700
1600
1500
Altitude in Meters
1400
1300
1200
1100
1000
900
800
700
600
500
400
300
200
100
0
91
.6
.6
.7
.5
.5
.5
.5
4
1
.9
.8
.6
.6
.6
.5
.5
.5
.5
.5
.3
.2
.1
.9
.8
.7
1.
0.
74
78
77
76
75
85
83
82
81
80
79
98
97
96
95
94
93
92
89
88
87
86
84
10
10
Barometric Pressure, kPa
In the United States, the barometric pressure reported by the National Weather Service is corrected to
sea level and, therefore, cannot be used unless your measurements are taken at sea level. The pre-
ferred method is to use the atmospheric pressure at the location of the measurement.
42 Alnor Products](https://image.slidesharecdn.com/alnorhvachandbook-111207035705-phpapp01/85/Alnor-hvac-handbook-48-320.jpg)