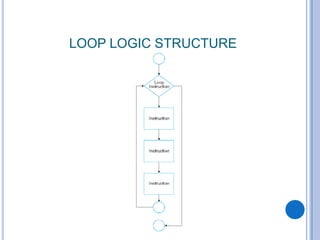
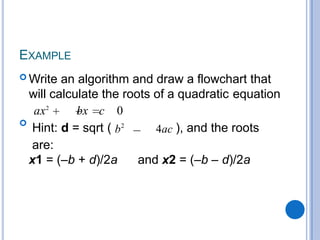
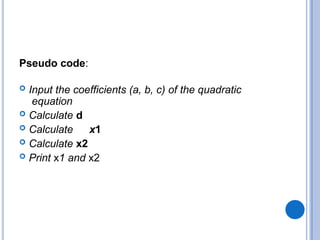
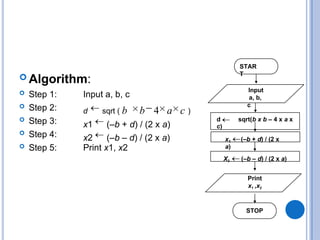
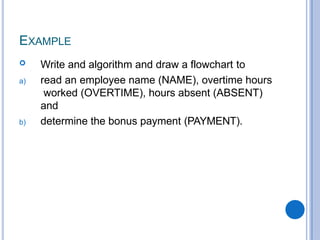
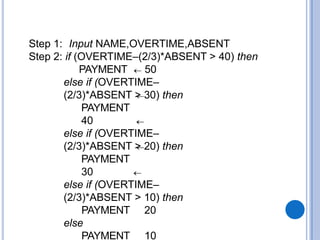
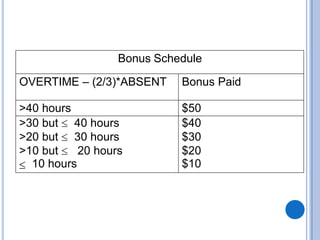
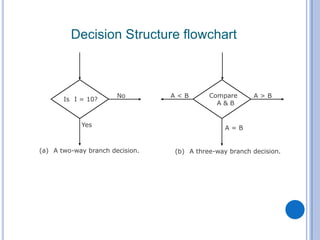
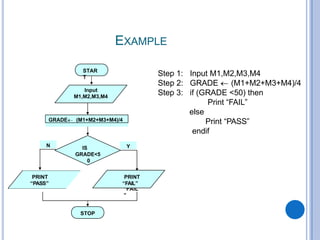
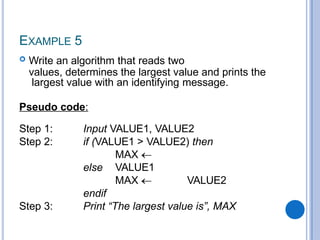
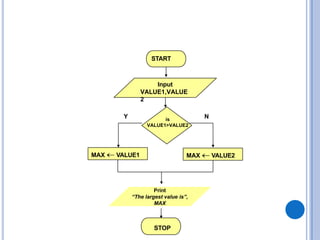
The document outlines problem-solving algorithms and flowcharts, describing their construction using standardized symbols and connections. It provides examples of decision structures, nested ifs, and loops within algorithms, explaining how to calculate grades, areas, and bonus payments. Various pseudocode examples clarify the algorithmic logic for each scenario, enhancing understanding of flowcharting and algorithm design.


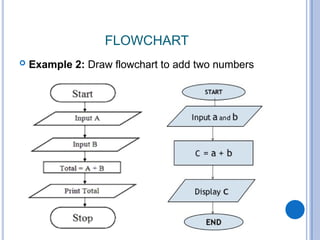
![Step 1: Input N1, N2,
N3 Step 2: if (N1>N2)
then
if (N1>N3)
then
MAX N1 [N1>N2, N1>N3]
else
MAX N3 [N3>N1>N2]
endif
else
if
(N2
>N3
)
then
MAX N2 [N2>N1, N2>N3]
else
MAX N3 [N3>N2>N1]
endif
endif
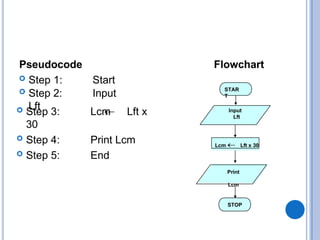
Step 3: Print “The largest number is”, MAX](https://image.slidesharecdn.com/flowcharts-241219080530-5281d813/85/Problem-Solving-Introduction-to-Flowcharts-pptx-18-320.jpg)