Graph Function by Making a Table of Values and Finding Zeros
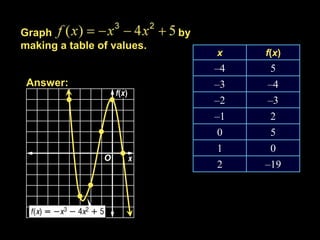
1. Graph by making a table of values. Answer: Example 2-1a
2. Determine consecutive values of x between whicheach real zero of the function is located. Then draw the graph. change in signs change in signs change in signs change in signs change in signs means the x-axis was crossed There are zeros between x = –2 and –1, x = –1and 0, x = 0 and 1, and x = 2 and 3. Example 2-2a
4. Graph Estimate the x-coordinates at which therelative maximum and relative minimumoccur. relative maximum at about x = 0 relative minimum at about x = 3 Example 2-3b