Download to read offline


![27
B
H
h
b
Winglets improve aerodynamic efficiency by reducing drag (they help to dissipate
wingtip vortices, a contributor to induced drag at wingtips, and increase Oswald efficiency by
around 10%). Only zero-lift drag increases marginally, because of a small increase in wetted area
(we account for this when required in this report).
The handling benefits offered by winglets are numerous, too: rudder yaw control
improves, heading overshoot is reduced, and stall speeds are lower.
Our winglets are depicted below:
Figure 17: Winglets
Structural Analysis
Research into the nature of composite (carbon fiber) materials in aviation yielded the
discovery that composite wings support loads in a markedly different manner than conventional
aluminum construction. The skin of a carbon fiber aircraft is much
more capable of supporting loads than an aluminum skin would be,
and so the interior structure is very different.
Without the tools at our disposal to completely alter the way
we conduct structural analysis, we have elected to use a box spar,
which, to a limited degree, simulates the skin effect and also the
tube spars used in some carbon fiber aircraft. Our composite spar is
depicted here.
The area of the spar
is BH – bh. Its moment of
inertia is:
[ ]
For structural analysis, we used an elliptic
loading, which is characterized by a distribution as
follows:
√ ( )
With a total aircraft weight of 14,543 kg, the load supported by each wing at cruise is
(14543 / 2) * 9.81 = 71,262 newtons. A safety factor of 3.5 is used henceforth.
Properties of carbon fiber
λ 275 GPa
ρ 1.75 g/cm3
Tensile strength 3.5 GPa
Compressive strength 1.25 GPa
Poisson's ratio 0.69
Shear modulus 15.15 GPa
Shear strength 55.15 MPa
Young's modulus 234.4 GPa
Front: Side: Top:
*
Figure 18: Box spar](https://image.slidesharecdn.com/aircraftdesignreport-230806184739-0cb0c8ea/75/Aircraft-Design-Report-27-2048.jpg)


![34
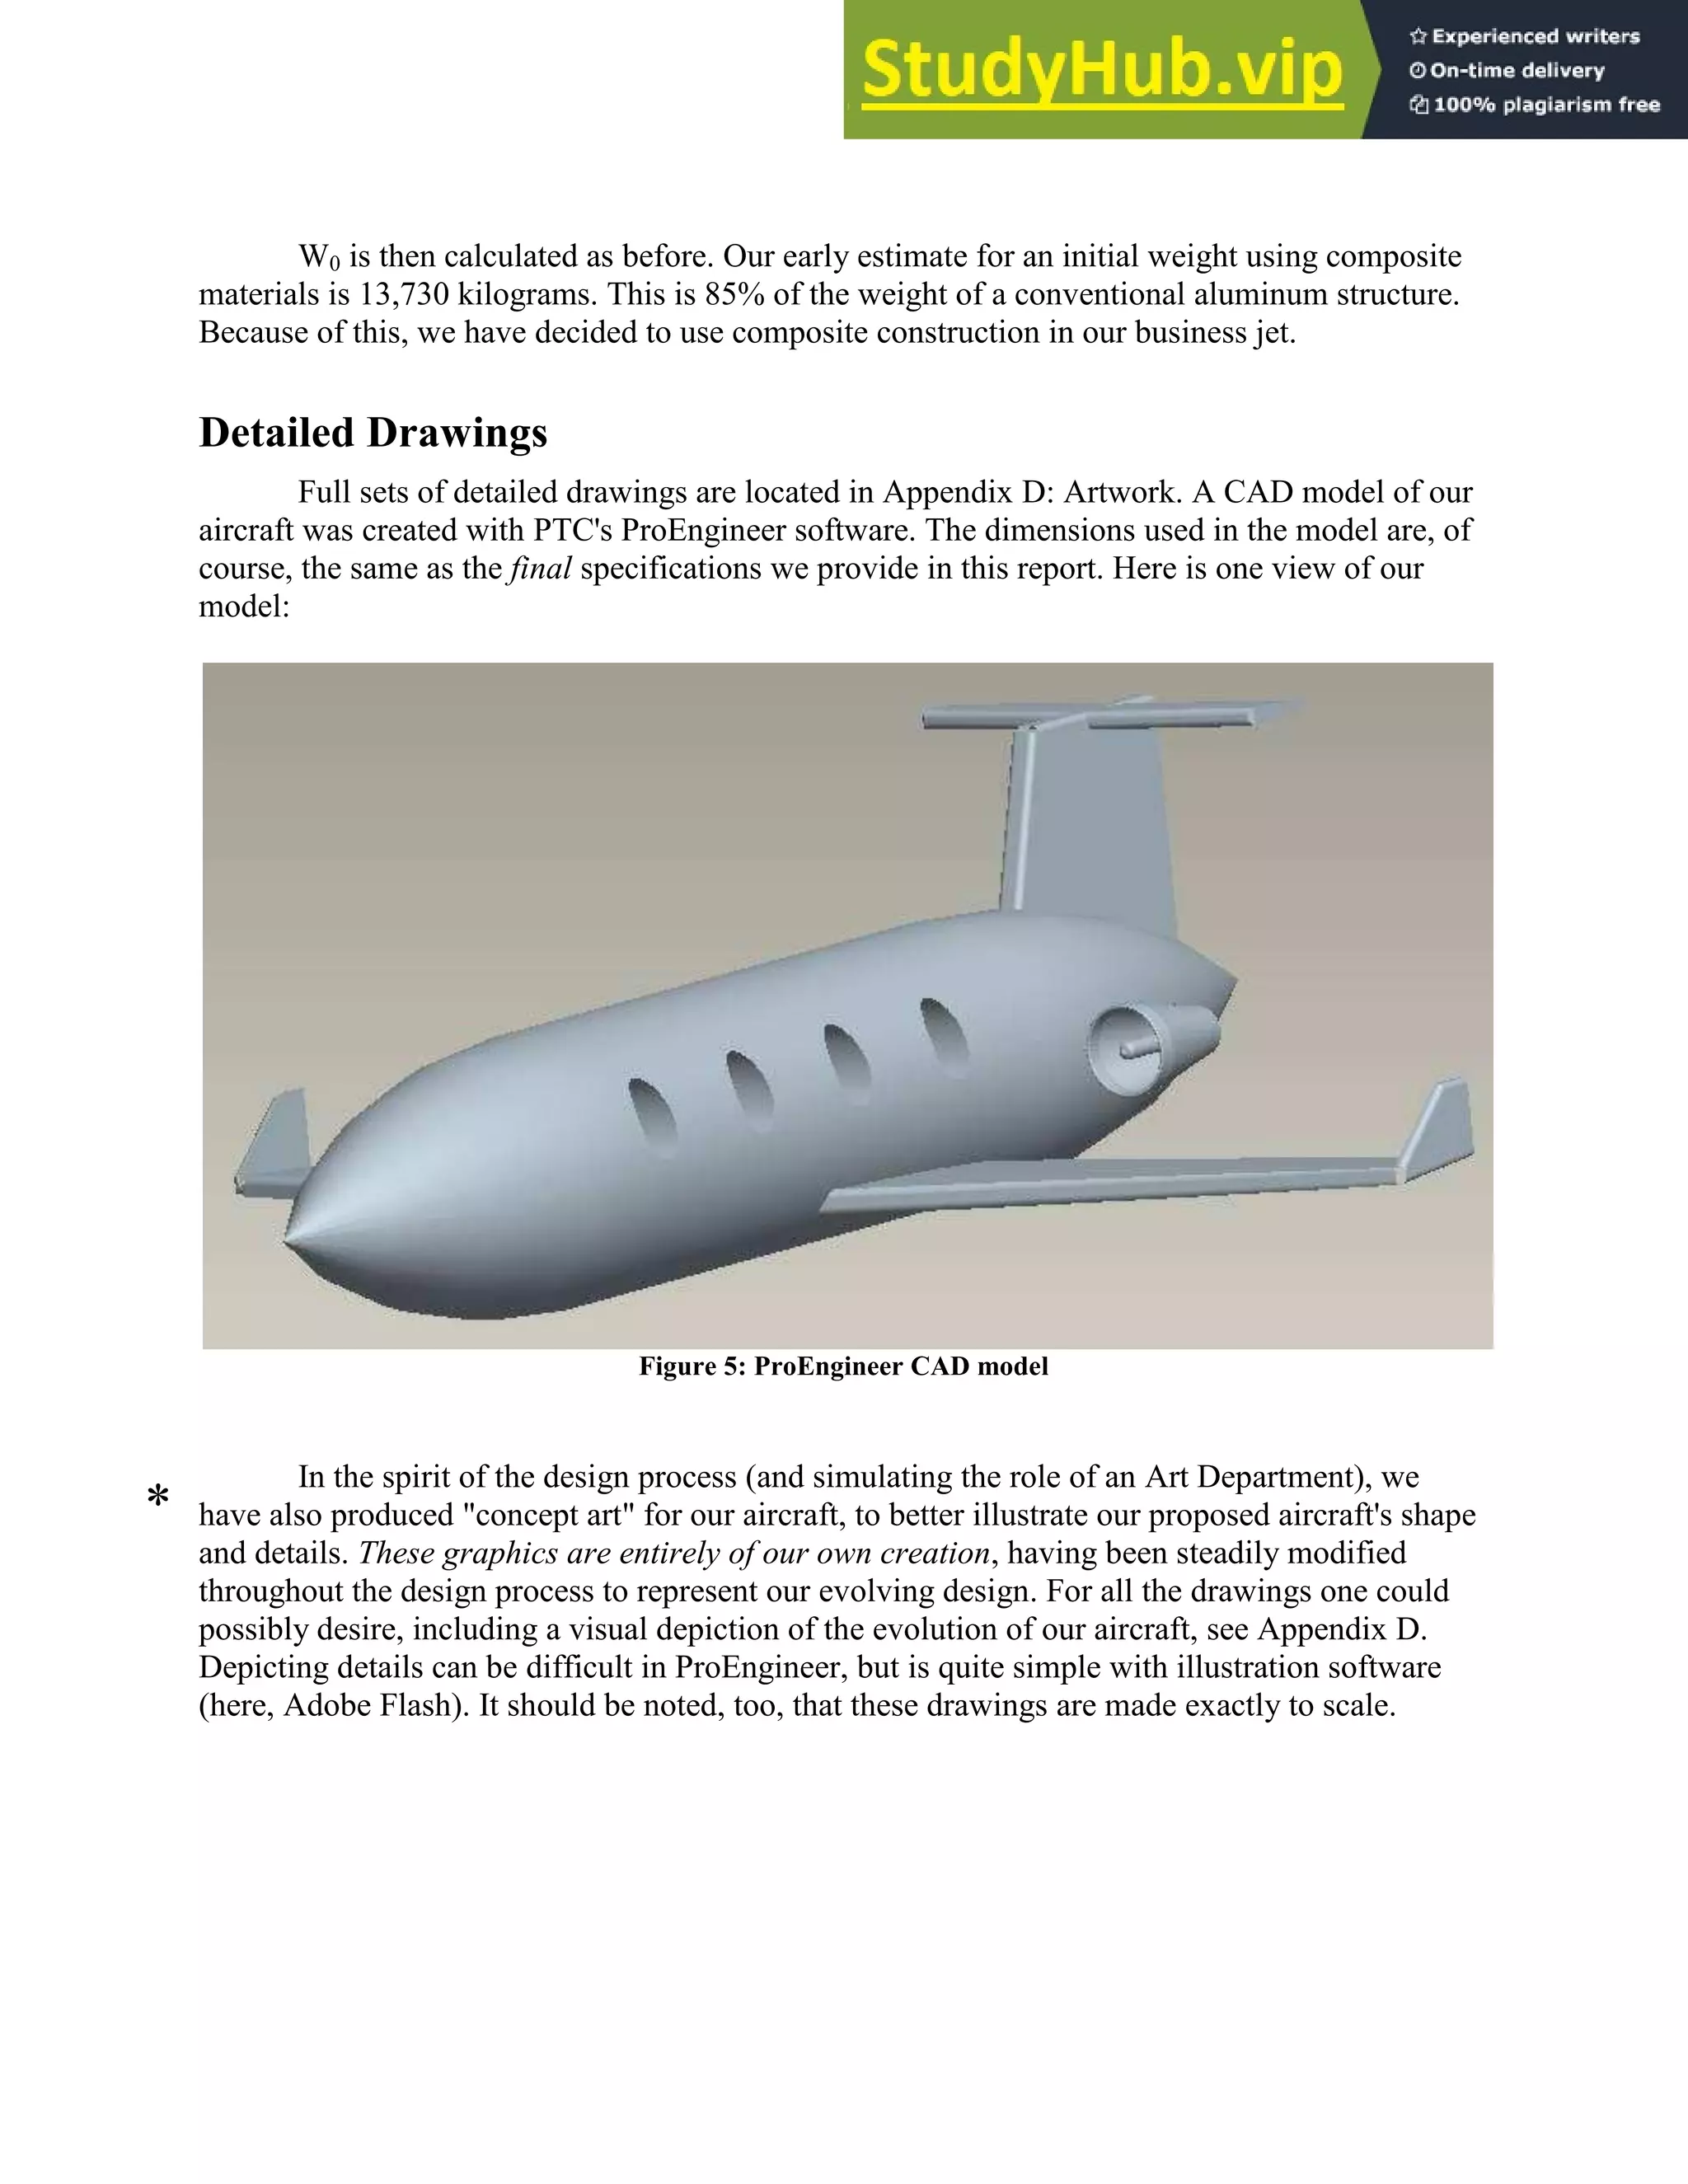
The total weight for the above components is 14535 kg, very close to our W0 estimate of 14543
kg. This yields a CG location of 9.58 m. Details are in Appendix I: Center of Gravity.
The simplest assessment of stability can be conducted:
Does ̅̅̅̅̅ ̅̅̅̅̅ ̅̅̅̅̅?
Our values satisfy this relation, and our aircraft is therefore stable in its pitch axis. A graphical
representation of the above relation is presented here (to avoid cluttering up our drawings
elsewhere):
Figure 25: Stability diagram
The distance between xnp and xmf is 1.06 m, or 37.8% of our aircraft's mean aerodynamic chord.
The static margin,
̅
works out to 0.253, which is greater than zero, again indicating a stable design.
Maneuvers
Climb
We used the following equations to determine our aircraft's climb characteristics:
Climb angle: [ ]
Climb rate: [ ]
Our aircraft's resulting climb angle is 3.54˚. This corresponds to a climb rate of 15.42 m/s
or 3030 fpm. At this climb rate, our aircraft reaches its cruising altitude of 45,000 ft in
approximately 15 minutes, assuming a takeoff at sea level.
Research performed by NASA indicates that winglets, as used on our aircraft, can
dramatically improve rate of climb. Below 5,000 ft, winglets can raise ROC by 6%, and above
*](https://image.slidesharecdn.com/aircraftdesignreport-230806184739-0cb0c8ea/75/Aircraft-Design-Report-34-2048.jpg)


This document summarizes the design of a small business jet capable of intercontinental travel. Key specifications include a range of 2,500 nautical miles, capacity for 8-10 passengers, and cruise speed and altitude of 485 knots and 45,000 feet respectively. The aircraft design was refined over multiple iterations, evaluating factors such as weight estimation, airfoil selection, wing geometry, stability, and performance. Design goals included high reliability, 24-hour readiness, and the ability to operate safely on one engine. Historical business jet data was also analyzed to ensure the design followed industry trends.


![Aerodinamica%20 general%201[1]](https://cdn.slidesharecdn.com/ss_thumbnails/aerodinamica20general2011-110624182406-phpapp01-thumbnail.jpg?width=640&height=640&fit=bounds)


![[Sapienza] Development of the Flight Dynamics Model of a Flying Wing Aircraft](https://cdn.slidesharecdn.com/ss_thumbnails/355a5afb-e186-4fcb-b8a5-c15a5650ca6a-160412194308-thumbnail.jpg?width=640&height=640&fit=bounds)


