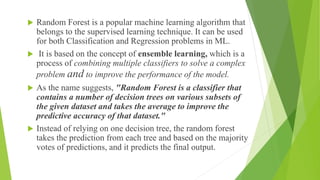
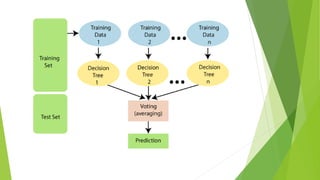
Nadar Saraswathi College
Of Arts and Science
ARTIFICIAL INTELLIGENCE
Regression model and
Random forest
S.Sameena Fathima
II M.Sc.Cs
 Regression analysis is a statistical method to model the
relationship between a dependent (target) and
independent (predictor) variables with one or more
independent variables.
 More specifically, Regression analysis helps us to
understand how the value of the dependent variable is
changing corresponding to an independent variable
when other independent variables are held fixed.
 It predicts continuous/real values such as temperature,
age, salary, price, etc.
Example: Suppose there is a marketing company A, who does
various advertisement every year and get sales on that. The below
list shows the advertisement made by the company
in the last 5 years and the corresponding sales:
 Now, the company wants to do the advertisement of $200 in
the year 2019 and wants to know the prediction about the
sales for this year. So to solve such type of prediction
problems in machine learning, we need regression analysis.
 Regression is a supervised learning technique which helps in
finding the correlation between variables and enables us to
predict the continuous output variable based on the one or
more predictor variables.
 It is mainly used for prediction, forecasting, time series
modeling, and determining the causal-effect relationship
between variables.
 In Regression, we plot a graph between the variables
which best fits the given datapoints, using this plot, the
machine learning model can make predictions about the
data.
 In simple words, "Regression shows a line or curve
that passes through all the datapoints on target-
predictor graph in such a way that the vertical distance
between the datapoints and the regression line is
minimum."
 The distance between datapoints and line tells whether a
model has captured a strong relationship or not.
 Some examples of regression can be as:
 Prediction of rain using temperature and other factors
 Determining Market trends
 Prediction of road accidents due to rash driving.
Terminologies Related to the Regression Analysis:
 Dependent Variable: The main factor in Regression
analysis which we want to predict or understand is
called the dependent variable. It is also called target
variable.
 Independent Variable: The factors which affect the
dependent variables or which are used to predict the
values of the dependent variables are called independent
variable, also called as a predictor.
 Outliers: Outlier is an observation which contains
either very low value or very high value in comparison
to other observed values. An outlier may hamper the
result, so it should be avoided.
 Multicollinearity: If the independent variables are highly
correlated with each other than other variables, then such
condition is called Multicollinearity. It should not be present
in the dataset, because it creates problem while ranking the
most affecting variable.
 Underfitting and Overfitting: If our algorithm works well
with the training dataset but not well with test dataset, then
such problem is called Overfitting. And if our algorithm
does not perform well even with training dataset, then such
problem is called underfitting.
 Random Forest is a popular machine learning algorithm that
belongs to the supervised learning technique. It can be used
for both Classification and Regression problems in ML.
 It is based on the concept of ensemble learning, which is a
process of combining multiple classifiers to solve a complex
problem and to improve the performance of the model.
 As the name suggests, "Random Forest is a classifier that
contains a number of decision trees on various subsets of
the given dataset and takes the average to improve the
predictive accuracy of that dataset."
 Instead of relying on one decision tree, the random forest
takes the prediction from each tree and based on the majority
votes of predictions, and it predicts the final output.
Random Forest works in two-phase first is to create the
random forest by combining N decision tree, and second is to
make predictions for each tree created in the first phase.
The Working process can be explained in the below steps and
diagram:
Step-1: Select random K data points from the training set.
Step-2: Build the decision trees associated with the selected
data points (Subsets).
Step-3: Choose the number N for decision trees that you
want to build.
Step-4: Repeat Step 1 & 2.
Step-5: For new data points, find the predictions of each
decision tree, and assign the new data points to the category
that wins the majority votes.

ai.pptx

  • 1.
    Nadar Saraswathi College OfArts and Science ARTIFICIAL INTELLIGENCE Regression model and Random forest S.Sameena Fathima II M.Sc.Cs
  • 2.
     Regression analysisis a statistical method to model the relationship between a dependent (target) and independent (predictor) variables with one or more independent variables.  More specifically, Regression analysis helps us to understand how the value of the dependent variable is changing corresponding to an independent variable when other independent variables are held fixed.  It predicts continuous/real values such as temperature, age, salary, price, etc.
  • 3.
    Example: Suppose thereis a marketing company A, who does various advertisement every year and get sales on that. The below list shows the advertisement made by the company in the last 5 years and the corresponding sales:
  • 4.
     Now, thecompany wants to do the advertisement of $200 in the year 2019 and wants to know the prediction about the sales for this year. So to solve such type of prediction problems in machine learning, we need regression analysis.  Regression is a supervised learning technique which helps in finding the correlation between variables and enables us to predict the continuous output variable based on the one or more predictor variables.  It is mainly used for prediction, forecasting, time series modeling, and determining the causal-effect relationship between variables.
  • 5.
     In Regression,we plot a graph between the variables which best fits the given datapoints, using this plot, the machine learning model can make predictions about the data.  In simple words, "Regression shows a line or curve that passes through all the datapoints on target- predictor graph in such a way that the vertical distance between the datapoints and the regression line is minimum."  The distance between datapoints and line tells whether a model has captured a strong relationship or not.
  • 6.
     Some examplesof regression can be as:  Prediction of rain using temperature and other factors  Determining Market trends  Prediction of road accidents due to rash driving.
  • 7.
    Terminologies Related tothe Regression Analysis:  Dependent Variable: The main factor in Regression analysis which we want to predict or understand is called the dependent variable. It is also called target variable.  Independent Variable: The factors which affect the dependent variables or which are used to predict the values of the dependent variables are called independent variable, also called as a predictor.  Outliers: Outlier is an observation which contains either very low value or very high value in comparison to other observed values. An outlier may hamper the result, so it should be avoided.
  • 8.
     Multicollinearity: Ifthe independent variables are highly correlated with each other than other variables, then such condition is called Multicollinearity. It should not be present in the dataset, because it creates problem while ranking the most affecting variable.  Underfitting and Overfitting: If our algorithm works well with the training dataset but not well with test dataset, then such problem is called Overfitting. And if our algorithm does not perform well even with training dataset, then such problem is called underfitting.
  • 9.
     Random Forestis a popular machine learning algorithm that belongs to the supervised learning technique. It can be used for both Classification and Regression problems in ML.  It is based on the concept of ensemble learning, which is a process of combining multiple classifiers to solve a complex problem and to improve the performance of the model.  As the name suggests, "Random Forest is a classifier that contains a number of decision trees on various subsets of the given dataset and takes the average to improve the predictive accuracy of that dataset."  Instead of relying on one decision tree, the random forest takes the prediction from each tree and based on the majority votes of predictions, and it predicts the final output.
  • 11.
    Random Forest worksin two-phase first is to create the random forest by combining N decision tree, and second is to make predictions for each tree created in the first phase. The Working process can be explained in the below steps and diagram: Step-1: Select random K data points from the training set. Step-2: Build the decision trees associated with the selected data points (Subsets). Step-3: Choose the number N for decision trees that you want to build. Step-4: Repeat Step 1 & 2. Step-5: For new data points, find the predictions of each decision tree, and assign the new data points to the category that wins the majority votes.