Download to read offline
![suitable targets for 2030, with the
proposed goal of ‘leaving no-one behind’
and eliminating (extreme) poverty. The
international community, including
organisations such as the World Bank,
appear to be coalescing around an
ambitious goal to bring extreme poverty
to below 3% and boost incomes for the
bottom 40% of the population in every
country by 2030 (emphasis added).4
Parallel to the post-2015 MDG process,
the African Union (AU) launched its
Agenda 2063 in 2013 as a ‘call for action
to all segments of African society to work
together to build a prosperous and united
Africa’.5 Agenda 2063 purposefully looks
much further ahead, to a date 100 years
from the establishment of the Organization
of African Unity (OAU) in 1963. In doing
so, the AU (the successor to the OAU)
admits that ‘[f]ifty years is, undoubtedly,
IN 1990 THE INTERNATIONAL
community agreed to halve the rate of
extreme poverty by 2015. Specifically,
target 1.A in the Millennium Development
Goals (MDGs) called for cutting in half
‘the proportion of people whose income
is less than [US]$1,25 a day’1 – the
widely recognised definition of ‘extreme’
poverty. This target was met in 2010, five
years ahead of the deadline, largely (but
not exclusively) through the remarkable
progress made in China.2 Although
700 million fewer people lived in extreme
poverty, the UN estimated that 1,2 billion
people still lived on less than US$1,25
a day in 2013, although more recent
recalculations could see that figure
reduced by about one-quarter.3
As part of the process leading up to
the finalisation of the post-2015 MDGs,
attention has now turned to defining
an extremely long development planning
horizon’6 and notes that it will be rolling
out plans for 10 and 25 years, and
include various short-term action plans.
After the scheduled adoption of the
specifics of Agenda 2063 at the mid-year
AU Summit in June 2014, the first
10-year implementation plan is scheduled
for approval in January 2015 and will
be accompanied by a comprehensive
monitoring and evaluation framework.7
In many senses Agenda 2063 is rooted in
a different development philosophy than
that of the MDGs, finding its inspiration
in the Lagos Plan of Action, the Abuja
Treaty and the New Partnership for
Africa’s Development (NEPAD). It reflects
an ambitious effort by Africans to accept
greater ownership and chart a new
direction for the future that has inclusive
growth and the elimination of extreme
Summary
The eradication of extreme poverty is a key component of the post-2015
MDG process and the African Union’s Agenda 2063. This paper uses the
International Futures forecasting system to explore this goal and finds that
many African states are unlikely to make this target by 2030. In addition to
the use of country-level targets, this paper argues in favour of a goal that
would see Africa as a whole reducing extreme poverty to below 20% by 2030
(15% using 2011 purchasing power parity), and to below 3% by 2063.
AFRICAN FUTURES PAPER 10 | AUGUST 2014
Reducing poverty in Africa
Realistic targets for the post-2015 MDGs
and Agenda 2063
Sara Turner, Jakkie Cilliers and Barry Hughes](https://image.slidesharecdn.com/afp10reducingpoverty-140908051515-phpapp01/85/REDUCING-POVERTY-IN-AFRICA-REALISTIC-TARGETS-FOR-THE-POST-2015-MDG-s-AND-AGENDA-2063-AFRICAN-FUTURES-1-320.jpg)


![16 REDUCING POVERTY IN AFRICA: REALISTIC TARGETS FOR THE POST-2015 MDGS AND AGENDA 2063
AFRICAN FUTURES PAPER
population remain in extreme poverty up
to 2063, while in Burundi nearly 25% of
the population remain in extreme poverty.
Under our interventions, both Burundi and
the DRC see significant improvements
in progress against extreme poverty,
which allows the DRC to achieve a 3%
poverty target by the early 2050s (Figure
8). Although Burundi doesn’t quite make
the target, it gets close as well. Both
countries derive most of these gains from
economic growth, but in the DRC, social
assistance and human development
provide additional strong sources of gain.
Madagascar, whose poverty rate is high
and forecast to remain so through 2064,
is only able to achieve slight declines in
the percentage of the population living in
extreme poverty.
What drives these differences?
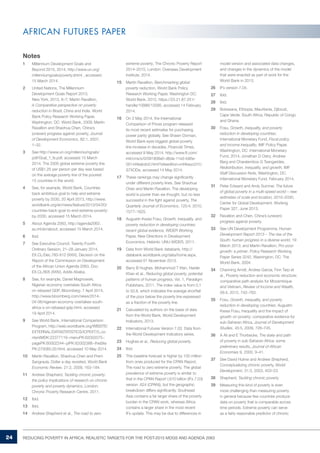
Table 5 represents some of the factors
that drive the speed and depth of
poverty reduction and helps explain
why some countries make significant
progress against poverty in our base
case and are more responsive to poverty
reduction efforts. This is not a complete
listing, and other factors may also have
significant impacts. Understanding
how these interact on a country basis
is key to setting appropriate targets for
future poverty reduction and deducing
the plausible impact of efforts to speed
poverty reduction.
When looking at the first group of
countries (those with high headcounts
and relatively low poverty rates),
Ethiopia’s progress in both the base
case and the combined scenario is partly
the product of its relatively high rate of
expected economic growth, relatively low
level of inequality, smaller poverty gap,
and relatively low population growth rate.
In Kenya and Nigeria, initial inequality is
higher and expected economic growth
is lower. However, in our interventions,
Kenya derives the greatest reductions
in Gini and the greatest boost to its
GDP growth rate (the compound annual
growth rate [CAGR] is 6,1% up to
2063, while it increases less than 0,75
percentage points relative to the base
case for Nigeria and Ethiopia to 6,0%
and 7,3% respectively).
Considering the second group of
countries, we find that they have
Policies need to be tailored to the unique
circumstances of each country
Table 5: Factors driving poverty reduction progress
GDP
growth rate
2013–2063
(CAGR)
Population
growth rate
2013–2063
(CAGR)
Initial
Gini index
(2013)
Initial
poverty gap
(2013)
Ethiopia 6,58 1,91 0,35 7,6
Kenya 5,01 1,7 0,48 17,18
Nigeria 5,26 1,88 0,5 30,5
Burundi 5,42 2,15 0,35 35,2
DRC 6,33 2,03 0,44 43,43
Madagascar 1,8 2,16 0,43 44,79
Source: International Futures version 7,05; authors’ calculations
BURUNDI, THE DRC AND
MADAGASCAR HAVE SOME OF
THE LARGEST NUMBERS OF
PEOPLE LIVING IN POVERTY
IN AFRICA ACROSS OUR
FORECAST HORIZON](https://image.slidesharecdn.com/afp10reducingpoverty-140908051515-phpapp01/85/REDUCING-POVERTY-IN-AFRICA-REALISTIC-TARGETS-FOR-THE-POST-2015-MDG-s-AND-AGENDA-2063-AFRICAN-FUTURES-16-320.jpg)


This document discusses targets for reducing extreme poverty in Africa by 2030 as part of the post-2015 MDG process and the African Union's Agenda 2063. It uses the International Futures forecasting system to analyze prospects for poverty reduction in Africa up to 2063. The analysis finds that many African states are unlikely to achieve the target of reducing extreme poverty (income below $1.25 per day) to below 3% by 2030 based on current trends. As an alternative, the document argues for targets of reducing extreme poverty in Africa to below 20% by 2030, below 10% by 2045, and below 3% by 2063. It also recommends setting additional country-level targets given differences between countries.


