SlideShare a Scribd company logo
1 of 51
Download to read offline
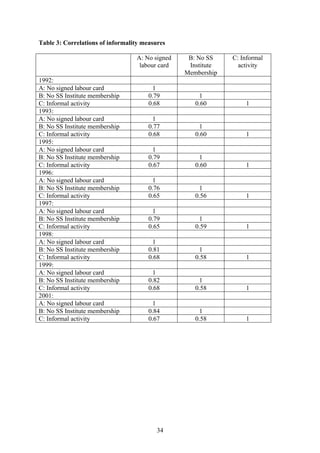
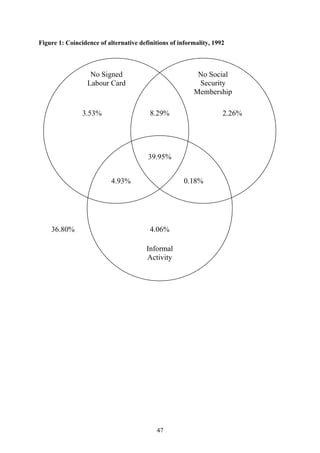
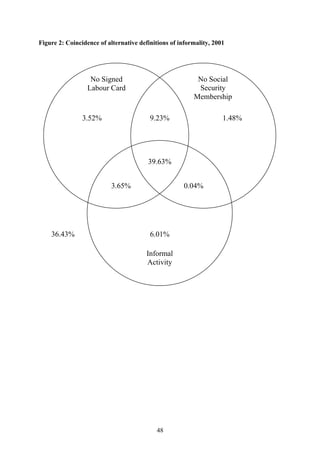
IZA DP No. 2473 
On Defining and Measuring the Informal Sector 
Andrew Henley 
G. Reza Arabsheibani 
Francisco G. Carneiro 
D I S C U S S I O N P A P E R S E R I E S 
Forschungsinstitut 
zur Zukunft der Arbeit 
Institute for the Study 
of Labor 
November 2006
On Defining and Measuring the 
Informal Sector 
Andrew Henley 
University of Wales Swansea 
G. Reza Arabsheibani 
University of Wales Swansea, 
WELMERC and IZA Bonn 
Francisco G. Carneiro 
World Bank and Universidade Catolica de Brasilia 
Discussion Paper No. 2473 
November 2006 
IZA 
P.O. Box 7240 
53072 Bonn 
Germany 
Phone: +49-228-3894-0 
Fax: +49-228-3894-180 
E-mail: iza@iza.org 
Any opinions expressed here are those of the author(s) and not those of the institute. Research 
disseminated by IZA may include views on policy, but the institute itself takes no institutional policy 
positions. 
The Institute for the Study of Labor (IZA) in Bonn is a local and virtual international research center 
and a place of communication between science, politics and business. IZA is an independent nonprofit 
company supported by Deutsche Post World Net. The center is associated with the University of Bonn 
and offers a stimulating research environment through its research networks, research support, and 
visitors and doctoral programs. IZA engages in (i) original and internationally competitive research in 
all fields of labor economics, (ii) development of policy concepts, and (iii) dissemination of research 
results and concepts to the interested public. 
IZA Discussion Papers often represent preliminary work and are circulated to encourage discussion. 
Citation of such a paper should account for its provisional character. A revised version may be 
available directly from the author.
IZA Discussion Paper No. 2473 
November 2006 
ABSTRACT 
On Defining and Measuring the Informal Sector* 
A range of alternative empirical definitions of informal activity have been employed in the 
literature. Choice of definition is often dictated by data availability. Different definitions may 
imply very different conceptual understandings of informality. This paper investigates the 
degree of congruence between three definitions of informality based on employment contract 
registration, on social security protection and the characteristics of the employer and 
employment using Brazilian household survey data for the period 1992 to 2001. 64% of the 
economically active are informal according to at least one definition, but only 40% are 
informal according to all three. Steady compositional changes have been taking place 
amongst informal workers, conditional on definition. Econometric analysis reveals that the 
conditional impact of particular factors (demographic, educational attainment, family 
circumstances) on the likelihood of informality varies considerably from one definition to 
another. Results suggest growing heterogeneity within the informal sector. Informal activity 
may be as much associated with entrepreneurial dynamism as with any desire to avoid costly 
contract registration and social protection. However there is no a priori reason for 
entrepreneurial activity to be unprotected. Results in the paper confirm this. Consequently 
definitions of informality based on occupation and employer size seem the most arbitrary in 
practice even if conceptually well-founded. 
JEL Classification: J21, J42 
Keywords: informal employment, social protection, self-employment, entrepreneurship 
Corresponding author: 
G. Reza Arabsheibani 
School of Business and Economics 
University of Wales Swansea 
Singleton Park 
Swansea SA2 8PP 
United Kingdom 
E-mail: g.arabsheibani@swansea.ac.uk 
* The findings, interpretations, and conclusions in this paper are entirely those of the authors only. 
They do not necessarily represent the view of the World Bank, its Executive Directors, or the countries 
they represent.
On Defining and Measuring the Informal Sector 
1. Introduction 
The growth and scale of informal employment in many developing countries has been 
traditionally attributed to the displacement of workers into insecure forms of labour market 
attachment as the only feasible alternative to unemployment (Fields, 1975; Mazumdar, 1976). 
More recently a number of authors (Pradhan and van Soest, 1995, 1997; Cohen and House, 
1996; Marcoullier et al., 1997; Maloney, 1999; Saavedra and Chong, 1999; Gong and van 
Soest, 2002) question this interpretation of informality, by calling into doubt the idea that the 
existence of informal and formal sectors is a manifestation of “dualism” in the labour 
market.1 A further strand of research has highlighted the dynamic “micro-entrepreneurial” 
nature of informal economic activity (Cunningham and Maloney, 2001; Maloney, 2004; 
Pisani and Pagan, 2004). This view of informality is well-established and can be traced back 
to the work of Hart (1972). A final view (and one which we do not address in the present 
paper) concerns the relationship between informality and illegal or tax-evading activity (see 
Gerxhani, 2004, and Loayza et al., 2005).2 Each of these alternative views shares in common 
the idea that informal activity may be freely chosen by some workers. These individuals 
either perceive state social protection to be poor “value for money” or do not wish to have the 
conditions of their employment relationship (such as hours of work) restricted by tight state 
labour market regulation. Alternatively, they may be attracted by the prospective job 
satisfaction or income stream associated with a successful transition into entrepreneurship, or 
may perceive the relative benefits of illegal or unregistered activity to outweigh the risks of 
detection. 
1
The size of the informal sector is of particular interest to economic policy makers 
concerned to promote the development of a micro-entrepreneurial sector. This concern arises 
because of its perceived contribution to dynamic economic efficiency, possibly as a response 
to growing competitive pressures brought about by trade liberalization. On the other hand 
policy makers may be concerned that significant numbers, perhaps even a majority of 
workers in developing countries have little or no social security provision. This means that 
they have little on which to fall back in the event of illness, unemployment or old age, 
beyond personal wealth and extended family support. A narrower but nevertheless important 
concern may be to reduce informality in order to widen the base of direct taxation. 
This discussion of alternative perspectives on informality brings into sharp focus the 
question of the most appropriate way to define and measure the informal sector. This is a 
question which has attracted little or no detailed attention in the literature. The purpose of the 
present paper is to attempt to redress this. This lack of attention may arise from the paucity of 
data on a sector which by its nature is problematic to define. Thus, researchers tend to fall 
back on the pragmatic and judicial use of data on employment status and sectoral affiliation. 
There is little discussion of the sensitivity of any conclusions drawn to issues of measurement 
and definition. An implicit assumption is that international comparisons of the scale of 
informality, which may be based on very different empirical definitions, are valid. Over the 
last 20 years or so the growing availability of household and living standards surveys has 
improved the evidence base for many developing economies. However, such surveys are 
typically not sufficiently rich to permit an evaluation of alternative definitions of informality. 
Household survey data available for Brazil (the Pesquisa Nacional por Amostra de 
Domicílios - PNAD) is a notable exception to this. Large scale annual household surveys 
2
contain detailed information on individual household member economic status. They permit 
some comparison of alternative informality definitions. Firstly, individual informality can be 
examined at the level of employer compliance with state labour market regulation through the 
possession of a registered labour contract (signed labour card). Secondly, informality can be 
examined at the level of individual social protection coverage, through membership of a 
social security institute. Finally, informality can be examined, as it is in many studies for 
which information on contract registration and social protection coverage is non-existent, by 
addressing the scale of micro-entrepreneurship activity. In practice, this means an 
examination of individual employment status (type of employment or self-employment) 
combined with information, if employed or an employer, on the sector and scale of the 
business activity. 
A comparative descriptive investigation of the sets of individuals defined as informal 
according to these different definitions reveals some substantial similarities, such as in 
demographic and educational status. However, a multivariate (probit) analysis reveals that 
some characteristics are more strongly associated with one measure of informality than 
another. For example, educational attainment is far more strongly associated with social 
security institute membership, and with informality defined according to employment status 
and activity than it is with the measure of informality based on compliance with labour 
regulation. On the other hand, social security institute membership appears to be less strongly 
associated with the demographic and informal status of others within the household. 
So the main conclusion to be drawn from this research is that the precise definition of 
informality does matter. It cannot be assumed that alternative definitions are broadly 
consistent, and that the conclusions drawn from any detailed analysis or modeling of 
3
informality will be robust to definitional choice. This is particularly important given recent 
developments in the debate on the subject. Any particular choice of definition or 
measurement may be conditioned by a priori perspectives or hypotheses about the nature and 
role of the informal sector. 
The remainder of the paper is structured as follows. Section 2 provides a more 
detailed discussion of the existing literature and in particular on the way in which informality 
has been defined and measured. Section 3 discusses the Brazilian data source used and the 
different measures of informality which are analyzed. Section 4 provides some descriptive 
analysis and discussion of these measures. Section 5 documents a multivariate analysis to 
investigate commonalities and differences in the way in which the different indicators of 
informality are associated with demographic, employment and household characteristics. 
Section 6 provides a concluding discussion. 
2. Defining Informality 
The practice of defining informality in terms of the economic status of the individual 
(self-employed or own-account worker, domestic worker, small scale employer etc.) in 
conjunction with the characteristics of the employer (small scale, no collective bargaining 
etc.) is well-established in the literature. A substantial number of early analyses of 
informality simply assume that the informal sector corresponds to sole-traders (own account 
workers) and those in small or micro enterprises. “Small” or “micro” is defined arbitrarily 
and may depend on questionnaire design. For example, from recent research which makes 
use of such a definition of informality, Prahan and van Soest (1995, 1997) and Maloney 
(1999) use a definition of fewer than six employees for Bolivia and Mexico respectively; 
4
Funkhouser (1996) uses fewer than five employees for an analysis of five Central American 
economies; Marcoullier et al. (1997) use fewer than six for Mexico and Peru; Cohen and 
House (1996) use fewer than 20 for Sudan; Livingstone (1991) uses fewer than ten for 
Kenya. Galli and Kucera (2004) undertake an international comparative study across 14 
Latin America countries. They employ a definition adopted by the ILO based on employees 
in firms of either fewer than 5 or 10 employees (depending on the country). Comparability is 
compromised because of limited detailed information on the size distribution of firms. 
Where authors have been particularly concerned to highlight the role of informality in 
promoting entrepreneurship this definitional approach has been explicitly preferred over 
alternatives. However the attractiveness of defining informality as equivalent to the 
“entrepreneurial” sector side-steps the important conceptual question of how large does an 
establishment have to become for it to cease to be part of the dynamic, entrepreneurial sector. 
Some authors have introduced a further distinction into the definition of the informal sector 
by including some industrial activities and excluding others (most notably professional 
service activities). A shortcoming of this approach is that it excludes the possibility, even if it 
is an unlikely one, that some employees in small establishments may have contracts of 
employment which conform to labour market regulations and may contribute to social 
insurance schemes. It also excludes the possibility that some large private sector employers 
may not provide registered employment contracts or encourage employee contributions to 
social insurance schemes. Similar objections might apply to domestic and temporary workers 
who are often entirely classified as informal. 
The economic significance attached to whether an employment relationship conforms 
to state labour contracting regulations depends on the degree to which those regulations 
5
impart inflexibility in the extent to which both parties can tailor the terms and conditions of 
employment to their best advantage. So, for example, if regulations permit flexible hours of 
work with no effective upper constraint then the economic impact of signing a formal 
contract compared to working informally may be less, and the rationality for participating in 
the informal sector reduced. The existence of significant lay-off costs if a formal contract is 
terminated may be one of the main factors pushing employers towards offering informal 
employment (see World Bank, 2002 on the case of Brazil). 
The argument that both employees and employers may prefer to enter into either 
unregistered or registered employment relationships will hinge on the balance of the 
advantages and disadvantages. This is the central argument behind recent work (such as 
Maloney 2004) which rejects the traditional view that the informal sector is a labour market 
segment populated by displaced workers queuing for good jobs in the rationed formal sector. 
Perhaps the most persuasive evidence in support of this is in Maloney (1999). He uses 
Mexican panel data to examine between-sector and within-sector transitions. The definition 
of informality used in this research is based on establishment size rather than contract status. 
However, no evidence is found to support the proposition that those newly entering informal 
employment are more likely to be young, displaced workers waiting for better jobs. So 
contract status should provide a good discriminator for informal status if the allocation of 
workers to the informal sector is governed by a free assessment of the costs and benefits of 
labour contract registration. Informality should therefore be defined not according to the 
nature of the job or the employer but according to the worker’s legal status. But in practice 
the informal sector may exist for a complicated mix of reasons. Some workers may choose to 
be there because jobs are more flexible or because self-employment is more attractive 
whereas others may be displaced involuntarily into the sector. 
6
The practical problem with defining informality in terms of illegal employment is that 
data may simply not exist on contract status. This is particularly so if the employee does not 
know for certain whether the employer is conforming to employment regulations, something 
that might be more likely in the case of temporary workers. For the self-employed or for 
own-account agricultural workers such a definition may have no relevance since an own-account 
worker cannot contract with themselves. In some countries, of which Brazil is a 
notable example, employers are required to indicate to workers that the employment 
relationship is legally registered. So a third party such as a statistical agency can establish this 
with a reasonable degree of accuracy. It therefore follows that the informal sector in Brazil 
has attracted particular attention from researchers. 
Where information on contract status is not available or relevant, the principal 
alternative definition of informality is one defined by social protection status. The paper that 
is widely regarded as the seminal empirical study of the informal sector (Merrick, 1976) 
employs this definition. Merrick’s study is of the urban labour market of Belo Horizonte in 
central eastern Brazil. For employed workers informality is defined by the lack of 
membership of a social security institute. Subsequent work which has adopted the criterion of 
no social protection or non-payment of social security taxes for distinguishing informal 
employees includes Portes et al. (1986), Marcouiller et al. (1997), Maloney (1999) and 
Saavedra and Chong (1999). Absence of social protection is regarded as an important 
indicator of informality, focusing attention on the potential costs of informality to employees 
in the event of adverse economic circumstances. The consequences of informality so defined 
may depend on the economic position of the individual within the household: that is whether 
they are the main or secondary earner. It may also depend on the social protection status of 
7
other household members. This definition also focuses attention on the inefficiency of social 
protection systems as a possible driver of the growth in informality. However, typical 
household or individual surveys used to investigate informality may not provide information 
on the social security status of the self-employed or small employers. So studies often rely on 
a “hybrid” definition of informality in which employees are classified according to social 
security status. Own-account workers are classified as entirely informal and employers are 
classified according to either the size of their business (number of employees), the activity of 
the business, or both. 
A small number of previous studies have investigated the sensitivity of measured rates 
of informality to choice of definition. Marcouiller et al. (1997) compare the size of the 
informal sectors in El Salvador, Peru and Mexico using definitions based on firm-size3 and 
on non-payment of social security taxes. The latter definition produces a considerably higher 
estimate of the size of the informal sector (43.2% compared to 30.8% of workers in the case 
of Mexico in 1990). However, depending on country, between 89 and 97% of the self-employed 
and small-firm employees do not pay social security taxes. This definition is 
preferred for the econometric analysis of the wage differential between the two sectors 
because it is more comprehensive. Saavedra and Chong (1999) similarly find the informal 
sector to be larger when defined according to social security coverage rather than firm size 
(54.8% compared to 53.3% in Peru in 1995). Although this difference is not as great as in the 
Marcouiller et al. study, the two definitions in this case display substantially different trend 
and cyclical behaviour. The authors take the view that the social security definition is more 
useful because it shows informality falling with economic growth around a counter-cyclical 
movement. They use this definition in subsequent analysis of the earnings differential 
between the two sectors. 
8
A third more recent paper, Gong et al. (2000), examines the scale of informality in 
Mexico over the period 1992 to 1995 using various definitions. Defining informality 
according to job type (self-employed plus piece-rate workers) provides an estimate of 37.6% 
for the rate of informality. Defining informality according to firm size (less than six 
employees) provides an estimate of 30.4%. 89% of informal workers according to either 
definition have no social security coverage, whereas only 26.2% and 19.2% of those 
classified as formal under the job type and firm size definitions respectively had no social 
security coverage. In subsequent econometric work on sector transitions Gong and van Soest 
(2002) find that the job type definition is preferred.4 These findings tend to suggest that there 
is varying correspondence between alternative definitions of informality. It would therefore 
be surprising if econometric analyses modelling allocation between sectors or sector earnings 
differentials were robust to choice of definition. 
3. Measuring Informality in Brazil 
Many commentators express a belief that the informal sector in Brazil is large and 
growing, despite trade liberalization and successful macroeconomic stabilization over the last 
15 years. For example, Carneiro (1997) reports that, although in the late 1980s the Brazilian 
economy appeared to stagnate, unemployment rates remained low and total employment 
(formal and informal) continued expanding. In 1988, prior to trade liberalization and at a time 
of chronic price instability, the Brazilian statistical agency (IBGE) estimated that 13% of 
GDP was generated in the informal or unregistered economy. Within the service economy 
this proportion was estimated as high as 30%, suggesting that the overall estimate may well 
have been conservative (Carneiro, 1997). 
9
The achievement of macroeconomic stability in Brazil that followed the successful 
adoption of the Plano Real in 1994 might have removed some of the pressure for economic 
activity to migrate into the informal sector. On the other hand trade liberalization in the early 
1990s increased competitive pressures in the tradeable sectors of the economy. But recent 
research finds little or no relationship in Brazil between trade liberalization and informal 
employment, defined according to labour contract status (Goldberg and Pavcnik, 2003). 
Furthermore, constitutional reform in 1988 may have simultaneously decreased flexibility in 
the formal labour market (Barros and Corseuil, 2001). This implies that the emerging pattern 
of development in the informal sector may be complex. 
Regulation of the labour market in Brazil can be traced back to the enactment of the 
Labour Code of 1943. This mandates official registration of all contracts of employment 
through the requirement of employers to provide a signed labour card (“carteira de trabalho 
assinada”). The card contains a statement of the terms of employment to all employees. 
Registration of a labour contract confers a legal entitlement to a range of contract terms 
including a maximum working week (currently 44 hours), paid vacations, maternity leave, 
due notice of dismissal (proportional to seniority)5, a minimum overtime premium and an 
entitlement to compensation in the event of a non-justified dismissal. Dismissal compensation 
is paid from the Fundo de Garantia por Tempo de Serviço (FGTS) accumulated by every 
worker with a signed labour card. The employer contributes an amount equivalent to 8% of 
the employee’s current monthly wage. The employee receives a penalty of 40% of the 
employer’s cumulative contribution in the event of dismissal without just cause. This penalty 
was increased from 10% by the 1988 Constitution. As Barros and Corseuil (2001) note, the 
effect of the change was to reduce the length of tenure needed to accumulate a compensation 
10
amount equal to one month’s salary from at least 10 years to only two and a half years. At 
face value this would appear to amount to a substantial increase in employer firing costs, 
although in practice it creates the potential for collusion between employers and employees to 
register voluntary quits as dismissals. Thus, it creates an incentive to quit on the part of 
employees. Barros and Corseuil (2001) and Camargo (2002) cite evidence in support of this. 
In short there may be a strong disincentive for employers to register contracts, but, once 
registered, employers and employees face incentives which increase turnover. 
Social protection beyond dismissal compensation in Brazil is provided through 
individual employee membership of a social security institute (Instituto de Previdência). 
Protected workers pay monthly contributions on a graduated scale up to a ceiling of 11 per 
cent, with employers contributing a further 20% of payroll. Membership of an institute 
provides defined benefit pension provision (up to an upper ceiling), permanent disability 
benefits and life insurance (survivor) benefits. Workers without social security institute 
membership qualify for a meager flat rate old age pension equal to the minimum wage. 
Our investigation of informality draws on detailed information contained with the 
Brazilian household survey (PNAD). From 1992 the consistent questionnaire structure 
adopted by the survey allows separate identification of contract registration (labour card) and 
social protection across an individual’s main and supplementary jobs, alongside detailed 
information on the type of employment and the size and activity of the business. Surveys 
were conducted annually with the exception of 1994 (because of austerity associated with the 
introduction of the Plano Real) and 2000 (the year of the decennial census). 
11
Table 1 reports summary information on economic activity in main employment for 
all workers aged between 18 and 65 for each available year. All descriptive analysis makes 
use of individual sample weights provided by IBGE. In any year just over half of the 
economically active are engaged in paid employment. This proportion seems quite stable 
although there is some evidence of an upturn in the proportion towards the very end of the 
period. However, the proportion of public sector workers, who by definition have registered 
contracts, falls from 27.4% of employees in 1992 to 23.6% in 2001. 
The next largest group by economic activity are the self-employed (own-account 
workers), comprising almost of quarter of the economically active. A further four percent are 
entrepreneurs employing others. There is some slight evidence that employers as a proportion 
of the total have risen over the period, but no discernable trend in the proportion of the self-employed. 
A further 1.1% of the overall total, in 1992, are individuals whose main status is as 
an employee, but have self-employed or employer status in a second activity. This figure 
drops slightly to 0.95% in 2001. Thus in 1992 28.4% of economically active adults could be 
regarded as engaged in some broad form of entrepreneurial activity, either as main or 
secondary activity. This total remains virtually unchanged at 28.3% in 2001. So overall these 
data appear to offer little support for rising entrepreneurialism. 
The fastest growing group as a proportion of the total is domestic workers, rising from 
6.2% in 1992 to 7.8% in 2001. This is an employment group traditionally associated with 
informality, although as we shall see there should be no automatic presumption that domestic 
workers are unregistered and unprotected. Increasing employment of domestic staff may 
reflect rising standards of living in Brazil, particularly amongst upper and middle earners. 
The data allow the identification of three further categories of employment, each of which 
12
may be regarded as informal: non-remunerated employment (typically in a family business), 
subsistence agricultural workers and temporary workers. As a proportion of the total each if 
these is small. For each proportion there is some evidence of a downward trend. 
In order to assess the possible size of the informal sector we adopt three different 
definitions to distinguish formality and informality. 
A (contract status): a worker is defined as formal if they have a signed labour card in any 
employment. Through its questionnaire routing the PNAD regards all public sector 
employees as having signed labour cards. Those who are self-employed or employers in their 
main occupation are classified as formal if they have a signed labour card from another paid 
second job. 
B (social security status): a worker is defined as formal if they make contributions to a social 
security institute (federal, state or municipal) in respect of any employment. The PNAD asks 
all workers regardless of economic status or sector if they make social security contributions. 
C (formal activity): a worker is defined as formal if they are employed in an establishment of 
more than five employees. The self-employed and employers are defined as formal if their 
occupation is “creative and technical” or “administrative” (to capture “professional” 
activities). All domestic, non-remunerated, subsistence and temporary workers are defined as 
informal, along with all the self-employed and employers in occupations other than “creative 
and technical” and “administrative”. 
13
4. Variation in Informality in Brazil 
Table 2 details the proportions of workers classified as informal under each definition 
according to economic status. Definition A, based on contract status, provides the largest 
estimate of the size of informal employment, at between 56 and 58 per cent of all workers. 
The smallest estimate at around 50% is provided by definition C, in which workers are 
categorized according to establishment size and occupation. Definition B based on social 
security status provides an estimate of informal employment at just over 50%. There is no 
discernable trend in any of the three definitions. 
Once the data are sub-divided by economic status, wider variation between the 
definitions is apparent. Turning first to employees, definition C continues to provide the 
smallest estimate of informal employment at below 20%, but definition B (social security 
membership) now provides the largest estimate at between 24 and 28%. For all three 
definitions there is some evidence of an upward trend in informality. This is most pronounced 
for definition C, where informality rises from 12.8% in 1993 to 16.6% in 2001. 
For the self-employed only those whose main job is as a registered employee are 
recorded as formal under definition A, and only those who business activity falls under the 
two professional occupational categories are classified as formal under definition C. Informal 
self-employment activity under definition C is falling slightly. Informality declines from 
95.5% to 93.0% over the period. Under definition B (no social security protection) less than 
80% of the self-employed are informal in 1992. Here there is a clear upward trend. The 
proportion rises to over 84% by 2001. 
14
For employers only those few with registered main jobs are classified as formal under 
definition A. So rates of informality defined by lack of a signed labour card are very high. 
One third of employers have no social security protection in 1992. This proportion remains at 
the same level until 1997 when it starts to rise quickly. Under definition C very few 
employers are classified as informal. In fact up to 1993 the occupational classification defines 
all employers as “creative and technical” or “administrative”. From 1997 onwards the 
informal proportion starts to rise. 
The remaining four groups in Table 2 are all entirely classified as informal under 
definition C. A significant minority of domestic workers and, to a lesser extent, temporary 
workers have registered contracts and/or make social security payments. For both groups the 
proportions which are defined as informal are falling. The proportion of domestic workers 
with a no signed labour card falls from 79 percent in 1992 to 72 per cent in 2001, and those 
with no social security coverage from 77 percent to 69 percent. 
In summary Table 2 reveals some significant differences both between the different 
definitions we have constructed, and between the experiences of different types of workers. 
For employees the level of informality is stable, despite the relative decline of public sector 
employment. For entrepreneurial groups (the self-employed and employers) informality if 
defined by social security status is increasing. However, if informality is defined according to 
the nature of the activity, it is falling amongst the self-employed. Informality amongst 
domestic and temporary workers is also falling. 
The other feature in Table 2 is that there is incomplete overlap between the different 
definitions, and for some groups the overlap may be quite limited. In particular the definitions 
15
of informality based on contract and social security status (A and B) may distinguish very 
different groups of workers compared to the definition based on activity (definition C). Table 
3 reports pairwise correlation coefficients for the three measures. Definitions A and B have a 
correlation of around 0.8 suggesting a reasonably high, although far from complete, 
correspondence between the two measures. Definition C has a lower correlation with the 
other two measures, and particularly with social security status. Figures 1 and 2 explore this 
point further by providing Venn diagrams to show the correspondence of the three measures 
across the full sample of the economically active for 1992 and 2001. In both years just under 
40 percent of the sample can be defined as informal on all three definitions. Just over 36 
percent of the sample in both years can be classified as formal on all three definitions. A total 
of 13.4% of the sample in 1992 and 12.9% in 2001 can be classified as informal on any two 
of the three definitions. In particular there is a significant proportion of workers classified as 
informal on the basis of having no signed labour card and no social security coverage but 
who fall into the formal category under definition C. A total of 9.9% of the sample in 1992 
and 11.0% in 2001 fall into one of the definitions of informality but neither of the other two. 
The largest element of this group, particularly in 2001, is those who are classified as informal 
on the basis of activity but have a signed labour card and social protection. Domestic and 
temporary workers form a significant element of this group. 
Table 4 reveals the different position of men and women. Across all three definitions 
informality is increasing amongst men and falling amongst women. The upward trend for 
men is most pronounced for definition C, to the extent that by 2001 the estimate of male 
informality on the basis of activity is within 1.2 percentage points of the estimate on the basis 
of social security coverage. For women the decline in informality is steepest for definition B. 
There is very little trend in female informality defined by activity. Notice also that there is a 
16
difference in the orderings of the estimates for men and for women. Male informality is 
highest when defined by contract status (no signed labour card) and lowest when defined by 
activity. Female informality is highest when defined by contract status at the beginning of the 
period but by 2001 is highest when defined by activity. It is lowest when defined by social 
security status. So Brazil has enjoyed some success in improving social security participation 
amongst women, but the overall picture has been offset by the worsening position of men. 
There has been a change in the composition of informal activity towards men, partially offset 
by women moving into formal activity, as well as a shift in the composition of those without 
registered contracts towards men. This last shift has been to such an extent that, by 2001, men 
are more likely than women not to have a registered contract. 
A breakdown of rates of informality by ethnic group is given in Table 5. The majority 
of Brazilians describe themselves as being white or of mixed race. Over the period in 
question the ethnic composition of the economically active population is stable. Lowest rates 
of informality are observed for whites and Asians (Chinese and other East Asian 
nationalities). Highest rates of informality are amongst blacks, and particularly, amongst 
those of mixed race and those from the tiny indigenous population. The rate of informality is 
stable for whites according to definitions A and B but rises by 3 percentage points over the 
period for definition C. A similar picture emerges for the mixed race group – slight falls for 
definitions A and B, but a small rise for definition C. For blacks informality is falling for all 
three definitions, and most notably for definitions A and B. Amongst the small Asian group 
informality has risen very fast, particularly according to definition C. This may reflect high 
rates of nascent entrepreneurship amongst this group. 
17
Table 6 reveals that informality is very strongly associated with educational 
attainment. Rates of over 80% are observed for the illiterate. These fall to around a quarter 
for college graduates. Rates of informality are rising amongst the lower level groups 
(illiterate and elementary), but against a background of these groups falling fast as a 
proportion of the total active population. Informality is rising quickly amongst secondary 
school and college graduates on all three definitions. The reason why informality is rising for 
many educational sub-groups, although stable for the population as a whole, is because of the 
relatively stable level of informality amongst the illiterate and elementary groups who are 
declining rapidly as a proportion of the population. Absolute numbers of uneducated or 
poorly educated informal workers are falling fast in Brazil. This overall pattern is common to 
all three informality definitions. However, there are differences in the levels of informality 
for particular educational groups according to definition. Rates of informality amongst the 
illiterate are lower for definition C than for A and B. On the other hand rates of informality, 
defined by no signed labour card, are higher amongst secondary and college educated groups 
than for the other two definitions. It should be noted that informal exists across the 
educational spectrum, calling into question the segmentation hypothesis, which would imply 
that a higher level of education allows transition across the segmentation barrier between 
informality and formality. 
Rates of informality in establishments of different sizes according to each definition 
are given in Table 7. By definition those working in larger establishments (6 or more 
employees) are classified as formal according to definition C.6 Amongst sole-traders 
informality has risen significantly when defined by social security institute membership 
(mirroring the picture in Table 2), but is stable for the other two definitions. For those in very 
small establishments, that is two or 3 to 5 employees, informality has fallen slightly 
18
according to definition A but risen according to definition B and, in particular, definition C. 
Rates of informality defined by contract or social security status have also risen significantly 
in larger (11+ employee) establishments. These larger establishments employ almost 50% of 
the workforce. Informality is high amongst those who do not know their establishment size. 
Lack of information here may correlate with poor educational attainment. In summary Table 
7 suggests that informality is increasing in large establishments whereas (in terms of contract 
status) it is falling in the smallest establishments, and is stable in the middle (establishments 
with 6 to 10 employees). 
Table 8 describes rates of informality according to occupation. The occupational 
breakdown is a broad classification of eight sectors. Rates of informality vary considerably 
by occupational groups. Informality is high in agricultural, retailing and distribution 
occupations, and in domestic, personal and catering services groups. It is low in the creative 
and technical, administrative, and transport and communications groups. Alternative 
definitions of informality provide in some cases very different pictures of informality by 
occupational group. Since the self-employed in the creative and technical group are defined 
according to definition C as formal, then rates of informality according to this definition are 
very low. Yet it is apparent that numbers without signed labour cards or social security 
institute membership are much higher and rising over time. In retailing and distribution 
informality defined according to social security protection is significantly lower than 
according to the other two definitions. To a lesser extent the same holds for transport and 
communications occupations. In this sector informality is rising fast according to all three 
definitions. Informality as measured by definitions A and B is falling in domestic, personal 
and catering occupations. It is also falling in retailing and distribution. Both of these sectors 
are growing as a proportion of total employment. 
19
5. Multivariate analysis of factors associated with informality 
Although we have been able to point to differences and similarities between key 
demographic variables and different definitions of informality, we can say nothing so far 
about any conditional association between these. This section presents estimates of the 
marginal effects of different potential influences on the likelihood of informality obtained 
from probit regressions. The specification of each regression includes individual 
demographic information, information on the geographical situation of the individual, 
information on the nature of the employment and information on the economic status of the 
remainder of the individual’s family. Included under the heading of demographic information 
are a quadratic function of the individual’s age and a binary indicator for being female and 
indicators for ethnicity (reference category: white). Indicators of illiteracy and educational 
attainment are also included (reference category: education to elementary level).7 Two 
aspects of geographical situation are included. The first is a set of broad regional indicators, 
defined so that the heavily urbanised and industrialised region of the South East is the 
reference category. Given that some previous research identifies informality with 
urbanisation, the second is a binary indicator for residence in an urban location. The urban 
indicator is a variable derived by the IBGE statistical agency from household address records 
and corresponds to residence in cities, towns and so-called isolated urban areas. 
Three aspects of the nature of the individual’s employment are included. A binary 
indicator of unionisation is included to capture a likely association between collective 
representation and formality. It is important to uncover the extent to which definitions of 
informality based on contract and social security status identify individuals predominantly in 
20
small establishments. So information on the size of the establishment, in the form of a binary 
indicator for greater than 11 employees is included for regressions to explain definitions A 
and B. (Since definition C is partly based on establishment size it is not appropriate to include 
it as an explanatory factor.) Indicators of broad occupational grouping are included to assess 
the extent to which there may be certain occupational sectors in which employment tends 
inherently to be less formal. The reference occupation here is a residual category denoted 
“other”. It includes a range of occupations in the extractive and public (including defence) 
sectors. 
Turning to indicators of the economic status of the rest of the family, the first 
inclusion is a binary indicator for the informal status of the individual’s spouse conditional on 
being married and economically active. Spousal informality is defined throughout according 
to definition A for consistently and comparability. We hold no prior hypothesis here. Having 
a spouse without a registered contract may create a greater incentive to acquire the protection 
of a formal sector job. On the other hand informal workers may be simply more likely, as a 
result of a marriage matching process, to have informal sector spouses. For the same reasons 
the total number of formal employees in the family (i.e. with signed labour cards) is included, 
as well as the total number of self-employed in the family. The presence of dependents within 
the family may also influence individual employment decisions or options. So the totals of 
elderly (i.e. aged 65 and over) and children in the family are included. Finally other family 
earnings per head is included. This is an indicator of the extent to which the individual 
workers may rely on income generated elsewhere in the family as an alternative to social 
protection. 
21
Table 9 reports estimated marginal effects for each year for definition A (no signed 
labour card). Threshold levels of statistical significance are indicated – full results are 
available on request. In general most of the explanatory factors included in the regressions 
attract statistical significance although there is considerable variation in the importance of 
particular associations, as indicated by the size of the marginal effects. There is a U-shaped 
relationship between informality and age. The age at which an individual is most likely to 
have a signed labour card is in their late 20s, other things equal. Women are 5 percentage 
points less likely to be informal than men, other things equal. Indigenous and Asian ethnic 
groups appear more likely to be informal than whites, and blacks less so. However, those of 
mixed race (the largest non-white group) are no more or less likely than whites to be 
informal. Illiteracy is positively associated with informality, but only by 6 to 9 percentage 
points. The marginal effects for the various educational attainment levels do not suggest any 
qualitatively strong relationship between schooling and informal status. In particular college 
(first degree) graduates appear no less likely to have a signed labour card than those with only 
basic schooling, other things equal. 
The reported marginal effects for the four regions show that informality is higher 
outside the South East, and in particular in the North and the North East. However, these 
regional differences appear to be in decline. Urban residents are only slightly less likely to be 
informal than those in rural areas. On the basis of definition A there is no reason to view 
informality as a predominantly urban phenomenon. The lack of a signed contract is strongly 
associated with absence of union representation and with small establishment size. But there 
is some evidence in the results to suggest that the association with small establishments is 
also in decline. There is also a strong occupational pattern to the lack of a signed contract, 
although once again these effects are declining quite significantly over time. Informality as 
22
defined here is strongest amongst agricultural, production, construction, retailing and 
distribution occupations. 
Informal status defined on the basis of contract appears to be weakly complementary 
with informality elsewhere in the family. If workers have a spouse who is working without a 
signed labour card then they are 2 to 4 percentage points more likely to be informal 
themselves. Similarly an increase in the number of formal workers in the family as a whole is 
associated with a lower likelihood of informality, at a similar order of magnitude. Self-employment 
activity elsewhere in the family is strongly positively associated with informal 
contract status. The presence of elderly and children slightly but statistically significantly 
reduces the likelihood of informal contract status. Higher other family earnings are negatively 
associated with informality in 1992, but by 1995 are positively associated and remain so until 
the end of the period in question. There is some evidence that this positive association grows 
in size. 
Table 10 reports exactly the same regression specifications for the definition B (no 
social protection). There are some pronounced differences between these results and those 
reported in Table 9. The age at which an individual worker is least likely to be informal now 
increases to the early to mid 40s. Women are now more likely to be informal. Mixed race 
individuals are significantly more likely than whites to be informal, although the marginal 
effect indicates that the difference is only between 2 and 4 percentage points. There is now a 
much stronger negative association between higher educational status and informality. This 
negative association appears to become stronger towards the end of the period. Urban 
residents are less likely to be informal and the marginal effects are at least twice as large as 
those in Table 9. Union status and employment in a large establishment remain quantitatively 
23
very important, although the negative marginal effect for being with a large employer falls 
from over 60 percentage points to around 46-47 percentage points. By 2001 the patterns of 
occupational coefficients are different from those in Table 9. Although agricultural 
occupations remain far more likely to be informal, the strong positive effects seen for 
production, construction, retail, distribution and communications are diminished. Under 
definition B those in administrative occupations are significantly and quantitatively less 
likely to be informal. Turning to the variables describing the economic status of the family, 
we observe that the size of the positive relationship with the number of self-employed is the 
family falls substantially and that the associations with family dependents and other family 
income cease to be significant. 
Table 11 reports the results for the definition C based on establishment size and 
activity. Age remains significantly associated with informality – the age at which informality 
is least likely is around 30 years, closer to that for definition A than for B. Being female is 
positively associated with informality – women are 4 to 6 percentage points more likely to be 
in an informal activity. There is however virtually no significant association between 
ethnicity and this definition of informality. The association between educational attainment 
and this definition of informality is, from the pattern of the marginal effects, the most clear of 
any of the three definitions. Illiteracy is associated with an increase in the probability of 
informality of between 2 and 7 percentage points, with clear evidence that the conditional 
impact is rising over time. On the other hand the possession of a college degree reduces the 
likelihood of this definition of informality by between 14 and 17 percentage points. 
Again there appears to be a regional pattern to informality, once other factors are held. 
But the marginal effects are in general much smaller than for the other two definitions. There 
24
is barely any relationship with urban residence. Geography seems to matter much less if 
informality is defined according to the characteristics of the employment. Marginal effects 
for occupation remain statistically significant. However, the negative coefficients for creative 
and technical and administrative occupations in part arise from the exclusion of all the self-employed 
in these sectors from this definition of informality. Similarly, the strong positive 
association with the domestic, personal and catering services sector arises in part from the 
inclusion of all domestic workers in this definition of informality. 
The likelihood of being in an informal activity is reduced if the worker’s spouse is 
informal, although by only a very small amount. However, the sign of this relationship is the 
opposite of that observed for the other two definitions. Self-employment elsewhere in the 
family is strongly positively associated with this definition of informality. Marginal effects 
are three times as large as for definition B and nearer in size to those for definition A. 
Similarly the negative association between informality and numbers of dependents in the 
family is similar to that observed for definition A. There is a weak negative association 
between informal activity and other household income, which is only statistically significant 
in two of the eight years. This pattern of marginal effects is closest to those for definition B. 
6. Conclusions 
There is no consensus on how to define the phenomenon of labour market informality 
in developing economies. In many cases researchers’ choice of definition is determined by 
the availability of data. There has been limited discussion in the literature on whether this 
matters. We conclude in this paper that it does. Using data from Brazilian household surveys 
we have constructed three alternative definitions of informality, which attempt to reflect the 
25
various alternatives used in the literature. Informality is defined according to employment 
contract status, according to social security protection and, in a manner which is often 
adopted in previous research, according the nature of the employment and the characteristics 
of the employer. These three definitions are far from observationally equivalent. Around 64% 
of all the economically active in Brazil are informal according to at least one of the three 
definitions, but only 40% are informal according to all three definitions. There is a closer 
correspondence between “institutional” informality defined by not having a registered 
employment contract and not contributing to a social security scheme. However substantial 
numbers of workers are classified as informal if the definition is based on the nature of the 
employment and the employer, even though they may have registered contracts and/or may 
contribute towards social security. 
Even though overall rates of informality appear constant in Brazil through the 1990s, 
steady compositional changes are taking place. More women are becoming formal, while 
men are becoming more informal. Rates of informality are falling amongst the least skilled 
(as they decline in importance as a group) while rates of informality are rising quickly 
amongst the most skilled (as they increase in importance as a group). There are also 
occupational changes at work. Informality is rising amongst “higher” occupations and 
amongst manufacturing and construction groups, whereas it is falling amongst some service 
occupations, such as shop-workers and domestic staff. The scale of these changes is 
dependent on the choice of definition. These changes are mirrored in the econometric 
analysis presented in the paper, as the changing pattern of marginal effects on the likelihood 
of informality reveals growing heterogeneity within the informal sector. 
26
However, the most important conclusion to emerge from econometric analysis is that 
the conditional impact of particular factors on the likelihood of informality varies 
considerably from one definition to another. Informality defined according to contract status 
(labour card) is far less strongly associated with lower educational attainment than it is for the 
other definitions, particular the third definition (activity). There are also important differences 
in the occupational profile of the informal sector between the definitions. For example 
“higher level” occupations may not have registered contract, perhaps because they are self-employed 
or employers, but they do seem to have social protection. Lack of social protection 
seems to be a rural phenomenon, whereas there is little or no relationship between urban/rural 
location and the other definitions of informality. The security offered by a registered contract 
or a large employer seems better to match the family circumstances of those with dependents, 
but family circumstances do not appear to be strongly associated with social protection. 
Informal contract status (definition A) and informal activity (definition C) are strongly 
positively associated with informality elsewhere in the family, especially self-employment. 
This is not the case for social security status. 
Each of these points merits further research. In particular these differences suggest 
that the focus of research should shift towards the particular investigation of why workers 
choose not to have social protection. On the other hand a different avenue of research should 
focus on the relationship between entrepreneurial activity and informality. Our third 
definition of informality, based on the characteristics of the employment and the employer, is 
in empirical terms the most arbitrary. Yet this definition is conceptually well-founded as it 
corresponds most closely with the notion that informality is related to the degree of 
entrepreneurial dynamism in a developing economy. There is no a priori reason for believing 
that such employment activity should of necessity by unregistered and unprotected, and 
27
should therefore be regarded as “inferior”. The other strong feature of the data investigated in 
this paper concerns the growing heterogeneity within the informal sector. The reasons why 
males and those with high levels of educational attainment seem increasingly likely to be 
found working without contract registration or social protection, or in “informal activity” 
merit substantial further analysis. 
28
Notes: 
1 For further discussion on modeling and testing for segmentation see Heckman and Sedlacek 
(1985) and Magnac (1991). 
2 Loayza et al. (2005) argue that a heavier regulatory burden, particularly in product and 
labour markets, reduces growth and induces informality. They conclude, however, that these 
effects can be mitigated as the overall institutional framework improves. 
3 Informal workers defined as all non-professional self-employed plus all other employees of 
firms with under five employees (four in the case of El Salvador). 
4 Gong et al. (2000) report alternative results based on the firm-size definition in an appendix, 
but these are omitted from the version of this work subsequently published as Gong and van 
Soest (2002). The two sets of results are described in the later paper as “qualitatively 
similar”. No results are reported for a definition based on social security coverage. 
5 Prior to the adoption of the 1988 Constitution dismissal notice was fixed at one month. 
Subsequently it is a minimum of one month rising proportionately with accumulated tenure 
with the employer. This change is one of the main reasons why Barros and Corseuil (2001) 
argue that labour market inflexibility may have increased in Brazil. 
6 If the respondent reports that the size of the establishment is unknown, we assume that it is 
greater than five for the purposes of definition C. 
7 The structure of the PNAD questionnaire assumes that those who are illiterate must not have 
received any formal schooling. 
29
Bibliography 
Barros, R.P. and Corseuil, C.H. (2001), “The impact of regulations on Brazilian labor market 
performance”, Research Network Working Paper No. R-427, Inter-American Development 
Bank. 
Camargo, J.M. (2002), “Fake contracts: Justice and labor contracts in Brazil”, in World Bank 
(2002), Brazil: The Jobs Report, Washington, D.C., Report No. 24408-BR. 
Carneiro, F.G. (1997), “The changing informal labour market in Brazil: cyclicality versus 
excessive intervention”, Labour, 11(1): 3-22. 
Cohen, B. and House, W.J. (1996), “Labor market choices, earnings and informal networks in 
Khartoum, Sudan”, Economic Development and Cultural Change, 44(3): 589-618. 
Cunningham, W.V. and Maloney, W.F. (2001), “Heterogeneity among Mexico’s 
microenterprises: an application of factor and cluster analysis”, Economic Development and 
Cultural Change, 50(1): 131-156. 
Fields, G.S. (1975), “Rural-urban migration, urban unemployment and underemployment, 
and job search activity in LDC’s”, Journal of Development Economics, 2: 165-187. 
Funkhouser, E. (1996), "The urban informal sector in Central America: Household survey 
evidence", World Development, 24(11):1737-51. 
Galli, R. and Kucera, D. (2004), “Labor standards and informal employment in Latin 
America”, World Development, 32(5): 809-828. 
Gerxhani, K. (2004), “The informal sector in developed and less developed countries: a 
literature survey”, Public Choice, 120(3-4): 267-300 
Goldberg, P.K. and Pavcnik, N. (2003), “The response of the informal sector to trade 
liberalization”, Journal of Development Economics, 72(2): 463-496. 
Gong, X., van Soest, A. and Villagomez, E. (2000), “Mobility in the urban labor market: a 
panel data analysis for Mexico”, CentER Discussion Paper, No. 46, Tilburg University. 
Gong, X. and van Soest, A. (2002), “Wage differentials and mobility in the urban labour 
market: a panel data analysis for Mexico”, Labour Economics, 9: 513-529 
Hart, K. (1972), Employment, Income and Inequality: A Strategy for Increasing Productive 
Employment in Kenya, Geneva: ILO. 
Heckman, J. and Sedlacek, G. (1985), “Heterogeneity, aggregation and market wage 
functions: an empirical model of self-selection in the labour market”, Journal of Political 
Economy, 93: 1077-1125. 
Livingstone, I. (1991), “A reassessment of Kenya’s rural and urban informal sector”, World 
Development, 19(6): 651-670. 
30
Loayza, N., A.M. Oviedo, and L. Servén (2005), “The impact of regulation on growth and 
informality: cross-country evidence”, Policy Research Working Paper No. 3623, The World 
Bank, Washington, D.C. 
Magnac, Th. (1991), “Segmented or competitive labor markets”, Econometrica, 59(1): 165- 
187. 
Maloney, W.F. (1999), “Does informality imply segmentation in urban labor markets? 
Evidence from sectoral transitions in Mexico”, World Bank Economic Review, 13(2): 275- 
302. 
Maloney, W.F. (2004), “Informality revisited”, World Development, 32(7): 1159-1178. 
Marcoullier, D., Ruiz de Casilla, V. and Woodruff, C. (1997), "Formal measures of the 
informal-sector wage gap in Mexico, El Salvador, and Peru", Economic Development and 
Cultural Change, 45(2): 367-92. 
Mazumdar, D. (1976), “The urban informal sector”, World Development, 4(8): 655-679. 
Merrick, T.W. (1976), “Employment and earnings in the informal sector in Brazil: the case of 
Belo Horizonte”, Journal of Developing Areas, 10(3): 337-353. 
Pisani, M.J. and Pagan, J.A. (2004), “Self-employment in the era of the New Economic 
Model in Latin America: a case study from Nicaragua”, Entrepreneurship and Regional 
Development, 16: 335-350. 
Portes, A., Blitzner, S. and Curtis, J. (1986), “The urban informal sector in Uruguay: its 
internal structure, characteristics, and effects”, World Development, 14(6): 727-741. 
Pradhan, M. and van Soest, A. (1995), “Formal and informal sector employment in urban 
areas of Bolivia”, Labour Economics, 2: 275-297. 
Pradhan, M. and van Soest, A. (1997), “Household labor supply in urban areas of Bolivia”, 
Review of Economics and Statistics, 79(2): 300-310. 
Saavedra, J. and Chong, A. (1999), "Structural reform, institutions and earnings: Evidence 
from the formal and informal sectors in urban Peru", Journal of Development Studies, 
35(4):95-116. 
World Bank (2002), Brazil: The Jobs Report, Washington, D.C., Report No. 24408-BR. 
31
Table 1: Employment Status – 18-65 year olds 
Employment status – main 
occupation % 
1992 1993 1995 1996 1997 1998 1999 2001 
Employees 52.6 52.8 51.4 53.2 52.2 52.7 51.7 54.1 
Self-employed sole traders 23.2 23.2 24.1 23.6 23.9 24.1 24.1 22.9 
Employers 4.1 3.9 4.3 4.0 4.4 4.4 4.3 4.4 
Domestic workers 6.2 6.4 7.1 7.1 7.4 7.1 7.5 7.8 
Non-remunerated workers 6.5 6.6 6.3 5.9 5.8 5.6 6.1 5.0 
Subsistence agricultural 4.4 4.3 4.1 3.7 3.8 3.6 3.7 3.2 
Temporary workers 3.1 2.9 2.7 2.5 2.6 2.5 2.5 2.6 
Total 100.0 100.0 100.0 100.0 100.0 100.0 100.0 100.0 
Source: authors’ computations from PNAD, population weights 
32
Table 2: Labour card and social security institute status (in any employment) and informal activity by main employment status 
% 1992 1993 1995 1996 1997 1998 1999 2001 
All economically active 
A. No signed labour card 
B. No SS Institute member 
C. Informal activity 
56.7 
50.7 
49.1 
56.0 
51.4 
48.9 
57.5 
51.8 
50.7 
56.7 
51.7 
50.0 
57.3 
51.7 
50.6 
56.4 
51.8 
50.0 
57.8 
52.1 
49.0 
56.0 
50.4 
49.3 
Employees 
A. No signed labour card 
B. No SS Institute member 
C. Informal activity 
21.1 
24.3 
12.9 
21.2 
25.6 
12.8 
21.8 
25.1 
14.5 
23.2 
27.8 
15.6 
22.9 
26.3 
15.5 
22.8 
25.2 
15.5 
23.8 
25.7 
15.6 
24.0 
25.2 
16.6 
Self-employed sole traders 
A. No signed labour card 
B. No SS Institute member 
C. Informal activity 
99.2 
79.0 
95.5 
97.2 
79.1 
95.2 
99.1 
80.9 
94.7 
99.2 
79.7 
94.4 
99.2 
81.1 
94.3 
97.7 
83.0 
94.0 
98.7 
87.1 
93.8 
99.3 
84.3 
93.0 
Employers 
A. No signed labour card 
B. No SS Institute member 
C. Informal activity 
98.4 
32.6 
0.0 
97.9 
33.0 
0.0 
97.5 
32.3 
7.7 
97.1 
32.8 
7.6 
97.6 
35.4 
10.7 
97.6 
37.3 
9.3 
97.4 
38.2 
11.4 
97.8 
40.0 
11.4 
Domestic workers 
A. No signed labour card 
B. No SS Institute member 
78.8 
76.6 
79.2 
77.9 
77.5 
76.0 
74.7 
73.8 
74.4 
73.0 
73.0 
70.7 
72.6 
70.5 
71.5 
69.1 
Non-remunerated workers 
A. Signed labour card 
B. SS Institute member 
99.9 
97.7 
99.2 
97.1 
99.8 
97.8 
99.8 
97.1 
99.9 
97.0 
99.3 
97.3 
99.5 
97.4 
99.7 
96.9 
Subsistence agricultural 
A. No signed labour card 
B. No SS Institute member 
100.0 
99.3 
100.0 
99.4 
100.0 
99.4 
100.0 
99.0 
100.0 
99.2 
100.0 
99.5 
100.0 
99.5 
100.0 
99.5 
Temporary workers 
A. No signed labour card 
B. No SS Institute member 
90.8 
91.0 
89.6 
92.0 
89.7 
89.5 
86.2 
86.8 
89.2 
89.2 
89.8 
90.8 
88.2 
88.4 
88.7 
88.5 
Source: authors’ computations from PNAD, population weights 
33
Table 3: Correlations of informality measures 
A: No signed 
labour card 
B: No SS 
Institute 
Membership 
C: Informal 
activity 
1992: 
A: No signed labour card 1 
B: No SS Institute membership 0.79 1 
C: Informal activity 0.68 0.60 1 
1993: 
A: No signed labour card 1 
B: No SS Institute membership 0.77 1 
C: Informal activity 0.68 0.60 1 
1995: 
A: No signed labour card 1 
B: No SS Institute membership 0.79 1 
C: Informal activity 0.67 0.60 1 
1996: 
A: No signed labour card 1 
B: No SS Institute membership 0.76 1 
C: Informal activity 0.65 0.56 1 
1997: 
A: No signed labour card 1 
B: No SS Institute membership 0.79 1 
C: Informal activity 0.65 0.59 1 
1998: 
A: No signed labour card 1 
B: No SS Institute membership 0.81 1 
C: Informal activity 0.68 0.58 1 
1999: 
A: No signed labour card 1 
B: No SS Institute membership 0.82 1 
C: Informal activity 0.68 0.58 1 
2001: 
A: No signed labour card 1 
B: No SS Institute membership 0.84 1 
C: Informal activity 0.67 0.58 1 
34
Table 4: Descriptive analysis by informality definition - gender 
% 1992 1993 1995 1996 1997 1998 1999 2001 
Male 
A: no signed labour card 
55.5 
54.5 
56.6 
56.7 
57.3 
56.6 
58.1 
56.7 
B: no SS membership 
47.1 
47.9 
48.7 
49.6 
49.8 
50.0 
50.7 
49.4 
C: informal activity 
43.4 
43.3 
45.3 
45.7 
46.0 
49.1 
49.7 
48.2 
Female 
A: no signed labour card 
B: no SS membership 
C: informal activity 
58.5 
56.1 
57.9 
58.1 
56.6 
57.5 
58.9 
56.3 
58.6 
56.7 
54.9 
56.7 
57.3 
54.6 
57.6 
56.1 
53.0 
57.5 
57.3 
54.1 
58.6 
55.2 
51.6 
56.8 
t-test for difference between men 
and women 
A: no signed labour card 
B: no SS membership 
C: informal activity 
10.1** 
28.8** 
50.2** 
11.8** 
27.6** 
49.6** 
7.2** 
24.4** 
47.2** 
-1.0 
15.4** 
39.0** 
-0.4 
13.5** 
42.1** 
-1.4 
9.2** 
36.3** 
-3.5** 
9.9** 
38.7** 
-6.3** 
6.0** 
37.6** 
Note: ** denotes p<0.01 
35
Table 5: Descriptive analysis by informality definition - ethnicity 
% 1992 1993 1995 1996 1997 1998 1999 2001 
White (1992: 55.8%) 
A: no signed labour card 
52.2 
52.1 
53.6 
53.2 
53.3 
52.8 
53.9 
52.1 
B: no SS membership 
43.0 
43.6 
44.6 
45.0 
44.6 
44.0 
44.9 
43.5 
C: informal activity 
44.4 
44.5 
46.1 
45.8 
45.8 
48.3 
49.1 
47.4 
Black (1992: 5.7%) 
A: no signed labour card 
B: no SS membership 
C: informal activity 
57.5 
55.3 
53.6 
55.2 
54.0 
51.5 
55.2 
53.4 
53.3 
55.7 
55.2 
53.1 
53.8 
52.4 
52.0 
54.9 
52.6 
54.4 
56.5 
54.8 
55.8 
54.0 
51.6 
52.9 
Asian (1992: 0.5%) 
A: no signed labour card 
B: no SS membership 
C: informal activity 
53.8 
29.1 
36.3 
58.1 
31.3 
34.8 
63.2 
32.6 
37.9 
61.0 
41.6 
39.5 
59.5 
36.6 
36.6 
65.8 
40.0 
50.2 
62.2 
36.2 
50.5 
59.5 
35.9 
48.6 
Mixed (1992: 37.9%) 
A: no signed labour card 
B: no SS membership 
C: informal activity 
63.1 
61.5 
55.6 
61.6 
62.7 
55.4 
63.6 
62.6 
57.3 
62.2 
61.8 
56.4 
63.6 
62.4 
57.7 
61.8 
61.9 
58.5 
63.6 
62.6 
59.4 
62.1 
60.3 
57.8 
Indigenous (1992: 0.07%) 
A: no signed labour card 
B: no SS membership 
C: informal activity 
65.6 
67.1 
61.1 
76.8 
82.7 
74.8 
81.4 
79.8 
77.5 
74.4 
68.1 
66.7 
79.5 
79.6 
81.7 
60.3 
58.3 
50.7 
70.7 
71.1 
56.8 
61.8 
57.5 
61.3 
36
Table 6: Descriptive analysis by informality definition – educational attainment 
% 1992 1993 1995 1996 1997 1998 1999 2001 
All educational levels* 
A: no signed labour card 
56.5 
55.8 
57.4 
56.5 
57.1 
56.3 
57.6 
56.0 
B: no SS membership 
50.4 
51.2 
51.6 
51.5 
51.6 
51.0 
51.9 
50.3 
C: informal activity 
48.9 
48.7 
50.5 
49.8 
50.4 
49.8 
50.9 
49.3 
Illiterate (1992: 10.6%; 2001: 6.5%) 
A: no signed labour card 
B: no SS membership 
C: informal activity 
82.4 
82.0 
72.6 
79.7 
83.9 
72.7 
83.0 
82.9 
74.8 
83.1 
83.0 
74.2 
83.1 
82.9 
75.7 
79.1 
83.3 
74.8 
83.5 
85.0 
76.8 
83.5 
82.5 
77.5 
Elementary (1992: 27.4%; 2001: 15.5%) 
A: no signed labour card 
B: no SS membership 
C: informal activity 
66.8 
58.1 
60.8 
65.6 
58.4 
60.8 
68.7 
60.6 
63.8 
68.2 
60.0 
64.1 
70.2 
62.0 
66.0 
69.7 
62.7 
66.3 
70.7 
63.5 
67.0 
71.1 
64.0 
67.8 
Primary (1992: 34.7%; 2001: 38.7%) 
A: no signed labour card 
B: no SS membership 
C: informal activity 
59.2 
55.2 
53.1 
59.4 
56.7 
53.1 
60.9 
57.5 
56.2 
60.3 
57.5 
55.7 
61.6 
58.2 
56.9 
61.4 
58.2 
57.1 
63.3 
59.8 
58.8 
63.1 
59.4 
58.6 
Secondary (1992: 17.5%; 2001: 26.2%) 
A: no signed labour card 
B: no SS membership 
C: informal activity 
36.1 
29.1 
28.4 
36.9 
30.6 
29.9 
38.6 
32.2 
31.5 
39.3 
34.4 
32.6 
39.7 
33.7 
32.8 
40.3 
33.7 
33.5 
41.6 
35.2 
35.0 
41.4 
35.5 
34.9 
College deg. (1992: 9.1%; 2001: 12.3%) 
A: no signed labour card 
B: no SS membership 
C: informal activity 
25.8 
14.8 
10.7 
26.7 
15.7 
10.7 
30.1 
17.0 
12.4 
30.8 
19.6 
13.6 
31.7 
19.4 
14.1 
33.3 
19.5 
13.7 
32.9 
19.2 
13.7 
32.8 
20.5 
14.3 
Postgrad deg. (1992: 0.4%; 2001: 0.8%) 
A: no signed labour card 
B: no SS membership 
C: informal activity 
17.9 
9.7 
3.7 
16.1 
9.4 
3.5 
18.2 
13.7 
5.3 
18.7 
13.8 
5.6 
19.9 
12.8 
6.3 
23.2 
14.1 
5.9 
23.1 
11.3 
6.6 
27.3 
22.7 
18.9 
* Observations with missing information on educational attainment comprise 1.44% and 1.39% of the total sample in 1992 and 2001 
respectively. 
37
Table 7: Descriptive analysis by informality definition – establishment size (excluding agriculture*) 
% 1992 1993 1995 1996 1997 1998 1999 2001 
One (1992: 22.5%; 2001 22.8%: ) 
A: no signed labour card 
99.1 
98.7 
99.0 
98.9 
99.0 
98.9 
99.1 
99.1 
B: no SS membership 
70.2 
71.1 
73.3 
72.2 
74.0 
76.9 
77.5 
79.2 
C: informal activity 
88.7 
88.7 
88.6 
88.0 
88.3 
88.0 
88.1 
87.2 
Two (1992: 3.6%; 2001: 4.3%) 
A: no signed labour card 
B: no SS membership 
C: informal activity 
80.1 
60.3 
76.6 
81.0 
60.6 
76.8 
81.3 
61.5 
79.1 
75.2 
61.5 
83.3 
78.1 
62.1 
81.3 
79.1 
63.0 
80.5 
78.3 
62.6 
80.7 
78.4 
64.5 
82.3 
3 to 5 (1992: 7.4%; 2001: 8.7%) 
A: no signed labour card 
B: no SS membership 
C: informal activity 
64.2 
50.6 
84.9 
65.5 
53.0 
85.3 
63.6 
50.6 
86.2 
62.1 
52.1 
88.2 
63.8 
51.9 
86.4 
62.9 
50.0 
86.4 
63.1 
51.2 
87.3 
62.4 
51.1 
87.7 
6 to 10 (1992: 5.9% ; 2001: 7.1) 
A: no signed labour card 
B: no SS membership 
C: informal activity 
42.5 
34.2 
0.0 
44.9 
36.3 
0.0 
41.6 
33.0 
0.0 
42.0 
36.0 
0.0 
40.4 
33.1 
0.0 
42.0 
32.7 
0.0 
43.0 
34.1 
0.0 
42.0 
34.0 
0.0 
11 or more (1992: 49.8%; 2001: 45.2% ) 
A: no signed labour card 
B: no SS membership 
C: informal activity 
8.1 
11.7 
0.0 
8.2 
13.4 
0.0 
8.6 
12.7 
0.0 
9.8 
15.5 
0.0 
10.0 
14.1 
0.0 
10.3 
13.5 
0.0 
11.1 
13.7 
0.0 
11.6 
13.1 
0.0 
Establishment size unknown (1992: 
10.8%; 2001: 11.8%) 
A: no signed labour card 
B: no SS membership 
C: informal activity 
83.6 
80.3 
99.8 
83.7 
81.5 
99.5 
82.3 
79.9 
99.7 
79.8 
77.7 
99.8 
79.6 
77.2 
99.9 
78.5 
75.6 
99.6 
78.2 
75.3 
99.7 
76.6 
73.6 
99.6 
Note: *Agriculture is omitted because the questionnaire schedule for agricultural workers is subdivided into grouped responses for temporary 
and permanent workers. 
38
Table 8: Descriptive analysis by informality definition – occupational sectors 
% 1992 1993 1995 1996 1997 1998 1999 2001 
Creative and Technical 
(1992: 8.1%; 2001: 9.5%) 
A: no signed labour card 
20.2 
19.7 
23.3 
23.7 
24.5 
25.6 
25.6 
27.2 
B: no SS membership 
18.4 
19.0 
20.8 
23.1 
21.0 
20.6 
19.8 
21.4 
C: informal activity 
4.5 
3.9 
4.8 
5.0 
4.5 
5.0 
4.3 
5.5 
Administrative 
(1992: 14.0%; 2001: 13.4%) 
A: no signed labour card 
B: no SS membership 
C: informal activity 
34.5 
18.1 
7.0 
35.3 
18.8 
7.2 
35.6 
18.6 
8.1 
35.3 
20.6 
9.7 
35.8 
19.9 
9.2 
37.3 
20.0 
9.4 
37.3 
20.2 
9.8 
37.5 
21.1 
10.2 
Agricultural 
(1992: 23.2%; 2001: 17.2%) 
A: no signed labour card 
B: no SS membership 
C: informal activity 
91.4 
90.2 
81.9 
88.3 
89.8 
81.6 
90.7 
89.6 
82.2 
90.0 
88.3 
81.1 
90.2 
88.7 
81.8 
88.5 
89.1 
82.9 
89.4 
88.2 
82.7 
89.8 
88.0 
82.5 
Manufacturing and construction 
(1992: 18.9%; 2001: 19.1%) 
A: no signed labour card 
B: no SS membership 
C: informal activity 
52.6 
46.2 
47.3 
53.3 
47.5 
47.4 
56.4 
49.7 
51.4 
56.9 
50.8 
51.5 
57.9 
51.5 
52.9 
58.4 
52.2 
52.9 
59.0 
52.8 
52.6 
57.5 
52.3 
51.3 
Retail and Distribution 
(1992: 11.0%; 2001: 12.6%) 
A: no signed labour card 
B: no SS membership 
C: informal activity 
72.8 
54.4 
74.0 
74.0 
56.7 
74.5 
74.4 
58.3 
75.5 
72.6 
57.5 
73.2 
72.4 
57.9 
73.2 
71.3 
57.7 
72.5 
72.1 
59.3 
72.2 
69.1 
58.3 
69.6 
Transport and Communications 
(1992: 4.2%; 2001: 4.5%) 
A: no signed labour card 
B: no SS membership 
33.0 
24.1 
32.1 
23.5 
35.9 
27.7 
38.5 
31.6 
40.5 
32.9 
41.5 
32.8 
44.4 
34.7 
42.8 
34.2 
39
C: informal activity 29.2 29.1 33.1 35.2 35.4 37.1 39.6 38.0 
Domestic, Personal and Catering 
Services (1992: 9.7%; 2001: 1.9%) 
A: no signed labour card 
71.0 
71.8 
71.1 
68.7 
68.7 
67.3 
67.9 
66.4 
B: no SS membership 
68.3 
69.8 
68.5 
66.9 
66.8 
64.1 
65.4 
63.5 
C: informal activity 
83.8 
84.2 
84.9 
84.8 
85.2 
83.5 
85.7 
84.4 
Other 
(1992: 10.9%; 2001: 12.0%) 
A: no signed labour card 
B: no SS membership 
C: informal activity 
24.5 
30.9 
21.3 
23.5 
32.6 
20.4 
24.3 
32.0 
21.5 
25.8 
33.5 
22.3 
26.7 
33.1 
23.3 
27.1 
35.1 
23.4 
29.9 
36.6 
25.9 
30.2 
34.3 
26.3 
40
Table 9: Probit Estimates – No Signed Labour Card 
1992 1993 1995 1996 1997 1998 1999 2001 
Age -0.007** -0.009** -0.005** -0.008** -0.007** -0.011** -0.011** -0.012** 
Age squared 0.00013** 0.00016** 0.00011** 0.00015** 0.00014** 0.00019** 0.00018** 0.00021** 
Female -0.053** -0.050** -0.059** -0.060** -0.073** -0.063** -0.070** -0.061** 
Ethnicity (reference: White) 
Indigenous 
Black 
Asian 
Mixed 
0.078 
-0.024** 
0.081* 
0.0001 
-0.020 
-0.026** 
0.071* 
0.010* 
0.169* 
-0.049** 
0.142** 
0.003 
0.140** 
-0.038** 
0.132** 
-0.003 
0.071 
-0.035** 
0.131** 
0.002 
0.073 
-0.018* 
0.131** 
-0.004 
0.150** 
-0.022** 
0.115** 
0.001 
-0.033 
-0.030** 
0.067* 
-0.002 
Illiterate 0.059** 0.071** 0.072** 0.074** 0.068** 0.053** 0.070** 0.088** 
Schooling (reference: Elementary) 
Primary 
Secondary 
College degree 
Postgraduate degree 
0.002 
-0.073** 
0.0006 
-0.073 
0.018** 
-0.069** 
0.008 
-0.115** 
0.019** 
-0.066** 
0.011 
-0.102** 
0.0005 
-0.075** 
-0.002 
-0.122** 
0.015* 
-0.070** 
-0.009 
-0.140** 
0.015* 
-0.060** 
0.013 
-0.033 
0.018** 
-0.069** 
0.004 
-0.048 
0.025** 
-0.063** 
-0.007 
-0.128** 
Region (reference: South East) 
North 
Centre East 
South 
North East 
0.155** 
0.094** 
0.019** 
0.128** 
0.126** 
0.076** 
0.008 
0.089** 
0.126** 
0.076** 
0.033** 
0.137** 
0.120** 
0.069** 
0.019** 
0.114** 
0.139** 
0.054** 
0.002 
0.110** 
0.139** 
0.056** 
0.023** 
0.111** 
0.136** 
0.053** 
0.014** 
0.125** 
0.103** 
0.034** 
0.017** 
0.118** 
Urban resident -0.049** -0.015* -0.041** -0.022** -0.036** 0.004 0.0003 -0.030** 
Union member -0.236** -0.232** -0.242** -0.233** -0.250** -0.245** -0.249** -0.231** 
Establishment > 11 employees -0.675** -0.671** -0.661** -0.627** -0.633** -0.630** -0.627** -0.616** 
Occupation (reference: Other) 
Creative and technical 
Administrative 
Agricultural 
Production and construction 
Retail and distribution 
Transport and comms 
Domestic, personal and 
catering services 
0.030** 
0.091** 
0.168** 
0.197** 
0.193** 
0.093** 
0.150** 
0.038** 
0.096** 
0.142** 
0.212** 
0.203** 
0.089** 
0.157** 
0.045** 
0.085** 
0.173** 
0.224** 
0.214** 
0.102** 
0.181** 
0.033** 
0.065** 
0.186** 
0.207** 
0.202** 
0.103** 
0.156** 
0.043** 
0.058** 
0.168** 
0.194** 
0.191** 
0.118** 
0.142** 
0.033** 
0.065** 
0.152** 
0.198** 
0.173** 
0.117** 
0.125** 
0.041** 
0.056** 
0.142** 
0.200** 
0.176** 
0.129** 
0.122** 
0.027** 
0.048** 
0.150** 
0.181** 
0.151** 
0.108** 
0.100** 
41
Spouse working with no labour card 0.037** 0.022** 0.025** 0.025** 0.021** 0.022** 0.014** 0.031** 
Family total with labour cards -0.026** -0.025** -0.027** -0.028** -0.025** -0.032** -0.027** -0.025** 
Family total self-employed 0.139** 0.139** 0.147** 0.159** 0.155** 0.148** 0.152** 0.140** 
Family total number of children -0.010** -0.010** -0.014** -0.011** -0.011** -0.010** -0.011** -0.011** 
Family total number over 65 -0.025** -0.022** -0.018** -0.026** -0.020** -0.022** -0.020** -0.018** 
Other family earnings per head -.39x10-8** .15x10-7 .26x10-4** .26x10-4** .38x10-4** .45x10-4** .35x10-4** .32x10-4** 
Sample size 103,700 105,031 112,127 108,924 116,120 115,011 118,767 132,534 
Log likelihood -35275.7 -36438.4 -39000.0 -40349.0 -42835.6 -43755.5 -45398.1 -52032.1 
Note: reported coefficients are marginal effects (which in the case of binary variables are for a discrete change in the variable) 
* denotes p<0.05; ** denotes p<0.01; 
42
Table 10: Probit Estimates – No Social Security Membership 
1992 1993 1995 1996 1997 1998 1999 2001 
Age -0.028** -0.028** -0.025** -0.025** -0.025** -0.026** -0.025** -0.026** 
Age squared 0.00031** 0.00031** 0.00029** 0.00028** 0.00028** 0.00030* 0.00030* 0.00030* 
Female 0.062** 0.060** 0.050** 0.044** 0.021** 0.026** 0.024** 0.026** 
Ethnicity (reference: White) 
Indigenous 
Black 
Asian 
Mixed 
0.068 
0.012 
-0.053 
0.033** 
0.158* 
0.006 
-0.060* 
0.041** 
0.100 
-0.006 
-0.091** 
0.035** 
0.043 
0.011 
-0.025 
0.024** 
0.151** 
-0.001 
0.013 
0.025** 
0.098** 
-0.001 
0.028 
0.031** 
0.166** 
0.004 
-0.019 
0.026** 
0.008 
-0.003 
-0.010 
0.023** 
Illiterate 0.094** 0.135** 0.098** 0.097** 0.090** 0.115** 0.116** 0.100** 
Schooling (reference: Elementary) 
Primary 
Secondary 
College degree 
Postgraduate degree 
-0.049** 
-0.093** 
-0.085** 
-0.025 
-0.040** 
-0.099** 
-0.090** 
-0.097** 
-0.036** 
-0.096** 
-0.110** 
-0.068* 
-0.039** 
-0.097** 
-0.100** 
-0.129** 
-0.035** 
-0.104** 
-0.108** 
-0.164** 
-0.040** 
-0.107** 
-0.101** 
-0.096** 
-0.033** 
-0.118** 
-0.124** 
-0.166** 
-0.026** 
-0.114** 
-0.116** 
-0.153** 
Region (reference: South East) 
North 
Centre East 
South 
North East 
0.272** 
0.159** 
0.026** 
0.205** 
0.253** 
0.162** 
0.009 
0.215** 
0.239** 
0.145** 
0.025** 
0.190** 
0.224** 
0.137** 
-0.002 
0.179** 
0.240** 
0.123** 
0.003 
0.183** 
0.216** 
0.112** 
0.007 
0.189** 
0.225** 
0.121** 
-0.005 
0.205** 
0.181** 
0.088** 
0.003 
0.177** 
Urban resident -0.117** -0.126** -0.112** -0.075** -0.098** -0.094** -0.071** -0.089** 
Union member -0.241** -0.251** -0.253** -0.248** -0.261** -0.272** -0.267** -0.257** 
Establishment > 11 employees -0.474** -0.469** -0.462** -0.419** -0.442** -0.465** -0.464** -0.472** 
Occupation (reference: Other) 
Creative and technical 
Administrative 
Agricultural 
Production and construction 
Retail and distribution 
Transport and comms 
Domestic, personal and 
catering services 
-0.089** 
-0.217** 
0.146** 
0.029** 
-0.062** 
-0.095** 
0.030** 
-0.077** 
-0.206** 
0.137** 
0.034** 
-0.053** 
-0.102** 
0.035** 
-0.059** 
-0.215** 
0.138** 
0.053** 
-0.023** 
-0.068** 
0.054** 
-0.061** 
-0.201** 
0.150** 
0.040** 
-0.022** 
-0.051** 
0.039** 
-0.069** 
-0.206** 
0.138** 
0.047** 
-0.011 
-0.032** 
0.047** 
-0.096** 
-0.214** 
0.094** 
0.035** 
-0.032** 
-0.049** 
-0.010 
-0.093** 
-0.211** 
0.087** 
0.052** 
-0.012 
-0.039** 
0.008 
-0.075** 
-0.193** 
0.111** 
0.066** 
-0.001 
-0.023** 
0.003 
43
Spouse working with no labour card 0.023** 0.012* 0.013** 0.008 0.010* 0.020** 0.006 0.020** 
Family total with labour cards -0.024** -0.019** -0.025** -0.025** -0.019** -0.030** -0.027** -0.023** 
Family total self-employed 0.040** 0.042** 0.052** 0.054** 0.058** 0.064** 0.067** 0.064** 
Family total number of children 0.0006 0.0002 -0.0016* -0.0014 0.0005 0.0003 -0.0002 -0.0005 
Family total number over 65 -0.002 -0.006 -0.003 -0.005 -0.005 -0.003 -0.004 -0.008* 
Other family earnings per head -.12x10-7** -.31x10-6** -.67x10-5 -.83x10-5 -.36x10-6 -.14x10-6 -.25x10-5 -.38x10-5 
Sample size 103,687 105,012 112,126 108,918 116,120 115,004 118,763 132,527 
Log likelihood -45028.3 -45927.3 -50127.6 -52184.7 -53936.2 -52624.8 -54372.8 -61217.0 
Note: reported coefficients are marginal effects (which in the case of binary variables are for a discrete change in the variable) 
* denotes p<0.05; ** denotes p<0.01; 
44
Table 11: Probit Estimates – Informal Activity 
1992 1993 1995 1996 1997 1998 1999 2001 
Age -0.006** -0.006** -0.006** -0.007** -0.006** -0.006** -0.006** -0.004** 
Age squared 0.00010** 0.00010** 0.00010** 0.00012** 0.00010** 0.00010** 0.00011** 0.00009** 
Female 0.065** 0.051** 0.060** 0.057** 0.058** 0.044** 0.045** 0.055** 
Ethnicity (reference: White) 
Indigenous 
Black 
Asian 
Mixed 
0.065 
0.008 
-0.027 
0.002 
0.129* 
0.001 
-0.025 
0.004 
0.116 
-0.009 
0.013 
0.003 
0.040 
-0.012 
0.023 
-0.005 
0.219** 
-0.008 
0.046 
0.004 
-0.004 
0.006 
0.023 
0.005 
-0.006 
0.002 
0.060 
0.010* 
0.064 
-0.002 
0.026 
0.010** 
Illiterate 0.024** 0.041** 0.041** 0.028** 0.046** 0.039** 0.052** 0.073** 
Schooling (reference: Elementary) 
Primary 
Secondary 
College degree 
Postgraduate degree 
-0.043** 
-0.089** 
-0.136** 
-0.216** 
-0.035** 
-0.079** 
-0.150** 
-0.238** 
-0.034** 
-0.106** 
-0.158** 
-0.181** 
-0.041** 
-0.101** 
-0.153** 
-0.170** 
-0.035** 
-0.103** 
-0.151** 
-0.125** 
-0.035** 
-0.097** 
-0.154** 
-0.198** 
-0.027** 
-0.103** 
-0.160** 
-0.146** 
-0.029** 
-0.119** 
-0.173** 
-0.151** 
Region (reference: South East) 
North 
Centre East 
South 
North East 
0.042** 
0.014** 
0.030** 
0.073** 
0.047** 
0.010** 
0.031** 
0.081** 
0.053** 
0.007 
0.012** 
0.072** 
0.052** 
0.001 
0.005 
0.060** 
0.047** 
0.001 
0.016** 
0.068** 
0.046** 
-0.010 
0.019** 
0.064** 
0.019** 
-0.012* 
0.009 
0.053** 
0.039** 
0.010 
0.016** 
0.064** 
Urban resident -0.014* 0.006 -0.023** 0.0004 0.0002 0.0002 0.016** 0.006 
Union member -0.225** -0.227** -0.252** -0.219** -0.238** -0.229** -0.225** -0.224** 
Establishment > 11 employees n.a. n.a. n.a. n.a. n.a. n.a. n.a. n.a. 
Occupation (reference: Other) 
Creative and technical 
Administrative 
Agricultural 
Production and construction 
Retail and distribution 
Transport and comms 
Domestic, personal and 
catering services 
-0.270** 
-0.233** 
0.451** 
0.278** 
0.480** 
0.156** 
0.592** 
-0.262** 
-0.221** 
0.463** 
0.288** 
0.488** 
0.153** 
0.605** 
-0.271** 
-0.223** 
0.434** 
0.307** 
0.483** 
0.182** 
0.571** 
-0.284** 
-0.198** 
0.417** 
0.282** 
0.447** 
0.173** 
0.564** 
-0.297** 
-0.226** 
0.421** 
0.291** 
0.440** 
0.169** 
0.565** 
-0.288** 
-0.200** 
0.438** 
0.295** 
0.449** 
0.199** 
0.562** 
-0.319** 
-0.230** 
0.414** 
0.262** 
0.417** 
0.181** 
0.557** 
-0.296** 
-0.211** 
0.406** 
0.249** 
0.403** 
0.166** 
0.539** 
45
Spouse working with no labour card -0.007 0.0003 -0.014** -0.007 -0.014** -0.015** -0.022** -0.008 
Family total with labour cards -0.006** -0.006** -0.009** -0.009** -0.013** -0.012** -0.012** -0.008** 
Family total self-employed 0.166** 0.176** 0.179** 0.176** 0.181** 0.177** 0.187** 0.164** 
Family total number of children -0.019** -0.020** -0.020** -0.019** -0.019** -0.019** -0.020** -0.018** 
Family total number over 65 -0.017** -0.023** -0.019** -0.009** -0.024** -0.023** -0.017** -0.011** 
Other family earnings per head -.14x10-8 -.17x10-6** -.93x10-5 -.11x10-4* -.74x10-5 -.84x10-5 -.44x10-5 -.11x10-4** 
Sample size 103,700 105,031 112,127 108,924 116,120 115,011 118,767 132,534 
Log likelihood -44932.5 -44995.1 -48837.2 -49312.3 -51789.7 -51760.3 -53182.6 -60935.2 
Note: reported coefficients are marginal effects (which in the case of binary variables are for a discrete change in the variable) 
* denotes p<0.05; ** denotes p<0.01; 
46
Figure 1: Coincidence of alternative definitions of informality, 1992 
No Signed 
Labour Card 
No Social 
Security 
Membership 
3.53% 8.29% 2.26% 
39.95% 
4.93% 0.18% 
36.80% 4.06% 
Informal 
Activity 
47
Figure 2: Coincidence of alternative definitions of informality, 2001 
No Signed 
Labour Card 
No Social 
Security 
Membership 
3.52% 9.23% 1.48% 
39.63% 
3.65% 0.04% 
36.43% 6.01% 
Informal 
Activity 
48

More Related Content

What's hot

What is the gender pay gap? copy
What is the gender pay gap? copyWhat is the gender pay gap? copy
What is the gender pay gap? copyJordan Rohan Brown
 
Migration experience, occupational attainment and subjective perceptions of o...
Migration experience, occupational attainment and subjective perceptions of o...Migration experience, occupational attainment and subjective perceptions of o...
Migration experience, occupational attainment and subjective perceptions of o...Palkansaajien tutkimuslaitos
 
Modernizing the Informal Sector
Modernizing the Informal SectorModernizing the Informal Sector
Modernizing the Informal SectorDr Lendy Spires
 
The Choice Between the In-house Provision and the Competitive Out-house Provi...
The Choice Between the In-house Provision and the Competitive Out-house Provi...The Choice Between the In-house Provision and the Competitive Out-house Provi...
The Choice Between the In-house Provision and the Competitive Out-house Provi...Palkansaajien tutkimuslaitos
 
Bank Location and Financial Liberalization Reforms: Evidence from Microgeogra...
Bank Location and Financial Liberalization Reforms: Evidence from Microgeogra...Bank Location and Financial Liberalization Reforms: Evidence from Microgeogra...
Bank Location and Financial Liberalization Reforms: Evidence from Microgeogra...Stockholm Institute of Transition Economics
 
Gender Wage Gaps and Worker Mobility: Evidence from the Garment Sector in Ban...
Gender Wage Gaps and Worker Mobility: Evidence from the Garment Sector in Ban...Gender Wage Gaps and Worker Mobility: Evidence from the Garment Sector in Ban...
Gender Wage Gaps and Worker Mobility: Evidence from the Garment Sector in Ban...Stockholm Institute of Transition Economics
 
Regulating work and employment: in search of a more comprehensive paradigm
Regulating work and employment: in search of a more comprehensive paradigm Regulating work and employment: in search of a more comprehensive paradigm
Regulating work and employment: in search of a more comprehensive paradigm NuBizHRMWE
 
Nonprofit Wage Comparison Studies
Nonprofit Wage Comparison StudiesNonprofit Wage Comparison Studies
Nonprofit Wage Comparison Studiesheathercarpenter
 
Closing the gender pay gap
Closing the gender pay gapClosing the gender pay gap
Closing the gender pay gapWhite & Case
 
The impact of savings and credit cooperatives in ofla wereda tigray region of...
The impact of savings and credit cooperatives in ofla wereda tigray region of...The impact of savings and credit cooperatives in ofla wereda tigray region of...
The impact of savings and credit cooperatives in ofla wereda tigray region of...Alexander Decker
 
11.the impact of savings and credit cooperatives in ofla wereda tigray region...
11.the impact of savings and credit cooperatives in ofla wereda tigray region...11.the impact of savings and credit cooperatives in ofla wereda tigray region...
11.the impact of savings and credit cooperatives in ofla wereda tigray region...Alexander Decker
 
Correspondence Studies on Gender, Ethnicity and Religiosity Discrimination in...
Correspondence Studies on Gender, Ethnicity and Religiosity Discrimination in...Correspondence Studies on Gender, Ethnicity and Religiosity Discrimination in...
Correspondence Studies on Gender, Ethnicity and Religiosity Discrimination in...Economic Research Forum
 

What's hot (20)

What is the gender pay gap? copy
What is the gender pay gap? copyWhat is the gender pay gap? copy
What is the gender pay gap? copy
 
CASE Network Studies and Analyses 475 - True and false remedies for long time...
CASE Network Studies and Analyses 475 - True and false remedies for long time...CASE Network Studies and Analyses 475 - True and false remedies for long time...
CASE Network Studies and Analyses 475 - True and false remedies for long time...
 
Migration experience, occupational attainment and subjective perceptions of o...
Migration experience, occupational attainment and subjective perceptions of o...Migration experience, occupational attainment and subjective perceptions of o...
Migration experience, occupational attainment and subjective perceptions of o...
 
Modernizing the Informal Sector
Modernizing the Informal SectorModernizing the Informal Sector
Modernizing the Informal Sector
 
The Choice Between the In-house Provision and the Competitive Out-house Provi...
The Choice Between the In-house Provision and the Competitive Out-house Provi...The Choice Between the In-house Provision and the Competitive Out-house Provi...
The Choice Between the In-house Provision and the Competitive Out-house Provi...
 
Bank Location and Financial Liberalization Reforms: Evidence from Microgeogra...
Bank Location and Financial Liberalization Reforms: Evidence from Microgeogra...Bank Location and Financial Liberalization Reforms: Evidence from Microgeogra...
Bank Location and Financial Liberalization Reforms: Evidence from Microgeogra...
 
Gender Wage Gaps and Worker Mobility: Evidence from the Garment Sector in Ban...
Gender Wage Gaps and Worker Mobility: Evidence from the Garment Sector in Ban...Gender Wage Gaps and Worker Mobility: Evidence from the Garment Sector in Ban...
Gender Wage Gaps and Worker Mobility: Evidence from the Garment Sector in Ban...
 
Who chooses to become a public sector employee?
Who chooses to become a public sector employee?Who chooses to become a public sector employee?
Who chooses to become a public sector employee?
 
ZeroHours
ZeroHoursZeroHours
ZeroHours
 
Regulating work and employment: in search of a more comprehensive paradigm
Regulating work and employment: in search of a more comprehensive paradigm Regulating work and employment: in search of a more comprehensive paradigm
Regulating work and employment: in search of a more comprehensive paradigm
 
C muller1
C muller1C muller1
C muller1
 
Labor Market Integration of Boston's Foreign-Born
Labor Market Integration of Boston's Foreign-BornLabor Market Integration of Boston's Foreign-Born
Labor Market Integration of Boston's Foreign-Born
 
Nonprofit Wage Comparison Studies
Nonprofit Wage Comparison StudiesNonprofit Wage Comparison Studies
Nonprofit Wage Comparison Studies
 
Dual Labor Market Theory
Dual Labor Market TheoryDual Labor Market Theory
Dual Labor Market Theory
 
Closing the gender pay gap
Closing the gender pay gapClosing the gender pay gap
Closing the gender pay gap
 
The impact of savings and credit cooperatives in ofla wereda tigray region of...
The impact of savings and credit cooperatives in ofla wereda tigray region of...The impact of savings and credit cooperatives in ofla wereda tigray region of...
The impact of savings and credit cooperatives in ofla wereda tigray region of...
 
11.the impact of savings and credit cooperatives in ofla wereda tigray region...
11.the impact of savings and credit cooperatives in ofla wereda tigray region...11.the impact of savings and credit cooperatives in ofla wereda tigray region...
11.the impact of savings and credit cooperatives in ofla wereda tigray region...
 
The Collaborative Economy in Poland and Europe: A Tool for Boosting Female Em...
The Collaborative Economy in Poland and Europe: A Tool for Boosting Female Em...The Collaborative Economy in Poland and Europe: A Tool for Boosting Female Em...
The Collaborative Economy in Poland and Europe: A Tool for Boosting Female Em...
 
Blessing corruption: institutional reforms
Blessing corruption: institutional reformsBlessing corruption: institutional reforms
Blessing corruption: institutional reforms
 
Correspondence Studies on Gender, Ethnicity and Religiosity Discrimination in...
Correspondence Studies on Gender, Ethnicity and Religiosity Discrimination in...Correspondence Studies on Gender, Ethnicity and Religiosity Discrimination in...
Correspondence Studies on Gender, Ethnicity and Religiosity Discrimination in...
 

Viewers also liked

International marine contractors association vision & strategy
International marine contractors association vision & strategyInternational marine contractors association vision & strategy
International marine contractors association vision & strategyDr Lendy Spires
 
Intensifying cooperation between european implementation agencies
Intensifying cooperation between european implementation agenciesIntensifying cooperation between european implementation agencies
Intensifying cooperation between european implementation agenciesDr Lendy Spires
 
Informal Sector in Developed and Less Developed Countries
 Informal Sector in Developed and Less Developed Countries Informal Sector in Developed and Less Developed Countries
Informal Sector in Developed and Less Developed CountriesDr Lendy Spires
 
Global Risks 2014 Ninth Edition Insight
Global Risks 2014 Ninth Edition Insight Global Risks 2014 Ninth Edition Insight
Global Risks 2014 Ninth Edition Insight Dr Lendy Spires
 
The ILO and the informal sector: an institutional history
The ILO and the informal sector: an institutional historyThe ILO and the informal sector: an institutional history
The ILO and the informal sector: an institutional historyDr Lendy Spires
 
REDUCING POVERTY IN AFRICA: REALISTIC TARGETS FOR THE POST-2015 MDG's AND AGE...
REDUCING POVERTY IN AFRICA: REALISTIC TARGETS FOR THE POST-2015 MDG's AND AGE...REDUCING POVERTY IN AFRICA: REALISTIC TARGETS FOR THE POST-2015 MDG's AND AGE...
REDUCING POVERTY IN AFRICA: REALISTIC TARGETS FOR THE POST-2015 MDG's AND AGE...Dr Lendy Spires
 
Good practice in donor engagement with civil society creating an enabling env...
Good practice in donor engagement with civil society creating an enabling env...Good practice in donor engagement with civil society creating an enabling env...
Good practice in donor engagement with civil society creating an enabling env...Dr Lendy Spires
 
World Happiness Report 2013
World Happiness Report 2013World Happiness Report 2013
World Happiness Report 2013Dr Lendy Spires
 
Pathways to re engagement through flexible learning options
Pathways to re engagement through flexible learning optionsPathways to re engagement through flexible learning options
Pathways to re engagement through flexible learning optionsDr Lendy Spires
 

Viewers also liked (12)

International marine contractors association vision & strategy
International marine contractors association vision & strategyInternational marine contractors association vision & strategy
International marine contractors association vision & strategy
 
Intensifying cooperation between european implementation agencies
Intensifying cooperation between european implementation agenciesIntensifying cooperation between european implementation agencies
Intensifying cooperation between european implementation agencies
 
Informal Sector in Developed and Less Developed Countries
 Informal Sector in Developed and Less Developed Countries Informal Sector in Developed and Less Developed Countries
Informal Sector in Developed and Less Developed Countries
 
Global Risks 2014 Ninth Edition Insight
Global Risks 2014 Ninth Edition Insight Global Risks 2014 Ninth Edition Insight
Global Risks 2014 Ninth Edition Insight
 
The ILO and the informal sector: an institutional history
The ILO and the informal sector: an institutional historyThe ILO and the informal sector: an institutional history
The ILO and the informal sector: an institutional history
 
REDUCING POVERTY IN AFRICA: REALISTIC TARGETS FOR THE POST-2015 MDG's AND AGE...
REDUCING POVERTY IN AFRICA: REALISTIC TARGETS FOR THE POST-2015 MDG's AND AGE...REDUCING POVERTY IN AFRICA: REALISTIC TARGETS FOR THE POST-2015 MDG's AND AGE...
REDUCING POVERTY IN AFRICA: REALISTIC TARGETS FOR THE POST-2015 MDG's AND AGE...
 
Chapter 7
Chapter 7Chapter 7
Chapter 7
 
Project environment
Project environmentProject environment
Project environment
 
Chapter 5(1)
Chapter 5(1)Chapter 5(1)
Chapter 5(1)
 
Good practice in donor engagement with civil society creating an enabling env...
Good practice in donor engagement with civil society creating an enabling env...Good practice in donor engagement with civil society creating an enabling env...
Good practice in donor engagement with civil society creating an enabling env...
 
World Happiness Report 2013
World Happiness Report 2013World Happiness Report 2013
World Happiness Report 2013
 
Pathways to re engagement through flexible learning options
Pathways to re engagement through flexible learning optionsPathways to re engagement through flexible learning options
Pathways to re engagement through flexible learning options
 

Similar to Defining and Measuring the Informal Sector

Social Networks and Employability in the Tamale Metropolis of the Northern Re...
Social Networks and Employability in the Tamale Metropolis of the Northern Re...Social Networks and Employability in the Tamale Metropolis of the Northern Re...
Social Networks and Employability in the Tamale Metropolis of the Northern Re...Premier Publishers
 
Dinkelman ranchhod minwages_0710
Dinkelman ranchhod minwages_0710Dinkelman ranchhod minwages_0710
Dinkelman ranchhod minwages_0710Dr Lendy Spires
 
Social enterprise - ACM
Social enterprise - ACMSocial enterprise - ACM
Social enterprise - ACMDotionmo7797
 
Study on the Social Policy and Right to Work in Public and Private Sectors in...
Study on the Social Policy and Right to Work in Public and Private Sectors in...Study on the Social Policy and Right to Work in Public and Private Sectors in...
Study on the Social Policy and Right to Work in Public and Private Sectors in...ijtsrd
 
In this inquiry we introduce Denmark 10
In this inquiry we introduce Denmark 10In this inquiry we introduce Denmark 10
In this inquiry we introduce Denmark 10Bill Berg
 
Greece youth unemployment
Greece youth unemploymentGreece youth unemployment
Greece youth unemploymentBrave Skills
 
The Difference between Entrepreneurs and Managers in the Accumulation of Soci...
The Difference between Entrepreneurs and Managers in the Accumulation of Soci...The Difference between Entrepreneurs and Managers in the Accumulation of Soci...
The Difference between Entrepreneurs and Managers in the Accumulation of Soci...ijtsrd
 
Informality, growth, and development in Africa
Informality, growth, and development in Africa Informality, growth, and development in Africa
Informality, growth, and development in Africa Dr Lendy Spires
 
Managing Employee Moonlighting in the Future of Work and Era of the gig Economy
Managing Employee Moonlighting in the Future of Work and Era of the gig EconomyManaging Employee Moonlighting in the Future of Work and Era of the gig Economy
Managing Employee Moonlighting in the Future of Work and Era of the gig EconomyOlayiwola Oladapo
 
Understanding the Informal Sector
Understanding the Informal SectorUnderstanding the Informal Sector
Understanding the Informal SectorDr Lendy Spires
 
The 2019 IPR Future of Work Study
The 2019 IPR Future of Work StudyThe 2019 IPR Future of Work Study
The 2019 IPR Future of Work StudyTaylorThelander
 
The 2019 IPR Future of Work Study
The 2019 IPR Future of Work StudyThe 2019 IPR Future of Work Study
The 2019 IPR Future of Work StudyTaylorThelander
 
Modernizing the informal sector
Modernizing the informal sectorModernizing the informal sector
Modernizing the informal sectorDr Lendy Spires
 
Determinants of types of underemployment in the mi da intervention zones of g...
Determinants of types of underemployment in the mi da intervention zones of g...Determinants of types of underemployment in the mi da intervention zones of g...
Determinants of types of underemployment in the mi da intervention zones of g...Alexander Decker
 
People Write Research Essays In Order To.pdf
People Write Research Essays In Order To.pdfPeople Write Research Essays In Order To.pdf
People Write Research Essays In Order To.pdfAna Hall
 
A Report on Unemployment - A basic study
A Report on Unemployment  - A basic studyA Report on Unemployment  - A basic study
A Report on Unemployment - A basic studyDhanya Pravin
 

Similar to Defining and Measuring the Informal Sector (20)

Policy on Labor Cconomics
Policy on Labor CconomicsPolicy on Labor Cconomics
Policy on Labor Cconomics
 
Wp2014 052
Wp2014 052Wp2014 052
Wp2014 052
 
Social Networks and Employability in the Tamale Metropolis of the Northern Re...
Social Networks and Employability in the Tamale Metropolis of the Northern Re...Social Networks and Employability in the Tamale Metropolis of the Northern Re...
Social Networks and Employability in the Tamale Metropolis of the Northern Re...
 
Levelling Up Public Relations
Levelling Up Public RelationsLevelling Up Public Relations
Levelling Up Public Relations
 
Dinkelman ranchhod minwages_0710
Dinkelman ranchhod minwages_0710Dinkelman ranchhod minwages_0710
Dinkelman ranchhod minwages_0710
 
Social enterprise - ACM
Social enterprise - ACMSocial enterprise - ACM
Social enterprise - ACM
 
Study on the Social Policy and Right to Work in Public and Private Sectors in...
Study on the Social Policy and Right to Work in Public and Private Sectors in...Study on the Social Policy and Right to Work in Public and Private Sectors in...
Study on the Social Policy and Right to Work in Public and Private Sectors in...
 
Enterprenuaship 1
Enterprenuaship 1Enterprenuaship 1
Enterprenuaship 1
 
In this inquiry we introduce Denmark 10
In this inquiry we introduce Denmark 10In this inquiry we introduce Denmark 10
In this inquiry we introduce Denmark 10
 
Greece youth unemployment
Greece youth unemploymentGreece youth unemployment
Greece youth unemployment
 
The Difference between Entrepreneurs and Managers in the Accumulation of Soci...
The Difference between Entrepreneurs and Managers in the Accumulation of Soci...The Difference between Entrepreneurs and Managers in the Accumulation of Soci...
The Difference between Entrepreneurs and Managers in the Accumulation of Soci...
 
Informality, growth, and development in Africa
Informality, growth, and development in Africa Informality, growth, and development in Africa
Informality, growth, and development in Africa
 
Managing Employee Moonlighting in the Future of Work and Era of the gig Economy
Managing Employee Moonlighting in the Future of Work and Era of the gig EconomyManaging Employee Moonlighting in the Future of Work and Era of the gig Economy
Managing Employee Moonlighting in the Future of Work and Era of the gig Economy
 
Understanding the Informal Sector
Understanding the Informal SectorUnderstanding the Informal Sector
Understanding the Informal Sector
 
The 2019 IPR Future of Work Study
The 2019 IPR Future of Work StudyThe 2019 IPR Future of Work Study
The 2019 IPR Future of Work Study
 
The 2019 IPR Future of Work Study
The 2019 IPR Future of Work StudyThe 2019 IPR Future of Work Study
The 2019 IPR Future of Work Study
 
Modernizing the informal sector
Modernizing the informal sectorModernizing the informal sector
Modernizing the informal sector
 
Determinants of types of underemployment in the mi da intervention zones of g...
Determinants of types of underemployment in the mi da intervention zones of g...Determinants of types of underemployment in the mi da intervention zones of g...
Determinants of types of underemployment in the mi da intervention zones of g...
 
People Write Research Essays In Order To.pdf
People Write Research Essays In Order To.pdfPeople Write Research Essays In Order To.pdf
People Write Research Essays In Order To.pdf
 
A Report on Unemployment - A basic study
A Report on Unemployment  - A basic studyA Report on Unemployment  - A basic study
A Report on Unemployment - A basic study
 

Recently uploaded

Call Girls Service AECS Layout Just Call 7001305949 Enjoy College Girls Service
Call Girls Service AECS Layout Just Call 7001305949 Enjoy College Girls ServiceCall Girls Service AECS Layout Just Call 7001305949 Enjoy College Girls Service
Call Girls Service AECS Layout Just Call 7001305949 Enjoy College Girls Servicenarwatsonia7
 
(官方原版办理)BU毕业证国外大学毕业证样本
(官方原版办理)BU毕业证国外大学毕业证样本(官方原版办理)BU毕业证国外大学毕业证样本
(官方原版办理)BU毕业证国外大学毕业证样本mbetknu
 
2024: The FAR, Federal Acquisition Regulations - Part 26
2024: The FAR, Federal Acquisition Regulations - Part 262024: The FAR, Federal Acquisition Regulations - Part 26
2024: The FAR, Federal Acquisition Regulations - Part 26JSchaus & Associates
 
Take action for a healthier planet and brighter future.
Take action for a healthier planet and brighter future.Take action for a healthier planet and brighter future.
Take action for a healthier planet and brighter future.Christina Parmionova
 
Call Girls Service Race Course Road Just Call 7001305949 Enjoy College Girls ...
Call Girls Service Race Course Road Just Call 7001305949 Enjoy College Girls ...Call Girls Service Race Course Road Just Call 7001305949 Enjoy College Girls ...
Call Girls Service Race Course Road Just Call 7001305949 Enjoy College Girls ...narwatsonia7
 
Panet vs.Plastics - Earth Day 2024 - 22 APRIL
Panet vs.Plastics - Earth Day 2024 - 22 APRILPanet vs.Plastics - Earth Day 2024 - 22 APRIL
Panet vs.Plastics - Earth Day 2024 - 22 APRILChristina Parmionova
 
Call Girls Rohini Delhi reach out to us at ☎ 9711199012
Call Girls Rohini Delhi reach out to us at ☎ 9711199012Call Girls Rohini Delhi reach out to us at ☎ 9711199012
Call Girls Rohini Delhi reach out to us at ☎ 9711199012rehmti665
 
Earth Day 2024 - AMC "COMMON GROUND'' movie night.
Earth Day 2024 - AMC "COMMON GROUND'' movie night.Earth Day 2024 - AMC "COMMON GROUND'' movie night.
Earth Day 2024 - AMC "COMMON GROUND'' movie night.Christina Parmionova
 
Action Toolkit - Earth Day 2024 - April 22nd.
Action Toolkit - Earth Day 2024 - April 22nd.Action Toolkit - Earth Day 2024 - April 22nd.
Action Toolkit - Earth Day 2024 - April 22nd.Christina Parmionova
 
YHR Fall 2023 Issue (Joseph Manning Interview) (2).pdf
YHR Fall 2023 Issue (Joseph Manning Interview) (2).pdfYHR Fall 2023 Issue (Joseph Manning Interview) (2).pdf
YHR Fall 2023 Issue (Joseph Manning Interview) (2).pdfyalehistoricalreview
 
Call Girl Benson Town - Phone No 7001305949 For Ultimate Sexual Urges
Call Girl Benson Town - Phone No 7001305949 For Ultimate Sexual UrgesCall Girl Benson Town - Phone No 7001305949 For Ultimate Sexual Urges
Call Girl Benson Town - Phone No 7001305949 For Ultimate Sexual Urgesnarwatsonia7
 
##9711199012 Call Girls Delhi Rs-5000 UpTo 10 K Hauz Khas Whats Up Number
##9711199012 Call Girls Delhi Rs-5000 UpTo 10 K Hauz Khas  Whats Up Number##9711199012 Call Girls Delhi Rs-5000 UpTo 10 K Hauz Khas  Whats Up Number
##9711199012 Call Girls Delhi Rs-5000 UpTo 10 K Hauz Khas Whats Up NumberMs Riya
 
VIP Call Girls Doodh Bowli ( Hyderabad ) Phone 8250192130 | ₹5k To 25k With R...
VIP Call Girls Doodh Bowli ( Hyderabad ) Phone 8250192130 | ₹5k To 25k With R...VIP Call Girls Doodh Bowli ( Hyderabad ) Phone 8250192130 | ₹5k To 25k With R...
VIP Call Girls Doodh Bowli ( Hyderabad ) Phone 8250192130 | ₹5k To 25k With R...Suhani Kapoor
 
13875446-Ballistic Missile Trajectories.ppt
13875446-Ballistic Missile Trajectories.ppt13875446-Ballistic Missile Trajectories.ppt
13875446-Ballistic Missile Trajectories.pptsilvialandin2
 
Call Girls Connaught Place Delhi reach out to us at ☎ 9711199012
Call Girls Connaught Place Delhi reach out to us at ☎ 9711199012Call Girls Connaught Place Delhi reach out to us at ☎ 9711199012
Call Girls Connaught Place Delhi reach out to us at ☎ 9711199012rehmti665
 
productionpost-productiondiary-240320114322-5004daf6.pptx
productionpost-productiondiary-240320114322-5004daf6.pptxproductionpost-productiondiary-240320114322-5004daf6.pptx
productionpost-productiondiary-240320114322-5004daf6.pptxHenryBriggs2
 
Enhancing Indigenous Peoples' right to self-determination in the context of t...
Enhancing Indigenous Peoples' right to self-determination in the context of t...Enhancing Indigenous Peoples' right to self-determination in the context of t...
Enhancing Indigenous Peoples' right to self-determination in the context of t...Christina Parmionova
 
VIP Greater Noida Call Girls 9711199012 Escorts Service Noida Extension,Ms
VIP Greater Noida Call Girls 9711199012 Escorts Service Noida Extension,MsVIP Greater Noida Call Girls 9711199012 Escorts Service Noida Extension,Ms
VIP Greater Noida Call Girls 9711199012 Escorts Service Noida Extension,Msankitnayak356677
 

Recently uploaded (20)

Call Girls Service AECS Layout Just Call 7001305949 Enjoy College Girls Service
Call Girls Service AECS Layout Just Call 7001305949 Enjoy College Girls ServiceCall Girls Service AECS Layout Just Call 7001305949 Enjoy College Girls Service
Call Girls Service AECS Layout Just Call 7001305949 Enjoy College Girls Service
 
(官方原版办理)BU毕业证国外大学毕业证样本
(官方原版办理)BU毕业证国外大学毕业证样本(官方原版办理)BU毕业证国外大学毕业证样本
(官方原版办理)BU毕业证国外大学毕业证样本
 
2024: The FAR, Federal Acquisition Regulations - Part 26
2024: The FAR, Federal Acquisition Regulations - Part 262024: The FAR, Federal Acquisition Regulations - Part 26
2024: The FAR, Federal Acquisition Regulations - Part 26
 
Take action for a healthier planet and brighter future.
Take action for a healthier planet and brighter future.Take action for a healthier planet and brighter future.
Take action for a healthier planet and brighter future.
 
Call Girls Service Race Course Road Just Call 7001305949 Enjoy College Girls ...
Call Girls Service Race Course Road Just Call 7001305949 Enjoy College Girls ...Call Girls Service Race Course Road Just Call 7001305949 Enjoy College Girls ...
Call Girls Service Race Course Road Just Call 7001305949 Enjoy College Girls ...
 
Panet vs.Plastics - Earth Day 2024 - 22 APRIL
Panet vs.Plastics - Earth Day 2024 - 22 APRILPanet vs.Plastics - Earth Day 2024 - 22 APRIL
Panet vs.Plastics - Earth Day 2024 - 22 APRIL
 
Call Girls Rohini Delhi reach out to us at ☎ 9711199012
Call Girls Rohini Delhi reach out to us at ☎ 9711199012Call Girls Rohini Delhi reach out to us at ☎ 9711199012
Call Girls Rohini Delhi reach out to us at ☎ 9711199012
 
Earth Day 2024 - AMC "COMMON GROUND'' movie night.
Earth Day 2024 - AMC "COMMON GROUND'' movie night.Earth Day 2024 - AMC "COMMON GROUND'' movie night.
Earth Day 2024 - AMC "COMMON GROUND'' movie night.
 
Action Toolkit - Earth Day 2024 - April 22nd.
Action Toolkit - Earth Day 2024 - April 22nd.Action Toolkit - Earth Day 2024 - April 22nd.
Action Toolkit - Earth Day 2024 - April 22nd.
 
YHR Fall 2023 Issue (Joseph Manning Interview) (2).pdf
YHR Fall 2023 Issue (Joseph Manning Interview) (2).pdfYHR Fall 2023 Issue (Joseph Manning Interview) (2).pdf
YHR Fall 2023 Issue (Joseph Manning Interview) (2).pdf
 
The Federal Budget and Health Care Policy
The Federal Budget and Health Care PolicyThe Federal Budget and Health Care Policy
The Federal Budget and Health Care Policy
 
Call Girl Benson Town - Phone No 7001305949 For Ultimate Sexual Urges
Call Girl Benson Town - Phone No 7001305949 For Ultimate Sexual UrgesCall Girl Benson Town - Phone No 7001305949 For Ultimate Sexual Urges
Call Girl Benson Town - Phone No 7001305949 For Ultimate Sexual Urges
 
##9711199012 Call Girls Delhi Rs-5000 UpTo 10 K Hauz Khas Whats Up Number
##9711199012 Call Girls Delhi Rs-5000 UpTo 10 K Hauz Khas  Whats Up Number##9711199012 Call Girls Delhi Rs-5000 UpTo 10 K Hauz Khas  Whats Up Number
##9711199012 Call Girls Delhi Rs-5000 UpTo 10 K Hauz Khas Whats Up Number
 
VIP Call Girls Doodh Bowli ( Hyderabad ) Phone 8250192130 | ₹5k To 25k With R...
VIP Call Girls Doodh Bowli ( Hyderabad ) Phone 8250192130 | ₹5k To 25k With R...VIP Call Girls Doodh Bowli ( Hyderabad ) Phone 8250192130 | ₹5k To 25k With R...
VIP Call Girls Doodh Bowli ( Hyderabad ) Phone 8250192130 | ₹5k To 25k With R...
 
13875446-Ballistic Missile Trajectories.ppt
13875446-Ballistic Missile Trajectories.ppt13875446-Ballistic Missile Trajectories.ppt
13875446-Ballistic Missile Trajectories.ppt
 
Call Girls In Rohini ꧁❤ 🔝 9953056974🔝❤꧂ Escort ServiCe
Call Girls In  Rohini ꧁❤ 🔝 9953056974🔝❤꧂ Escort ServiCeCall Girls In  Rohini ꧁❤ 🔝 9953056974🔝❤꧂ Escort ServiCe
Call Girls In Rohini ꧁❤ 🔝 9953056974🔝❤꧂ Escort ServiCe
 
Call Girls Connaught Place Delhi reach out to us at ☎ 9711199012
Call Girls Connaught Place Delhi reach out to us at ☎ 9711199012Call Girls Connaught Place Delhi reach out to us at ☎ 9711199012
Call Girls Connaught Place Delhi reach out to us at ☎ 9711199012
 
productionpost-productiondiary-240320114322-5004daf6.pptx
productionpost-productiondiary-240320114322-5004daf6.pptxproductionpost-productiondiary-240320114322-5004daf6.pptx
productionpost-productiondiary-240320114322-5004daf6.pptx
 
Enhancing Indigenous Peoples' right to self-determination in the context of t...
Enhancing Indigenous Peoples' right to self-determination in the context of t...Enhancing Indigenous Peoples' right to self-determination in the context of t...
Enhancing Indigenous Peoples' right to self-determination in the context of t...
 
VIP Greater Noida Call Girls 9711199012 Escorts Service Noida Extension,Ms
VIP Greater Noida Call Girls 9711199012 Escorts Service Noida Extension,MsVIP Greater Noida Call Girls 9711199012 Escorts Service Noida Extension,Ms
VIP Greater Noida Call Girls 9711199012 Escorts Service Noida Extension,Ms
 

Defining and Measuring the Informal Sector

  • 1. IZA DP No. 2473 On Defining and Measuring the Informal Sector Andrew Henley G. Reza Arabsheibani Francisco G. Carneiro D I S C U S S I O N P A P E R S E R I E S Forschungsinstitut zur Zukunft der Arbeit Institute for the Study of Labor November 2006
  • 2. On Defining and Measuring the Informal Sector Andrew Henley University of Wales Swansea G. Reza Arabsheibani University of Wales Swansea, WELMERC and IZA Bonn Francisco G. Carneiro World Bank and Universidade Catolica de Brasilia Discussion Paper No. 2473 November 2006 IZA P.O. Box 7240 53072 Bonn Germany Phone: +49-228-3894-0 Fax: +49-228-3894-180 E-mail: iza@iza.org Any opinions expressed here are those of the author(s) and not those of the institute. Research disseminated by IZA may include views on policy, but the institute itself takes no institutional policy positions. The Institute for the Study of Labor (IZA) in Bonn is a local and virtual international research center and a place of communication between science, politics and business. IZA is an independent nonprofit company supported by Deutsche Post World Net. The center is associated with the University of Bonn and offers a stimulating research environment through its research networks, research support, and visitors and doctoral programs. IZA engages in (i) original and internationally competitive research in all fields of labor economics, (ii) development of policy concepts, and (iii) dissemination of research results and concepts to the interested public. IZA Discussion Papers often represent preliminary work and are circulated to encourage discussion. Citation of such a paper should account for its provisional character. A revised version may be available directly from the author.
  • 3. IZA Discussion Paper No. 2473 November 2006 ABSTRACT On Defining and Measuring the Informal Sector* A range of alternative empirical definitions of informal activity have been employed in the literature. Choice of definition is often dictated by data availability. Different definitions may imply very different conceptual understandings of informality. This paper investigates the degree of congruence between three definitions of informality based on employment contract registration, on social security protection and the characteristics of the employer and employment using Brazilian household survey data for the period 1992 to 2001. 64% of the economically active are informal according to at least one definition, but only 40% are informal according to all three. Steady compositional changes have been taking place amongst informal workers, conditional on definition. Econometric analysis reveals that the conditional impact of particular factors (demographic, educational attainment, family circumstances) on the likelihood of informality varies considerably from one definition to another. Results suggest growing heterogeneity within the informal sector. Informal activity may be as much associated with entrepreneurial dynamism as with any desire to avoid costly contract registration and social protection. However there is no a priori reason for entrepreneurial activity to be unprotected. Results in the paper confirm this. Consequently definitions of informality based on occupation and employer size seem the most arbitrary in practice even if conceptually well-founded. JEL Classification: J21, J42 Keywords: informal employment, social protection, self-employment, entrepreneurship Corresponding author: G. Reza Arabsheibani School of Business and Economics University of Wales Swansea Singleton Park Swansea SA2 8PP United Kingdom E-mail: g.arabsheibani@swansea.ac.uk * The findings, interpretations, and conclusions in this paper are entirely those of the authors only. They do not necessarily represent the view of the World Bank, its Executive Directors, or the countries they represent.
  • 4. On Defining and Measuring the Informal Sector 1. Introduction The growth and scale of informal employment in many developing countries has been traditionally attributed to the displacement of workers into insecure forms of labour market attachment as the only feasible alternative to unemployment (Fields, 1975; Mazumdar, 1976). More recently a number of authors (Pradhan and van Soest, 1995, 1997; Cohen and House, 1996; Marcoullier et al., 1997; Maloney, 1999; Saavedra and Chong, 1999; Gong and van Soest, 2002) question this interpretation of informality, by calling into doubt the idea that the existence of informal and formal sectors is a manifestation of “dualism” in the labour market.1 A further strand of research has highlighted the dynamic “micro-entrepreneurial” nature of informal economic activity (Cunningham and Maloney, 2001; Maloney, 2004; Pisani and Pagan, 2004). This view of informality is well-established and can be traced back to the work of Hart (1972). A final view (and one which we do not address in the present paper) concerns the relationship between informality and illegal or tax-evading activity (see Gerxhani, 2004, and Loayza et al., 2005).2 Each of these alternative views shares in common the idea that informal activity may be freely chosen by some workers. These individuals either perceive state social protection to be poor “value for money” or do not wish to have the conditions of their employment relationship (such as hours of work) restricted by tight state labour market regulation. Alternatively, they may be attracted by the prospective job satisfaction or income stream associated with a successful transition into entrepreneurship, or may perceive the relative benefits of illegal or unregistered activity to outweigh the risks of detection. 1
  • 5. The size of the informal sector is of particular interest to economic policy makers concerned to promote the development of a micro-entrepreneurial sector. This concern arises because of its perceived contribution to dynamic economic efficiency, possibly as a response to growing competitive pressures brought about by trade liberalization. On the other hand policy makers may be concerned that significant numbers, perhaps even a majority of workers in developing countries have little or no social security provision. This means that they have little on which to fall back in the event of illness, unemployment or old age, beyond personal wealth and extended family support. A narrower but nevertheless important concern may be to reduce informality in order to widen the base of direct taxation. This discussion of alternative perspectives on informality brings into sharp focus the question of the most appropriate way to define and measure the informal sector. This is a question which has attracted little or no detailed attention in the literature. The purpose of the present paper is to attempt to redress this. This lack of attention may arise from the paucity of data on a sector which by its nature is problematic to define. Thus, researchers tend to fall back on the pragmatic and judicial use of data on employment status and sectoral affiliation. There is little discussion of the sensitivity of any conclusions drawn to issues of measurement and definition. An implicit assumption is that international comparisons of the scale of informality, which may be based on very different empirical definitions, are valid. Over the last 20 years or so the growing availability of household and living standards surveys has improved the evidence base for many developing economies. However, such surveys are typically not sufficiently rich to permit an evaluation of alternative definitions of informality. Household survey data available for Brazil (the Pesquisa Nacional por Amostra de Domicílios - PNAD) is a notable exception to this. Large scale annual household surveys 2
  • 6. contain detailed information on individual household member economic status. They permit some comparison of alternative informality definitions. Firstly, individual informality can be examined at the level of employer compliance with state labour market regulation through the possession of a registered labour contract (signed labour card). Secondly, informality can be examined at the level of individual social protection coverage, through membership of a social security institute. Finally, informality can be examined, as it is in many studies for which information on contract registration and social protection coverage is non-existent, by addressing the scale of micro-entrepreneurship activity. In practice, this means an examination of individual employment status (type of employment or self-employment) combined with information, if employed or an employer, on the sector and scale of the business activity. A comparative descriptive investigation of the sets of individuals defined as informal according to these different definitions reveals some substantial similarities, such as in demographic and educational status. However, a multivariate (probit) analysis reveals that some characteristics are more strongly associated with one measure of informality than another. For example, educational attainment is far more strongly associated with social security institute membership, and with informality defined according to employment status and activity than it is with the measure of informality based on compliance with labour regulation. On the other hand, social security institute membership appears to be less strongly associated with the demographic and informal status of others within the household. So the main conclusion to be drawn from this research is that the precise definition of informality does matter. It cannot be assumed that alternative definitions are broadly consistent, and that the conclusions drawn from any detailed analysis or modeling of 3
  • 7. informality will be robust to definitional choice. This is particularly important given recent developments in the debate on the subject. Any particular choice of definition or measurement may be conditioned by a priori perspectives or hypotheses about the nature and role of the informal sector. The remainder of the paper is structured as follows. Section 2 provides a more detailed discussion of the existing literature and in particular on the way in which informality has been defined and measured. Section 3 discusses the Brazilian data source used and the different measures of informality which are analyzed. Section 4 provides some descriptive analysis and discussion of these measures. Section 5 documents a multivariate analysis to investigate commonalities and differences in the way in which the different indicators of informality are associated with demographic, employment and household characteristics. Section 6 provides a concluding discussion. 2. Defining Informality The practice of defining informality in terms of the economic status of the individual (self-employed or own-account worker, domestic worker, small scale employer etc.) in conjunction with the characteristics of the employer (small scale, no collective bargaining etc.) is well-established in the literature. A substantial number of early analyses of informality simply assume that the informal sector corresponds to sole-traders (own account workers) and those in small or micro enterprises. “Small” or “micro” is defined arbitrarily and may depend on questionnaire design. For example, from recent research which makes use of such a definition of informality, Prahan and van Soest (1995, 1997) and Maloney (1999) use a definition of fewer than six employees for Bolivia and Mexico respectively; 4
  • 8. Funkhouser (1996) uses fewer than five employees for an analysis of five Central American economies; Marcoullier et al. (1997) use fewer than six for Mexico and Peru; Cohen and House (1996) use fewer than 20 for Sudan; Livingstone (1991) uses fewer than ten for Kenya. Galli and Kucera (2004) undertake an international comparative study across 14 Latin America countries. They employ a definition adopted by the ILO based on employees in firms of either fewer than 5 or 10 employees (depending on the country). Comparability is compromised because of limited detailed information on the size distribution of firms. Where authors have been particularly concerned to highlight the role of informality in promoting entrepreneurship this definitional approach has been explicitly preferred over alternatives. However the attractiveness of defining informality as equivalent to the “entrepreneurial” sector side-steps the important conceptual question of how large does an establishment have to become for it to cease to be part of the dynamic, entrepreneurial sector. Some authors have introduced a further distinction into the definition of the informal sector by including some industrial activities and excluding others (most notably professional service activities). A shortcoming of this approach is that it excludes the possibility, even if it is an unlikely one, that some employees in small establishments may have contracts of employment which conform to labour market regulations and may contribute to social insurance schemes. It also excludes the possibility that some large private sector employers may not provide registered employment contracts or encourage employee contributions to social insurance schemes. Similar objections might apply to domestic and temporary workers who are often entirely classified as informal. The economic significance attached to whether an employment relationship conforms to state labour contracting regulations depends on the degree to which those regulations 5
  • 9. impart inflexibility in the extent to which both parties can tailor the terms and conditions of employment to their best advantage. So, for example, if regulations permit flexible hours of work with no effective upper constraint then the economic impact of signing a formal contract compared to working informally may be less, and the rationality for participating in the informal sector reduced. The existence of significant lay-off costs if a formal contract is terminated may be one of the main factors pushing employers towards offering informal employment (see World Bank, 2002 on the case of Brazil). The argument that both employees and employers may prefer to enter into either unregistered or registered employment relationships will hinge on the balance of the advantages and disadvantages. This is the central argument behind recent work (such as Maloney 2004) which rejects the traditional view that the informal sector is a labour market segment populated by displaced workers queuing for good jobs in the rationed formal sector. Perhaps the most persuasive evidence in support of this is in Maloney (1999). He uses Mexican panel data to examine between-sector and within-sector transitions. The definition of informality used in this research is based on establishment size rather than contract status. However, no evidence is found to support the proposition that those newly entering informal employment are more likely to be young, displaced workers waiting for better jobs. So contract status should provide a good discriminator for informal status if the allocation of workers to the informal sector is governed by a free assessment of the costs and benefits of labour contract registration. Informality should therefore be defined not according to the nature of the job or the employer but according to the worker’s legal status. But in practice the informal sector may exist for a complicated mix of reasons. Some workers may choose to be there because jobs are more flexible or because self-employment is more attractive whereas others may be displaced involuntarily into the sector. 6
  • 10. The practical problem with defining informality in terms of illegal employment is that data may simply not exist on contract status. This is particularly so if the employee does not know for certain whether the employer is conforming to employment regulations, something that might be more likely in the case of temporary workers. For the self-employed or for own-account agricultural workers such a definition may have no relevance since an own-account worker cannot contract with themselves. In some countries, of which Brazil is a notable example, employers are required to indicate to workers that the employment relationship is legally registered. So a third party such as a statistical agency can establish this with a reasonable degree of accuracy. It therefore follows that the informal sector in Brazil has attracted particular attention from researchers. Where information on contract status is not available or relevant, the principal alternative definition of informality is one defined by social protection status. The paper that is widely regarded as the seminal empirical study of the informal sector (Merrick, 1976) employs this definition. Merrick’s study is of the urban labour market of Belo Horizonte in central eastern Brazil. For employed workers informality is defined by the lack of membership of a social security institute. Subsequent work which has adopted the criterion of no social protection or non-payment of social security taxes for distinguishing informal employees includes Portes et al. (1986), Marcouiller et al. (1997), Maloney (1999) and Saavedra and Chong (1999). Absence of social protection is regarded as an important indicator of informality, focusing attention on the potential costs of informality to employees in the event of adverse economic circumstances. The consequences of informality so defined may depend on the economic position of the individual within the household: that is whether they are the main or secondary earner. It may also depend on the social protection status of 7
  • 11. other household members. This definition also focuses attention on the inefficiency of social protection systems as a possible driver of the growth in informality. However, typical household or individual surveys used to investigate informality may not provide information on the social security status of the self-employed or small employers. So studies often rely on a “hybrid” definition of informality in which employees are classified according to social security status. Own-account workers are classified as entirely informal and employers are classified according to either the size of their business (number of employees), the activity of the business, or both. A small number of previous studies have investigated the sensitivity of measured rates of informality to choice of definition. Marcouiller et al. (1997) compare the size of the informal sectors in El Salvador, Peru and Mexico using definitions based on firm-size3 and on non-payment of social security taxes. The latter definition produces a considerably higher estimate of the size of the informal sector (43.2% compared to 30.8% of workers in the case of Mexico in 1990). However, depending on country, between 89 and 97% of the self-employed and small-firm employees do not pay social security taxes. This definition is preferred for the econometric analysis of the wage differential between the two sectors because it is more comprehensive. Saavedra and Chong (1999) similarly find the informal sector to be larger when defined according to social security coverage rather than firm size (54.8% compared to 53.3% in Peru in 1995). Although this difference is not as great as in the Marcouiller et al. study, the two definitions in this case display substantially different trend and cyclical behaviour. The authors take the view that the social security definition is more useful because it shows informality falling with economic growth around a counter-cyclical movement. They use this definition in subsequent analysis of the earnings differential between the two sectors. 8
  • 12. A third more recent paper, Gong et al. (2000), examines the scale of informality in Mexico over the period 1992 to 1995 using various definitions. Defining informality according to job type (self-employed plus piece-rate workers) provides an estimate of 37.6% for the rate of informality. Defining informality according to firm size (less than six employees) provides an estimate of 30.4%. 89% of informal workers according to either definition have no social security coverage, whereas only 26.2% and 19.2% of those classified as formal under the job type and firm size definitions respectively had no social security coverage. In subsequent econometric work on sector transitions Gong and van Soest (2002) find that the job type definition is preferred.4 These findings tend to suggest that there is varying correspondence between alternative definitions of informality. It would therefore be surprising if econometric analyses modelling allocation between sectors or sector earnings differentials were robust to choice of definition. 3. Measuring Informality in Brazil Many commentators express a belief that the informal sector in Brazil is large and growing, despite trade liberalization and successful macroeconomic stabilization over the last 15 years. For example, Carneiro (1997) reports that, although in the late 1980s the Brazilian economy appeared to stagnate, unemployment rates remained low and total employment (formal and informal) continued expanding. In 1988, prior to trade liberalization and at a time of chronic price instability, the Brazilian statistical agency (IBGE) estimated that 13% of GDP was generated in the informal or unregistered economy. Within the service economy this proportion was estimated as high as 30%, suggesting that the overall estimate may well have been conservative (Carneiro, 1997). 9
  • 13. The achievement of macroeconomic stability in Brazil that followed the successful adoption of the Plano Real in 1994 might have removed some of the pressure for economic activity to migrate into the informal sector. On the other hand trade liberalization in the early 1990s increased competitive pressures in the tradeable sectors of the economy. But recent research finds little or no relationship in Brazil between trade liberalization and informal employment, defined according to labour contract status (Goldberg and Pavcnik, 2003). Furthermore, constitutional reform in 1988 may have simultaneously decreased flexibility in the formal labour market (Barros and Corseuil, 2001). This implies that the emerging pattern of development in the informal sector may be complex. Regulation of the labour market in Brazil can be traced back to the enactment of the Labour Code of 1943. This mandates official registration of all contracts of employment through the requirement of employers to provide a signed labour card (“carteira de trabalho assinada”). The card contains a statement of the terms of employment to all employees. Registration of a labour contract confers a legal entitlement to a range of contract terms including a maximum working week (currently 44 hours), paid vacations, maternity leave, due notice of dismissal (proportional to seniority)5, a minimum overtime premium and an entitlement to compensation in the event of a non-justified dismissal. Dismissal compensation is paid from the Fundo de Garantia por Tempo de Serviço (FGTS) accumulated by every worker with a signed labour card. The employer contributes an amount equivalent to 8% of the employee’s current monthly wage. The employee receives a penalty of 40% of the employer’s cumulative contribution in the event of dismissal without just cause. This penalty was increased from 10% by the 1988 Constitution. As Barros and Corseuil (2001) note, the effect of the change was to reduce the length of tenure needed to accumulate a compensation 10
  • 14. amount equal to one month’s salary from at least 10 years to only two and a half years. At face value this would appear to amount to a substantial increase in employer firing costs, although in practice it creates the potential for collusion between employers and employees to register voluntary quits as dismissals. Thus, it creates an incentive to quit on the part of employees. Barros and Corseuil (2001) and Camargo (2002) cite evidence in support of this. In short there may be a strong disincentive for employers to register contracts, but, once registered, employers and employees face incentives which increase turnover. Social protection beyond dismissal compensation in Brazil is provided through individual employee membership of a social security institute (Instituto de Previdência). Protected workers pay monthly contributions on a graduated scale up to a ceiling of 11 per cent, with employers contributing a further 20% of payroll. Membership of an institute provides defined benefit pension provision (up to an upper ceiling), permanent disability benefits and life insurance (survivor) benefits. Workers without social security institute membership qualify for a meager flat rate old age pension equal to the minimum wage. Our investigation of informality draws on detailed information contained with the Brazilian household survey (PNAD). From 1992 the consistent questionnaire structure adopted by the survey allows separate identification of contract registration (labour card) and social protection across an individual’s main and supplementary jobs, alongside detailed information on the type of employment and the size and activity of the business. Surveys were conducted annually with the exception of 1994 (because of austerity associated with the introduction of the Plano Real) and 2000 (the year of the decennial census). 11
  • 15. Table 1 reports summary information on economic activity in main employment for all workers aged between 18 and 65 for each available year. All descriptive analysis makes use of individual sample weights provided by IBGE. In any year just over half of the economically active are engaged in paid employment. This proportion seems quite stable although there is some evidence of an upturn in the proportion towards the very end of the period. However, the proportion of public sector workers, who by definition have registered contracts, falls from 27.4% of employees in 1992 to 23.6% in 2001. The next largest group by economic activity are the self-employed (own-account workers), comprising almost of quarter of the economically active. A further four percent are entrepreneurs employing others. There is some slight evidence that employers as a proportion of the total have risen over the period, but no discernable trend in the proportion of the self-employed. A further 1.1% of the overall total, in 1992, are individuals whose main status is as an employee, but have self-employed or employer status in a second activity. This figure drops slightly to 0.95% in 2001. Thus in 1992 28.4% of economically active adults could be regarded as engaged in some broad form of entrepreneurial activity, either as main or secondary activity. This total remains virtually unchanged at 28.3% in 2001. So overall these data appear to offer little support for rising entrepreneurialism. The fastest growing group as a proportion of the total is domestic workers, rising from 6.2% in 1992 to 7.8% in 2001. This is an employment group traditionally associated with informality, although as we shall see there should be no automatic presumption that domestic workers are unregistered and unprotected. Increasing employment of domestic staff may reflect rising standards of living in Brazil, particularly amongst upper and middle earners. The data allow the identification of three further categories of employment, each of which 12
  • 16. may be regarded as informal: non-remunerated employment (typically in a family business), subsistence agricultural workers and temporary workers. As a proportion of the total each if these is small. For each proportion there is some evidence of a downward trend. In order to assess the possible size of the informal sector we adopt three different definitions to distinguish formality and informality. A (contract status): a worker is defined as formal if they have a signed labour card in any employment. Through its questionnaire routing the PNAD regards all public sector employees as having signed labour cards. Those who are self-employed or employers in their main occupation are classified as formal if they have a signed labour card from another paid second job. B (social security status): a worker is defined as formal if they make contributions to a social security institute (federal, state or municipal) in respect of any employment. The PNAD asks all workers regardless of economic status or sector if they make social security contributions. C (formal activity): a worker is defined as formal if they are employed in an establishment of more than five employees. The self-employed and employers are defined as formal if their occupation is “creative and technical” or “administrative” (to capture “professional” activities). All domestic, non-remunerated, subsistence and temporary workers are defined as informal, along with all the self-employed and employers in occupations other than “creative and technical” and “administrative”. 13
  • 17. 4. Variation in Informality in Brazil Table 2 details the proportions of workers classified as informal under each definition according to economic status. Definition A, based on contract status, provides the largest estimate of the size of informal employment, at between 56 and 58 per cent of all workers. The smallest estimate at around 50% is provided by definition C, in which workers are categorized according to establishment size and occupation. Definition B based on social security status provides an estimate of informal employment at just over 50%. There is no discernable trend in any of the three definitions. Once the data are sub-divided by economic status, wider variation between the definitions is apparent. Turning first to employees, definition C continues to provide the smallest estimate of informal employment at below 20%, but definition B (social security membership) now provides the largest estimate at between 24 and 28%. For all three definitions there is some evidence of an upward trend in informality. This is most pronounced for definition C, where informality rises from 12.8% in 1993 to 16.6% in 2001. For the self-employed only those whose main job is as a registered employee are recorded as formal under definition A, and only those who business activity falls under the two professional occupational categories are classified as formal under definition C. Informal self-employment activity under definition C is falling slightly. Informality declines from 95.5% to 93.0% over the period. Under definition B (no social security protection) less than 80% of the self-employed are informal in 1992. Here there is a clear upward trend. The proportion rises to over 84% by 2001. 14
  • 18. For employers only those few with registered main jobs are classified as formal under definition A. So rates of informality defined by lack of a signed labour card are very high. One third of employers have no social security protection in 1992. This proportion remains at the same level until 1997 when it starts to rise quickly. Under definition C very few employers are classified as informal. In fact up to 1993 the occupational classification defines all employers as “creative and technical” or “administrative”. From 1997 onwards the informal proportion starts to rise. The remaining four groups in Table 2 are all entirely classified as informal under definition C. A significant minority of domestic workers and, to a lesser extent, temporary workers have registered contracts and/or make social security payments. For both groups the proportions which are defined as informal are falling. The proportion of domestic workers with a no signed labour card falls from 79 percent in 1992 to 72 per cent in 2001, and those with no social security coverage from 77 percent to 69 percent. In summary Table 2 reveals some significant differences both between the different definitions we have constructed, and between the experiences of different types of workers. For employees the level of informality is stable, despite the relative decline of public sector employment. For entrepreneurial groups (the self-employed and employers) informality if defined by social security status is increasing. However, if informality is defined according to the nature of the activity, it is falling amongst the self-employed. Informality amongst domestic and temporary workers is also falling. The other feature in Table 2 is that there is incomplete overlap between the different definitions, and for some groups the overlap may be quite limited. In particular the definitions 15
  • 19. of informality based on contract and social security status (A and B) may distinguish very different groups of workers compared to the definition based on activity (definition C). Table 3 reports pairwise correlation coefficients for the three measures. Definitions A and B have a correlation of around 0.8 suggesting a reasonably high, although far from complete, correspondence between the two measures. Definition C has a lower correlation with the other two measures, and particularly with social security status. Figures 1 and 2 explore this point further by providing Venn diagrams to show the correspondence of the three measures across the full sample of the economically active for 1992 and 2001. In both years just under 40 percent of the sample can be defined as informal on all three definitions. Just over 36 percent of the sample in both years can be classified as formal on all three definitions. A total of 13.4% of the sample in 1992 and 12.9% in 2001 can be classified as informal on any two of the three definitions. In particular there is a significant proportion of workers classified as informal on the basis of having no signed labour card and no social security coverage but who fall into the formal category under definition C. A total of 9.9% of the sample in 1992 and 11.0% in 2001 fall into one of the definitions of informality but neither of the other two. The largest element of this group, particularly in 2001, is those who are classified as informal on the basis of activity but have a signed labour card and social protection. Domestic and temporary workers form a significant element of this group. Table 4 reveals the different position of men and women. Across all three definitions informality is increasing amongst men and falling amongst women. The upward trend for men is most pronounced for definition C, to the extent that by 2001 the estimate of male informality on the basis of activity is within 1.2 percentage points of the estimate on the basis of social security coverage. For women the decline in informality is steepest for definition B. There is very little trend in female informality defined by activity. Notice also that there is a 16
  • 20. difference in the orderings of the estimates for men and for women. Male informality is highest when defined by contract status (no signed labour card) and lowest when defined by activity. Female informality is highest when defined by contract status at the beginning of the period but by 2001 is highest when defined by activity. It is lowest when defined by social security status. So Brazil has enjoyed some success in improving social security participation amongst women, but the overall picture has been offset by the worsening position of men. There has been a change in the composition of informal activity towards men, partially offset by women moving into formal activity, as well as a shift in the composition of those without registered contracts towards men. This last shift has been to such an extent that, by 2001, men are more likely than women not to have a registered contract. A breakdown of rates of informality by ethnic group is given in Table 5. The majority of Brazilians describe themselves as being white or of mixed race. Over the period in question the ethnic composition of the economically active population is stable. Lowest rates of informality are observed for whites and Asians (Chinese and other East Asian nationalities). Highest rates of informality are amongst blacks, and particularly, amongst those of mixed race and those from the tiny indigenous population. The rate of informality is stable for whites according to definitions A and B but rises by 3 percentage points over the period for definition C. A similar picture emerges for the mixed race group – slight falls for definitions A and B, but a small rise for definition C. For blacks informality is falling for all three definitions, and most notably for definitions A and B. Amongst the small Asian group informality has risen very fast, particularly according to definition C. This may reflect high rates of nascent entrepreneurship amongst this group. 17
  • 21. Table 6 reveals that informality is very strongly associated with educational attainment. Rates of over 80% are observed for the illiterate. These fall to around a quarter for college graduates. Rates of informality are rising amongst the lower level groups (illiterate and elementary), but against a background of these groups falling fast as a proportion of the total active population. Informality is rising quickly amongst secondary school and college graduates on all three definitions. The reason why informality is rising for many educational sub-groups, although stable for the population as a whole, is because of the relatively stable level of informality amongst the illiterate and elementary groups who are declining rapidly as a proportion of the population. Absolute numbers of uneducated or poorly educated informal workers are falling fast in Brazil. This overall pattern is common to all three informality definitions. However, there are differences in the levels of informality for particular educational groups according to definition. Rates of informality amongst the illiterate are lower for definition C than for A and B. On the other hand rates of informality, defined by no signed labour card, are higher amongst secondary and college educated groups than for the other two definitions. It should be noted that informal exists across the educational spectrum, calling into question the segmentation hypothesis, which would imply that a higher level of education allows transition across the segmentation barrier between informality and formality. Rates of informality in establishments of different sizes according to each definition are given in Table 7. By definition those working in larger establishments (6 or more employees) are classified as formal according to definition C.6 Amongst sole-traders informality has risen significantly when defined by social security institute membership (mirroring the picture in Table 2), but is stable for the other two definitions. For those in very small establishments, that is two or 3 to 5 employees, informality has fallen slightly 18
  • 22. according to definition A but risen according to definition B and, in particular, definition C. Rates of informality defined by contract or social security status have also risen significantly in larger (11+ employee) establishments. These larger establishments employ almost 50% of the workforce. Informality is high amongst those who do not know their establishment size. Lack of information here may correlate with poor educational attainment. In summary Table 7 suggests that informality is increasing in large establishments whereas (in terms of contract status) it is falling in the smallest establishments, and is stable in the middle (establishments with 6 to 10 employees). Table 8 describes rates of informality according to occupation. The occupational breakdown is a broad classification of eight sectors. Rates of informality vary considerably by occupational groups. Informality is high in agricultural, retailing and distribution occupations, and in domestic, personal and catering services groups. It is low in the creative and technical, administrative, and transport and communications groups. Alternative definitions of informality provide in some cases very different pictures of informality by occupational group. Since the self-employed in the creative and technical group are defined according to definition C as formal, then rates of informality according to this definition are very low. Yet it is apparent that numbers without signed labour cards or social security institute membership are much higher and rising over time. In retailing and distribution informality defined according to social security protection is significantly lower than according to the other two definitions. To a lesser extent the same holds for transport and communications occupations. In this sector informality is rising fast according to all three definitions. Informality as measured by definitions A and B is falling in domestic, personal and catering occupations. It is also falling in retailing and distribution. Both of these sectors are growing as a proportion of total employment. 19
  • 23. 5. Multivariate analysis of factors associated with informality Although we have been able to point to differences and similarities between key demographic variables and different definitions of informality, we can say nothing so far about any conditional association between these. This section presents estimates of the marginal effects of different potential influences on the likelihood of informality obtained from probit regressions. The specification of each regression includes individual demographic information, information on the geographical situation of the individual, information on the nature of the employment and information on the economic status of the remainder of the individual’s family. Included under the heading of demographic information are a quadratic function of the individual’s age and a binary indicator for being female and indicators for ethnicity (reference category: white). Indicators of illiteracy and educational attainment are also included (reference category: education to elementary level).7 Two aspects of geographical situation are included. The first is a set of broad regional indicators, defined so that the heavily urbanised and industrialised region of the South East is the reference category. Given that some previous research identifies informality with urbanisation, the second is a binary indicator for residence in an urban location. The urban indicator is a variable derived by the IBGE statistical agency from household address records and corresponds to residence in cities, towns and so-called isolated urban areas. Three aspects of the nature of the individual’s employment are included. A binary indicator of unionisation is included to capture a likely association between collective representation and formality. It is important to uncover the extent to which definitions of informality based on contract and social security status identify individuals predominantly in 20
  • 24. small establishments. So information on the size of the establishment, in the form of a binary indicator for greater than 11 employees is included for regressions to explain definitions A and B. (Since definition C is partly based on establishment size it is not appropriate to include it as an explanatory factor.) Indicators of broad occupational grouping are included to assess the extent to which there may be certain occupational sectors in which employment tends inherently to be less formal. The reference occupation here is a residual category denoted “other”. It includes a range of occupations in the extractive and public (including defence) sectors. Turning to indicators of the economic status of the rest of the family, the first inclusion is a binary indicator for the informal status of the individual’s spouse conditional on being married and economically active. Spousal informality is defined throughout according to definition A for consistently and comparability. We hold no prior hypothesis here. Having a spouse without a registered contract may create a greater incentive to acquire the protection of a formal sector job. On the other hand informal workers may be simply more likely, as a result of a marriage matching process, to have informal sector spouses. For the same reasons the total number of formal employees in the family (i.e. with signed labour cards) is included, as well as the total number of self-employed in the family. The presence of dependents within the family may also influence individual employment decisions or options. So the totals of elderly (i.e. aged 65 and over) and children in the family are included. Finally other family earnings per head is included. This is an indicator of the extent to which the individual workers may rely on income generated elsewhere in the family as an alternative to social protection. 21
  • 25. Table 9 reports estimated marginal effects for each year for definition A (no signed labour card). Threshold levels of statistical significance are indicated – full results are available on request. In general most of the explanatory factors included in the regressions attract statistical significance although there is considerable variation in the importance of particular associations, as indicated by the size of the marginal effects. There is a U-shaped relationship between informality and age. The age at which an individual is most likely to have a signed labour card is in their late 20s, other things equal. Women are 5 percentage points less likely to be informal than men, other things equal. Indigenous and Asian ethnic groups appear more likely to be informal than whites, and blacks less so. However, those of mixed race (the largest non-white group) are no more or less likely than whites to be informal. Illiteracy is positively associated with informality, but only by 6 to 9 percentage points. The marginal effects for the various educational attainment levels do not suggest any qualitatively strong relationship between schooling and informal status. In particular college (first degree) graduates appear no less likely to have a signed labour card than those with only basic schooling, other things equal. The reported marginal effects for the four regions show that informality is higher outside the South East, and in particular in the North and the North East. However, these regional differences appear to be in decline. Urban residents are only slightly less likely to be informal than those in rural areas. On the basis of definition A there is no reason to view informality as a predominantly urban phenomenon. The lack of a signed contract is strongly associated with absence of union representation and with small establishment size. But there is some evidence in the results to suggest that the association with small establishments is also in decline. There is also a strong occupational pattern to the lack of a signed contract, although once again these effects are declining quite significantly over time. Informality as 22
  • 26. defined here is strongest amongst agricultural, production, construction, retailing and distribution occupations. Informal status defined on the basis of contract appears to be weakly complementary with informality elsewhere in the family. If workers have a spouse who is working without a signed labour card then they are 2 to 4 percentage points more likely to be informal themselves. Similarly an increase in the number of formal workers in the family as a whole is associated with a lower likelihood of informality, at a similar order of magnitude. Self-employment activity elsewhere in the family is strongly positively associated with informal contract status. The presence of elderly and children slightly but statistically significantly reduces the likelihood of informal contract status. Higher other family earnings are negatively associated with informality in 1992, but by 1995 are positively associated and remain so until the end of the period in question. There is some evidence that this positive association grows in size. Table 10 reports exactly the same regression specifications for the definition B (no social protection). There are some pronounced differences between these results and those reported in Table 9. The age at which an individual worker is least likely to be informal now increases to the early to mid 40s. Women are now more likely to be informal. Mixed race individuals are significantly more likely than whites to be informal, although the marginal effect indicates that the difference is only between 2 and 4 percentage points. There is now a much stronger negative association between higher educational status and informality. This negative association appears to become stronger towards the end of the period. Urban residents are less likely to be informal and the marginal effects are at least twice as large as those in Table 9. Union status and employment in a large establishment remain quantitatively 23
  • 27. very important, although the negative marginal effect for being with a large employer falls from over 60 percentage points to around 46-47 percentage points. By 2001 the patterns of occupational coefficients are different from those in Table 9. Although agricultural occupations remain far more likely to be informal, the strong positive effects seen for production, construction, retail, distribution and communications are diminished. Under definition B those in administrative occupations are significantly and quantitatively less likely to be informal. Turning to the variables describing the economic status of the family, we observe that the size of the positive relationship with the number of self-employed is the family falls substantially and that the associations with family dependents and other family income cease to be significant. Table 11 reports the results for the definition C based on establishment size and activity. Age remains significantly associated with informality – the age at which informality is least likely is around 30 years, closer to that for definition A than for B. Being female is positively associated with informality – women are 4 to 6 percentage points more likely to be in an informal activity. There is however virtually no significant association between ethnicity and this definition of informality. The association between educational attainment and this definition of informality is, from the pattern of the marginal effects, the most clear of any of the three definitions. Illiteracy is associated with an increase in the probability of informality of between 2 and 7 percentage points, with clear evidence that the conditional impact is rising over time. On the other hand the possession of a college degree reduces the likelihood of this definition of informality by between 14 and 17 percentage points. Again there appears to be a regional pattern to informality, once other factors are held. But the marginal effects are in general much smaller than for the other two definitions. There 24
  • 28. is barely any relationship with urban residence. Geography seems to matter much less if informality is defined according to the characteristics of the employment. Marginal effects for occupation remain statistically significant. However, the negative coefficients for creative and technical and administrative occupations in part arise from the exclusion of all the self-employed in these sectors from this definition of informality. Similarly, the strong positive association with the domestic, personal and catering services sector arises in part from the inclusion of all domestic workers in this definition of informality. The likelihood of being in an informal activity is reduced if the worker’s spouse is informal, although by only a very small amount. However, the sign of this relationship is the opposite of that observed for the other two definitions. Self-employment elsewhere in the family is strongly positively associated with this definition of informality. Marginal effects are three times as large as for definition B and nearer in size to those for definition A. Similarly the negative association between informality and numbers of dependents in the family is similar to that observed for definition A. There is a weak negative association between informal activity and other household income, which is only statistically significant in two of the eight years. This pattern of marginal effects is closest to those for definition B. 6. Conclusions There is no consensus on how to define the phenomenon of labour market informality in developing economies. In many cases researchers’ choice of definition is determined by the availability of data. There has been limited discussion in the literature on whether this matters. We conclude in this paper that it does. Using data from Brazilian household surveys we have constructed three alternative definitions of informality, which attempt to reflect the 25
  • 29. various alternatives used in the literature. Informality is defined according to employment contract status, according to social security protection and, in a manner which is often adopted in previous research, according the nature of the employment and the characteristics of the employer. These three definitions are far from observationally equivalent. Around 64% of all the economically active in Brazil are informal according to at least one of the three definitions, but only 40% are informal according to all three definitions. There is a closer correspondence between “institutional” informality defined by not having a registered employment contract and not contributing to a social security scheme. However substantial numbers of workers are classified as informal if the definition is based on the nature of the employment and the employer, even though they may have registered contracts and/or may contribute towards social security. Even though overall rates of informality appear constant in Brazil through the 1990s, steady compositional changes are taking place. More women are becoming formal, while men are becoming more informal. Rates of informality are falling amongst the least skilled (as they decline in importance as a group) while rates of informality are rising quickly amongst the most skilled (as they increase in importance as a group). There are also occupational changes at work. Informality is rising amongst “higher” occupations and amongst manufacturing and construction groups, whereas it is falling amongst some service occupations, such as shop-workers and domestic staff. The scale of these changes is dependent on the choice of definition. These changes are mirrored in the econometric analysis presented in the paper, as the changing pattern of marginal effects on the likelihood of informality reveals growing heterogeneity within the informal sector. 26
  • 30. However, the most important conclusion to emerge from econometric analysis is that the conditional impact of particular factors on the likelihood of informality varies considerably from one definition to another. Informality defined according to contract status (labour card) is far less strongly associated with lower educational attainment than it is for the other definitions, particular the third definition (activity). There are also important differences in the occupational profile of the informal sector between the definitions. For example “higher level” occupations may not have registered contract, perhaps because they are self-employed or employers, but they do seem to have social protection. Lack of social protection seems to be a rural phenomenon, whereas there is little or no relationship between urban/rural location and the other definitions of informality. The security offered by a registered contract or a large employer seems better to match the family circumstances of those with dependents, but family circumstances do not appear to be strongly associated with social protection. Informal contract status (definition A) and informal activity (definition C) are strongly positively associated with informality elsewhere in the family, especially self-employment. This is not the case for social security status. Each of these points merits further research. In particular these differences suggest that the focus of research should shift towards the particular investigation of why workers choose not to have social protection. On the other hand a different avenue of research should focus on the relationship between entrepreneurial activity and informality. Our third definition of informality, based on the characteristics of the employment and the employer, is in empirical terms the most arbitrary. Yet this definition is conceptually well-founded as it corresponds most closely with the notion that informality is related to the degree of entrepreneurial dynamism in a developing economy. There is no a priori reason for believing that such employment activity should of necessity by unregistered and unprotected, and 27
  • 31. should therefore be regarded as “inferior”. The other strong feature of the data investigated in this paper concerns the growing heterogeneity within the informal sector. The reasons why males and those with high levels of educational attainment seem increasingly likely to be found working without contract registration or social protection, or in “informal activity” merit substantial further analysis. 28
  • 32. Notes: 1 For further discussion on modeling and testing for segmentation see Heckman and Sedlacek (1985) and Magnac (1991). 2 Loayza et al. (2005) argue that a heavier regulatory burden, particularly in product and labour markets, reduces growth and induces informality. They conclude, however, that these effects can be mitigated as the overall institutional framework improves. 3 Informal workers defined as all non-professional self-employed plus all other employees of firms with under five employees (four in the case of El Salvador). 4 Gong et al. (2000) report alternative results based on the firm-size definition in an appendix, but these are omitted from the version of this work subsequently published as Gong and van Soest (2002). The two sets of results are described in the later paper as “qualitatively similar”. No results are reported for a definition based on social security coverage. 5 Prior to the adoption of the 1988 Constitution dismissal notice was fixed at one month. Subsequently it is a minimum of one month rising proportionately with accumulated tenure with the employer. This change is one of the main reasons why Barros and Corseuil (2001) argue that labour market inflexibility may have increased in Brazil. 6 If the respondent reports that the size of the establishment is unknown, we assume that it is greater than five for the purposes of definition C. 7 The structure of the PNAD questionnaire assumes that those who are illiterate must not have received any formal schooling. 29
  • 33. Bibliography Barros, R.P. and Corseuil, C.H. (2001), “The impact of regulations on Brazilian labor market performance”, Research Network Working Paper No. R-427, Inter-American Development Bank. Camargo, J.M. (2002), “Fake contracts: Justice and labor contracts in Brazil”, in World Bank (2002), Brazil: The Jobs Report, Washington, D.C., Report No. 24408-BR. Carneiro, F.G. (1997), “The changing informal labour market in Brazil: cyclicality versus excessive intervention”, Labour, 11(1): 3-22. Cohen, B. and House, W.J. (1996), “Labor market choices, earnings and informal networks in Khartoum, Sudan”, Economic Development and Cultural Change, 44(3): 589-618. Cunningham, W.V. and Maloney, W.F. (2001), “Heterogeneity among Mexico’s microenterprises: an application of factor and cluster analysis”, Economic Development and Cultural Change, 50(1): 131-156. Fields, G.S. (1975), “Rural-urban migration, urban unemployment and underemployment, and job search activity in LDC’s”, Journal of Development Economics, 2: 165-187. Funkhouser, E. (1996), "The urban informal sector in Central America: Household survey evidence", World Development, 24(11):1737-51. Galli, R. and Kucera, D. (2004), “Labor standards and informal employment in Latin America”, World Development, 32(5): 809-828. Gerxhani, K. (2004), “The informal sector in developed and less developed countries: a literature survey”, Public Choice, 120(3-4): 267-300 Goldberg, P.K. and Pavcnik, N. (2003), “The response of the informal sector to trade liberalization”, Journal of Development Economics, 72(2): 463-496. Gong, X., van Soest, A. and Villagomez, E. (2000), “Mobility in the urban labor market: a panel data analysis for Mexico”, CentER Discussion Paper, No. 46, Tilburg University. Gong, X. and van Soest, A. (2002), “Wage differentials and mobility in the urban labour market: a panel data analysis for Mexico”, Labour Economics, 9: 513-529 Hart, K. (1972), Employment, Income and Inequality: A Strategy for Increasing Productive Employment in Kenya, Geneva: ILO. Heckman, J. and Sedlacek, G. (1985), “Heterogeneity, aggregation and market wage functions: an empirical model of self-selection in the labour market”, Journal of Political Economy, 93: 1077-1125. Livingstone, I. (1991), “A reassessment of Kenya’s rural and urban informal sector”, World Development, 19(6): 651-670. 30
  • 34. Loayza, N., A.M. Oviedo, and L. Servén (2005), “The impact of regulation on growth and informality: cross-country evidence”, Policy Research Working Paper No. 3623, The World Bank, Washington, D.C. Magnac, Th. (1991), “Segmented or competitive labor markets”, Econometrica, 59(1): 165- 187. Maloney, W.F. (1999), “Does informality imply segmentation in urban labor markets? Evidence from sectoral transitions in Mexico”, World Bank Economic Review, 13(2): 275- 302. Maloney, W.F. (2004), “Informality revisited”, World Development, 32(7): 1159-1178. Marcoullier, D., Ruiz de Casilla, V. and Woodruff, C. (1997), "Formal measures of the informal-sector wage gap in Mexico, El Salvador, and Peru", Economic Development and Cultural Change, 45(2): 367-92. Mazumdar, D. (1976), “The urban informal sector”, World Development, 4(8): 655-679. Merrick, T.W. (1976), “Employment and earnings in the informal sector in Brazil: the case of Belo Horizonte”, Journal of Developing Areas, 10(3): 337-353. Pisani, M.J. and Pagan, J.A. (2004), “Self-employment in the era of the New Economic Model in Latin America: a case study from Nicaragua”, Entrepreneurship and Regional Development, 16: 335-350. Portes, A., Blitzner, S. and Curtis, J. (1986), “The urban informal sector in Uruguay: its internal structure, characteristics, and effects”, World Development, 14(6): 727-741. Pradhan, M. and van Soest, A. (1995), “Formal and informal sector employment in urban areas of Bolivia”, Labour Economics, 2: 275-297. Pradhan, M. and van Soest, A. (1997), “Household labor supply in urban areas of Bolivia”, Review of Economics and Statistics, 79(2): 300-310. Saavedra, J. and Chong, A. (1999), "Structural reform, institutions and earnings: Evidence from the formal and informal sectors in urban Peru", Journal of Development Studies, 35(4):95-116. World Bank (2002), Brazil: The Jobs Report, Washington, D.C., Report No. 24408-BR. 31
  • 35. Table 1: Employment Status – 18-65 year olds Employment status – main occupation % 1992 1993 1995 1996 1997 1998 1999 2001 Employees 52.6 52.8 51.4 53.2 52.2 52.7 51.7 54.1 Self-employed sole traders 23.2 23.2 24.1 23.6 23.9 24.1 24.1 22.9 Employers 4.1 3.9 4.3 4.0 4.4 4.4 4.3 4.4 Domestic workers 6.2 6.4 7.1 7.1 7.4 7.1 7.5 7.8 Non-remunerated workers 6.5 6.6 6.3 5.9 5.8 5.6 6.1 5.0 Subsistence agricultural 4.4 4.3 4.1 3.7 3.8 3.6 3.7 3.2 Temporary workers 3.1 2.9 2.7 2.5 2.6 2.5 2.5 2.6 Total 100.0 100.0 100.0 100.0 100.0 100.0 100.0 100.0 Source: authors’ computations from PNAD, population weights 32
  • 36. Table 2: Labour card and social security institute status (in any employment) and informal activity by main employment status % 1992 1993 1995 1996 1997 1998 1999 2001 All economically active A. No signed labour card B. No SS Institute member C. Informal activity 56.7 50.7 49.1 56.0 51.4 48.9 57.5 51.8 50.7 56.7 51.7 50.0 57.3 51.7 50.6 56.4 51.8 50.0 57.8 52.1 49.0 56.0 50.4 49.3 Employees A. No signed labour card B. No SS Institute member C. Informal activity 21.1 24.3 12.9 21.2 25.6 12.8 21.8 25.1 14.5 23.2 27.8 15.6 22.9 26.3 15.5 22.8 25.2 15.5 23.8 25.7 15.6 24.0 25.2 16.6 Self-employed sole traders A. No signed labour card B. No SS Institute member C. Informal activity 99.2 79.0 95.5 97.2 79.1 95.2 99.1 80.9 94.7 99.2 79.7 94.4 99.2 81.1 94.3 97.7 83.0 94.0 98.7 87.1 93.8 99.3 84.3 93.0 Employers A. No signed labour card B. No SS Institute member C. Informal activity 98.4 32.6 0.0 97.9 33.0 0.0 97.5 32.3 7.7 97.1 32.8 7.6 97.6 35.4 10.7 97.6 37.3 9.3 97.4 38.2 11.4 97.8 40.0 11.4 Domestic workers A. No signed labour card B. No SS Institute member 78.8 76.6 79.2 77.9 77.5 76.0 74.7 73.8 74.4 73.0 73.0 70.7 72.6 70.5 71.5 69.1 Non-remunerated workers A. Signed labour card B. SS Institute member 99.9 97.7 99.2 97.1 99.8 97.8 99.8 97.1 99.9 97.0 99.3 97.3 99.5 97.4 99.7 96.9 Subsistence agricultural A. No signed labour card B. No SS Institute member 100.0 99.3 100.0 99.4 100.0 99.4 100.0 99.0 100.0 99.2 100.0 99.5 100.0 99.5 100.0 99.5 Temporary workers A. No signed labour card B. No SS Institute member 90.8 91.0 89.6 92.0 89.7 89.5 86.2 86.8 89.2 89.2 89.8 90.8 88.2 88.4 88.7 88.5 Source: authors’ computations from PNAD, population weights 33
  • 37. Table 3: Correlations of informality measures A: No signed labour card B: No SS Institute Membership C: Informal activity 1992: A: No signed labour card 1 B: No SS Institute membership 0.79 1 C: Informal activity 0.68 0.60 1 1993: A: No signed labour card 1 B: No SS Institute membership 0.77 1 C: Informal activity 0.68 0.60 1 1995: A: No signed labour card 1 B: No SS Institute membership 0.79 1 C: Informal activity 0.67 0.60 1 1996: A: No signed labour card 1 B: No SS Institute membership 0.76 1 C: Informal activity 0.65 0.56 1 1997: A: No signed labour card 1 B: No SS Institute membership 0.79 1 C: Informal activity 0.65 0.59 1 1998: A: No signed labour card 1 B: No SS Institute membership 0.81 1 C: Informal activity 0.68 0.58 1 1999: A: No signed labour card 1 B: No SS Institute membership 0.82 1 C: Informal activity 0.68 0.58 1 2001: A: No signed labour card 1 B: No SS Institute membership 0.84 1 C: Informal activity 0.67 0.58 1 34
  • 38. Table 4: Descriptive analysis by informality definition - gender % 1992 1993 1995 1996 1997 1998 1999 2001 Male A: no signed labour card 55.5 54.5 56.6 56.7 57.3 56.6 58.1 56.7 B: no SS membership 47.1 47.9 48.7 49.6 49.8 50.0 50.7 49.4 C: informal activity 43.4 43.3 45.3 45.7 46.0 49.1 49.7 48.2 Female A: no signed labour card B: no SS membership C: informal activity 58.5 56.1 57.9 58.1 56.6 57.5 58.9 56.3 58.6 56.7 54.9 56.7 57.3 54.6 57.6 56.1 53.0 57.5 57.3 54.1 58.6 55.2 51.6 56.8 t-test for difference between men and women A: no signed labour card B: no SS membership C: informal activity 10.1** 28.8** 50.2** 11.8** 27.6** 49.6** 7.2** 24.4** 47.2** -1.0 15.4** 39.0** -0.4 13.5** 42.1** -1.4 9.2** 36.3** -3.5** 9.9** 38.7** -6.3** 6.0** 37.6** Note: ** denotes p<0.01 35
  • 39. Table 5: Descriptive analysis by informality definition - ethnicity % 1992 1993 1995 1996 1997 1998 1999 2001 White (1992: 55.8%) A: no signed labour card 52.2 52.1 53.6 53.2 53.3 52.8 53.9 52.1 B: no SS membership 43.0 43.6 44.6 45.0 44.6 44.0 44.9 43.5 C: informal activity 44.4 44.5 46.1 45.8 45.8 48.3 49.1 47.4 Black (1992: 5.7%) A: no signed labour card B: no SS membership C: informal activity 57.5 55.3 53.6 55.2 54.0 51.5 55.2 53.4 53.3 55.7 55.2 53.1 53.8 52.4 52.0 54.9 52.6 54.4 56.5 54.8 55.8 54.0 51.6 52.9 Asian (1992: 0.5%) A: no signed labour card B: no SS membership C: informal activity 53.8 29.1 36.3 58.1 31.3 34.8 63.2 32.6 37.9 61.0 41.6 39.5 59.5 36.6 36.6 65.8 40.0 50.2 62.2 36.2 50.5 59.5 35.9 48.6 Mixed (1992: 37.9%) A: no signed labour card B: no SS membership C: informal activity 63.1 61.5 55.6 61.6 62.7 55.4 63.6 62.6 57.3 62.2 61.8 56.4 63.6 62.4 57.7 61.8 61.9 58.5 63.6 62.6 59.4 62.1 60.3 57.8 Indigenous (1992: 0.07%) A: no signed labour card B: no SS membership C: informal activity 65.6 67.1 61.1 76.8 82.7 74.8 81.4 79.8 77.5 74.4 68.1 66.7 79.5 79.6 81.7 60.3 58.3 50.7 70.7 71.1 56.8 61.8 57.5 61.3 36
  • 40. Table 6: Descriptive analysis by informality definition – educational attainment % 1992 1993 1995 1996 1997 1998 1999 2001 All educational levels* A: no signed labour card 56.5 55.8 57.4 56.5 57.1 56.3 57.6 56.0 B: no SS membership 50.4 51.2 51.6 51.5 51.6 51.0 51.9 50.3 C: informal activity 48.9 48.7 50.5 49.8 50.4 49.8 50.9 49.3 Illiterate (1992: 10.6%; 2001: 6.5%) A: no signed labour card B: no SS membership C: informal activity 82.4 82.0 72.6 79.7 83.9 72.7 83.0 82.9 74.8 83.1 83.0 74.2 83.1 82.9 75.7 79.1 83.3 74.8 83.5 85.0 76.8 83.5 82.5 77.5 Elementary (1992: 27.4%; 2001: 15.5%) A: no signed labour card B: no SS membership C: informal activity 66.8 58.1 60.8 65.6 58.4 60.8 68.7 60.6 63.8 68.2 60.0 64.1 70.2 62.0 66.0 69.7 62.7 66.3 70.7 63.5 67.0 71.1 64.0 67.8 Primary (1992: 34.7%; 2001: 38.7%) A: no signed labour card B: no SS membership C: informal activity 59.2 55.2 53.1 59.4 56.7 53.1 60.9 57.5 56.2 60.3 57.5 55.7 61.6 58.2 56.9 61.4 58.2 57.1 63.3 59.8 58.8 63.1 59.4 58.6 Secondary (1992: 17.5%; 2001: 26.2%) A: no signed labour card B: no SS membership C: informal activity 36.1 29.1 28.4 36.9 30.6 29.9 38.6 32.2 31.5 39.3 34.4 32.6 39.7 33.7 32.8 40.3 33.7 33.5 41.6 35.2 35.0 41.4 35.5 34.9 College deg. (1992: 9.1%; 2001: 12.3%) A: no signed labour card B: no SS membership C: informal activity 25.8 14.8 10.7 26.7 15.7 10.7 30.1 17.0 12.4 30.8 19.6 13.6 31.7 19.4 14.1 33.3 19.5 13.7 32.9 19.2 13.7 32.8 20.5 14.3 Postgrad deg. (1992: 0.4%; 2001: 0.8%) A: no signed labour card B: no SS membership C: informal activity 17.9 9.7 3.7 16.1 9.4 3.5 18.2 13.7 5.3 18.7 13.8 5.6 19.9 12.8 6.3 23.2 14.1 5.9 23.1 11.3 6.6 27.3 22.7 18.9 * Observations with missing information on educational attainment comprise 1.44% and 1.39% of the total sample in 1992 and 2001 respectively. 37
  • 41. Table 7: Descriptive analysis by informality definition – establishment size (excluding agriculture*) % 1992 1993 1995 1996 1997 1998 1999 2001 One (1992: 22.5%; 2001 22.8%: ) A: no signed labour card 99.1 98.7 99.0 98.9 99.0 98.9 99.1 99.1 B: no SS membership 70.2 71.1 73.3 72.2 74.0 76.9 77.5 79.2 C: informal activity 88.7 88.7 88.6 88.0 88.3 88.0 88.1 87.2 Two (1992: 3.6%; 2001: 4.3%) A: no signed labour card B: no SS membership C: informal activity 80.1 60.3 76.6 81.0 60.6 76.8 81.3 61.5 79.1 75.2 61.5 83.3 78.1 62.1 81.3 79.1 63.0 80.5 78.3 62.6 80.7 78.4 64.5 82.3 3 to 5 (1992: 7.4%; 2001: 8.7%) A: no signed labour card B: no SS membership C: informal activity 64.2 50.6 84.9 65.5 53.0 85.3 63.6 50.6 86.2 62.1 52.1 88.2 63.8 51.9 86.4 62.9 50.0 86.4 63.1 51.2 87.3 62.4 51.1 87.7 6 to 10 (1992: 5.9% ; 2001: 7.1) A: no signed labour card B: no SS membership C: informal activity 42.5 34.2 0.0 44.9 36.3 0.0 41.6 33.0 0.0 42.0 36.0 0.0 40.4 33.1 0.0 42.0 32.7 0.0 43.0 34.1 0.0 42.0 34.0 0.0 11 or more (1992: 49.8%; 2001: 45.2% ) A: no signed labour card B: no SS membership C: informal activity 8.1 11.7 0.0 8.2 13.4 0.0 8.6 12.7 0.0 9.8 15.5 0.0 10.0 14.1 0.0 10.3 13.5 0.0 11.1 13.7 0.0 11.6 13.1 0.0 Establishment size unknown (1992: 10.8%; 2001: 11.8%) A: no signed labour card B: no SS membership C: informal activity 83.6 80.3 99.8 83.7 81.5 99.5 82.3 79.9 99.7 79.8 77.7 99.8 79.6 77.2 99.9 78.5 75.6 99.6 78.2 75.3 99.7 76.6 73.6 99.6 Note: *Agriculture is omitted because the questionnaire schedule for agricultural workers is subdivided into grouped responses for temporary and permanent workers. 38
  • 42. Table 8: Descriptive analysis by informality definition – occupational sectors % 1992 1993 1995 1996 1997 1998 1999 2001 Creative and Technical (1992: 8.1%; 2001: 9.5%) A: no signed labour card 20.2 19.7 23.3 23.7 24.5 25.6 25.6 27.2 B: no SS membership 18.4 19.0 20.8 23.1 21.0 20.6 19.8 21.4 C: informal activity 4.5 3.9 4.8 5.0 4.5 5.0 4.3 5.5 Administrative (1992: 14.0%; 2001: 13.4%) A: no signed labour card B: no SS membership C: informal activity 34.5 18.1 7.0 35.3 18.8 7.2 35.6 18.6 8.1 35.3 20.6 9.7 35.8 19.9 9.2 37.3 20.0 9.4 37.3 20.2 9.8 37.5 21.1 10.2 Agricultural (1992: 23.2%; 2001: 17.2%) A: no signed labour card B: no SS membership C: informal activity 91.4 90.2 81.9 88.3 89.8 81.6 90.7 89.6 82.2 90.0 88.3 81.1 90.2 88.7 81.8 88.5 89.1 82.9 89.4 88.2 82.7 89.8 88.0 82.5 Manufacturing and construction (1992: 18.9%; 2001: 19.1%) A: no signed labour card B: no SS membership C: informal activity 52.6 46.2 47.3 53.3 47.5 47.4 56.4 49.7 51.4 56.9 50.8 51.5 57.9 51.5 52.9 58.4 52.2 52.9 59.0 52.8 52.6 57.5 52.3 51.3 Retail and Distribution (1992: 11.0%; 2001: 12.6%) A: no signed labour card B: no SS membership C: informal activity 72.8 54.4 74.0 74.0 56.7 74.5 74.4 58.3 75.5 72.6 57.5 73.2 72.4 57.9 73.2 71.3 57.7 72.5 72.1 59.3 72.2 69.1 58.3 69.6 Transport and Communications (1992: 4.2%; 2001: 4.5%) A: no signed labour card B: no SS membership 33.0 24.1 32.1 23.5 35.9 27.7 38.5 31.6 40.5 32.9 41.5 32.8 44.4 34.7 42.8 34.2 39
  • 43. C: informal activity 29.2 29.1 33.1 35.2 35.4 37.1 39.6 38.0 Domestic, Personal and Catering Services (1992: 9.7%; 2001: 1.9%) A: no signed labour card 71.0 71.8 71.1 68.7 68.7 67.3 67.9 66.4 B: no SS membership 68.3 69.8 68.5 66.9 66.8 64.1 65.4 63.5 C: informal activity 83.8 84.2 84.9 84.8 85.2 83.5 85.7 84.4 Other (1992: 10.9%; 2001: 12.0%) A: no signed labour card B: no SS membership C: informal activity 24.5 30.9 21.3 23.5 32.6 20.4 24.3 32.0 21.5 25.8 33.5 22.3 26.7 33.1 23.3 27.1 35.1 23.4 29.9 36.6 25.9 30.2 34.3 26.3 40
  • 44. Table 9: Probit Estimates – No Signed Labour Card 1992 1993 1995 1996 1997 1998 1999 2001 Age -0.007** -0.009** -0.005** -0.008** -0.007** -0.011** -0.011** -0.012** Age squared 0.00013** 0.00016** 0.00011** 0.00015** 0.00014** 0.00019** 0.00018** 0.00021** Female -0.053** -0.050** -0.059** -0.060** -0.073** -0.063** -0.070** -0.061** Ethnicity (reference: White) Indigenous Black Asian Mixed 0.078 -0.024** 0.081* 0.0001 -0.020 -0.026** 0.071* 0.010* 0.169* -0.049** 0.142** 0.003 0.140** -0.038** 0.132** -0.003 0.071 -0.035** 0.131** 0.002 0.073 -0.018* 0.131** -0.004 0.150** -0.022** 0.115** 0.001 -0.033 -0.030** 0.067* -0.002 Illiterate 0.059** 0.071** 0.072** 0.074** 0.068** 0.053** 0.070** 0.088** Schooling (reference: Elementary) Primary Secondary College degree Postgraduate degree 0.002 -0.073** 0.0006 -0.073 0.018** -0.069** 0.008 -0.115** 0.019** -0.066** 0.011 -0.102** 0.0005 -0.075** -0.002 -0.122** 0.015* -0.070** -0.009 -0.140** 0.015* -0.060** 0.013 -0.033 0.018** -0.069** 0.004 -0.048 0.025** -0.063** -0.007 -0.128** Region (reference: South East) North Centre East South North East 0.155** 0.094** 0.019** 0.128** 0.126** 0.076** 0.008 0.089** 0.126** 0.076** 0.033** 0.137** 0.120** 0.069** 0.019** 0.114** 0.139** 0.054** 0.002 0.110** 0.139** 0.056** 0.023** 0.111** 0.136** 0.053** 0.014** 0.125** 0.103** 0.034** 0.017** 0.118** Urban resident -0.049** -0.015* -0.041** -0.022** -0.036** 0.004 0.0003 -0.030** Union member -0.236** -0.232** -0.242** -0.233** -0.250** -0.245** -0.249** -0.231** Establishment > 11 employees -0.675** -0.671** -0.661** -0.627** -0.633** -0.630** -0.627** -0.616** Occupation (reference: Other) Creative and technical Administrative Agricultural Production and construction Retail and distribution Transport and comms Domestic, personal and catering services 0.030** 0.091** 0.168** 0.197** 0.193** 0.093** 0.150** 0.038** 0.096** 0.142** 0.212** 0.203** 0.089** 0.157** 0.045** 0.085** 0.173** 0.224** 0.214** 0.102** 0.181** 0.033** 0.065** 0.186** 0.207** 0.202** 0.103** 0.156** 0.043** 0.058** 0.168** 0.194** 0.191** 0.118** 0.142** 0.033** 0.065** 0.152** 0.198** 0.173** 0.117** 0.125** 0.041** 0.056** 0.142** 0.200** 0.176** 0.129** 0.122** 0.027** 0.048** 0.150** 0.181** 0.151** 0.108** 0.100** 41
  • 45. Spouse working with no labour card 0.037** 0.022** 0.025** 0.025** 0.021** 0.022** 0.014** 0.031** Family total with labour cards -0.026** -0.025** -0.027** -0.028** -0.025** -0.032** -0.027** -0.025** Family total self-employed 0.139** 0.139** 0.147** 0.159** 0.155** 0.148** 0.152** 0.140** Family total number of children -0.010** -0.010** -0.014** -0.011** -0.011** -0.010** -0.011** -0.011** Family total number over 65 -0.025** -0.022** -0.018** -0.026** -0.020** -0.022** -0.020** -0.018** Other family earnings per head -.39x10-8** .15x10-7 .26x10-4** .26x10-4** .38x10-4** .45x10-4** .35x10-4** .32x10-4** Sample size 103,700 105,031 112,127 108,924 116,120 115,011 118,767 132,534 Log likelihood -35275.7 -36438.4 -39000.0 -40349.0 -42835.6 -43755.5 -45398.1 -52032.1 Note: reported coefficients are marginal effects (which in the case of binary variables are for a discrete change in the variable) * denotes p<0.05; ** denotes p<0.01; 42
  • 46. Table 10: Probit Estimates – No Social Security Membership 1992 1993 1995 1996 1997 1998 1999 2001 Age -0.028** -0.028** -0.025** -0.025** -0.025** -0.026** -0.025** -0.026** Age squared 0.00031** 0.00031** 0.00029** 0.00028** 0.00028** 0.00030* 0.00030* 0.00030* Female 0.062** 0.060** 0.050** 0.044** 0.021** 0.026** 0.024** 0.026** Ethnicity (reference: White) Indigenous Black Asian Mixed 0.068 0.012 -0.053 0.033** 0.158* 0.006 -0.060* 0.041** 0.100 -0.006 -0.091** 0.035** 0.043 0.011 -0.025 0.024** 0.151** -0.001 0.013 0.025** 0.098** -0.001 0.028 0.031** 0.166** 0.004 -0.019 0.026** 0.008 -0.003 -0.010 0.023** Illiterate 0.094** 0.135** 0.098** 0.097** 0.090** 0.115** 0.116** 0.100** Schooling (reference: Elementary) Primary Secondary College degree Postgraduate degree -0.049** -0.093** -0.085** -0.025 -0.040** -0.099** -0.090** -0.097** -0.036** -0.096** -0.110** -0.068* -0.039** -0.097** -0.100** -0.129** -0.035** -0.104** -0.108** -0.164** -0.040** -0.107** -0.101** -0.096** -0.033** -0.118** -0.124** -0.166** -0.026** -0.114** -0.116** -0.153** Region (reference: South East) North Centre East South North East 0.272** 0.159** 0.026** 0.205** 0.253** 0.162** 0.009 0.215** 0.239** 0.145** 0.025** 0.190** 0.224** 0.137** -0.002 0.179** 0.240** 0.123** 0.003 0.183** 0.216** 0.112** 0.007 0.189** 0.225** 0.121** -0.005 0.205** 0.181** 0.088** 0.003 0.177** Urban resident -0.117** -0.126** -0.112** -0.075** -0.098** -0.094** -0.071** -0.089** Union member -0.241** -0.251** -0.253** -0.248** -0.261** -0.272** -0.267** -0.257** Establishment > 11 employees -0.474** -0.469** -0.462** -0.419** -0.442** -0.465** -0.464** -0.472** Occupation (reference: Other) Creative and technical Administrative Agricultural Production and construction Retail and distribution Transport and comms Domestic, personal and catering services -0.089** -0.217** 0.146** 0.029** -0.062** -0.095** 0.030** -0.077** -0.206** 0.137** 0.034** -0.053** -0.102** 0.035** -0.059** -0.215** 0.138** 0.053** -0.023** -0.068** 0.054** -0.061** -0.201** 0.150** 0.040** -0.022** -0.051** 0.039** -0.069** -0.206** 0.138** 0.047** -0.011 -0.032** 0.047** -0.096** -0.214** 0.094** 0.035** -0.032** -0.049** -0.010 -0.093** -0.211** 0.087** 0.052** -0.012 -0.039** 0.008 -0.075** -0.193** 0.111** 0.066** -0.001 -0.023** 0.003 43
  • 47. Spouse working with no labour card 0.023** 0.012* 0.013** 0.008 0.010* 0.020** 0.006 0.020** Family total with labour cards -0.024** -0.019** -0.025** -0.025** -0.019** -0.030** -0.027** -0.023** Family total self-employed 0.040** 0.042** 0.052** 0.054** 0.058** 0.064** 0.067** 0.064** Family total number of children 0.0006 0.0002 -0.0016* -0.0014 0.0005 0.0003 -0.0002 -0.0005 Family total number over 65 -0.002 -0.006 -0.003 -0.005 -0.005 -0.003 -0.004 -0.008* Other family earnings per head -.12x10-7** -.31x10-6** -.67x10-5 -.83x10-5 -.36x10-6 -.14x10-6 -.25x10-5 -.38x10-5 Sample size 103,687 105,012 112,126 108,918 116,120 115,004 118,763 132,527 Log likelihood -45028.3 -45927.3 -50127.6 -52184.7 -53936.2 -52624.8 -54372.8 -61217.0 Note: reported coefficients are marginal effects (which in the case of binary variables are for a discrete change in the variable) * denotes p<0.05; ** denotes p<0.01; 44
  • 48. Table 11: Probit Estimates – Informal Activity 1992 1993 1995 1996 1997 1998 1999 2001 Age -0.006** -0.006** -0.006** -0.007** -0.006** -0.006** -0.006** -0.004** Age squared 0.00010** 0.00010** 0.00010** 0.00012** 0.00010** 0.00010** 0.00011** 0.00009** Female 0.065** 0.051** 0.060** 0.057** 0.058** 0.044** 0.045** 0.055** Ethnicity (reference: White) Indigenous Black Asian Mixed 0.065 0.008 -0.027 0.002 0.129* 0.001 -0.025 0.004 0.116 -0.009 0.013 0.003 0.040 -0.012 0.023 -0.005 0.219** -0.008 0.046 0.004 -0.004 0.006 0.023 0.005 -0.006 0.002 0.060 0.010* 0.064 -0.002 0.026 0.010** Illiterate 0.024** 0.041** 0.041** 0.028** 0.046** 0.039** 0.052** 0.073** Schooling (reference: Elementary) Primary Secondary College degree Postgraduate degree -0.043** -0.089** -0.136** -0.216** -0.035** -0.079** -0.150** -0.238** -0.034** -0.106** -0.158** -0.181** -0.041** -0.101** -0.153** -0.170** -0.035** -0.103** -0.151** -0.125** -0.035** -0.097** -0.154** -0.198** -0.027** -0.103** -0.160** -0.146** -0.029** -0.119** -0.173** -0.151** Region (reference: South East) North Centre East South North East 0.042** 0.014** 0.030** 0.073** 0.047** 0.010** 0.031** 0.081** 0.053** 0.007 0.012** 0.072** 0.052** 0.001 0.005 0.060** 0.047** 0.001 0.016** 0.068** 0.046** -0.010 0.019** 0.064** 0.019** -0.012* 0.009 0.053** 0.039** 0.010 0.016** 0.064** Urban resident -0.014* 0.006 -0.023** 0.0004 0.0002 0.0002 0.016** 0.006 Union member -0.225** -0.227** -0.252** -0.219** -0.238** -0.229** -0.225** -0.224** Establishment > 11 employees n.a. n.a. n.a. n.a. n.a. n.a. n.a. n.a. Occupation (reference: Other) Creative and technical Administrative Agricultural Production and construction Retail and distribution Transport and comms Domestic, personal and catering services -0.270** -0.233** 0.451** 0.278** 0.480** 0.156** 0.592** -0.262** -0.221** 0.463** 0.288** 0.488** 0.153** 0.605** -0.271** -0.223** 0.434** 0.307** 0.483** 0.182** 0.571** -0.284** -0.198** 0.417** 0.282** 0.447** 0.173** 0.564** -0.297** -0.226** 0.421** 0.291** 0.440** 0.169** 0.565** -0.288** -0.200** 0.438** 0.295** 0.449** 0.199** 0.562** -0.319** -0.230** 0.414** 0.262** 0.417** 0.181** 0.557** -0.296** -0.211** 0.406** 0.249** 0.403** 0.166** 0.539** 45
  • 49. Spouse working with no labour card -0.007 0.0003 -0.014** -0.007 -0.014** -0.015** -0.022** -0.008 Family total with labour cards -0.006** -0.006** -0.009** -0.009** -0.013** -0.012** -0.012** -0.008** Family total self-employed 0.166** 0.176** 0.179** 0.176** 0.181** 0.177** 0.187** 0.164** Family total number of children -0.019** -0.020** -0.020** -0.019** -0.019** -0.019** -0.020** -0.018** Family total number over 65 -0.017** -0.023** -0.019** -0.009** -0.024** -0.023** -0.017** -0.011** Other family earnings per head -.14x10-8 -.17x10-6** -.93x10-5 -.11x10-4* -.74x10-5 -.84x10-5 -.44x10-5 -.11x10-4** Sample size 103,700 105,031 112,127 108,924 116,120 115,011 118,767 132,534 Log likelihood -44932.5 -44995.1 -48837.2 -49312.3 -51789.7 -51760.3 -53182.6 -60935.2 Note: reported coefficients are marginal effects (which in the case of binary variables are for a discrete change in the variable) * denotes p<0.05; ** denotes p<0.01; 46
  • 50. Figure 1: Coincidence of alternative definitions of informality, 1992 No Signed Labour Card No Social Security Membership 3.53% 8.29% 2.26% 39.95% 4.93% 0.18% 36.80% 4.06% Informal Activity 47
  • 51. Figure 2: Coincidence of alternative definitions of informality, 2001 No Signed Labour Card No Social Security Membership 3.52% 9.23% 1.48% 39.63% 3.65% 0.04% 36.43% 6.01% Informal Activity 48