Download to read offline


![THE 49 LEAST
DEVELOPED COUNTRIES
UN-OHRLLS
Floor 32
New York, NY 10017, USA
Tel: (917) 367-6006
Fax: (917) 367-3415
E-mail: OHRLLS-UNHQ@un.org
WWW.UN.ORG/OHRLLS
Copyright © United Nations 2013
ASIA [ 14 ]
Afghanistan
Bangladesh
Bhutan
Cambodia
Kiribati
Lao People’s
Democratic Republic
Myanmar
Nepal
Samoa
Solomon Islands
Timor-Leste
Tuvalu
Vanuatu
Yemen
LATIN AMERICA AND
THE CARIBBEAN [ 1 ]
Haiti
AFRICA [ 34 ]
Angola
Benin
Burkina Faso
Burundi
Central African Republic
Chad
Comoros
Democratic Republic
of the Congo
Djibouti
Equatorial Guinea
Eritrea
Ethiopia
Gambia
Guinea
Guinea-Bissau
Lesotho
Liberia
Madagascar
Malawi
Mali
Mauritania
Mozambique
Niger
Rwanda
São Tomé and Príncipe
Senegal
Sierra Leone
Somalia
South Sudan
Sudan
Togo
Uganda
United Republic
of Tanzania
Zambia](https://image.slidesharecdn.com/stateoftheleastdevelopedcountries2013-140916013100-phpapp02/75/State-of-the-least-developed-countries-2013-129-2048.jpg)

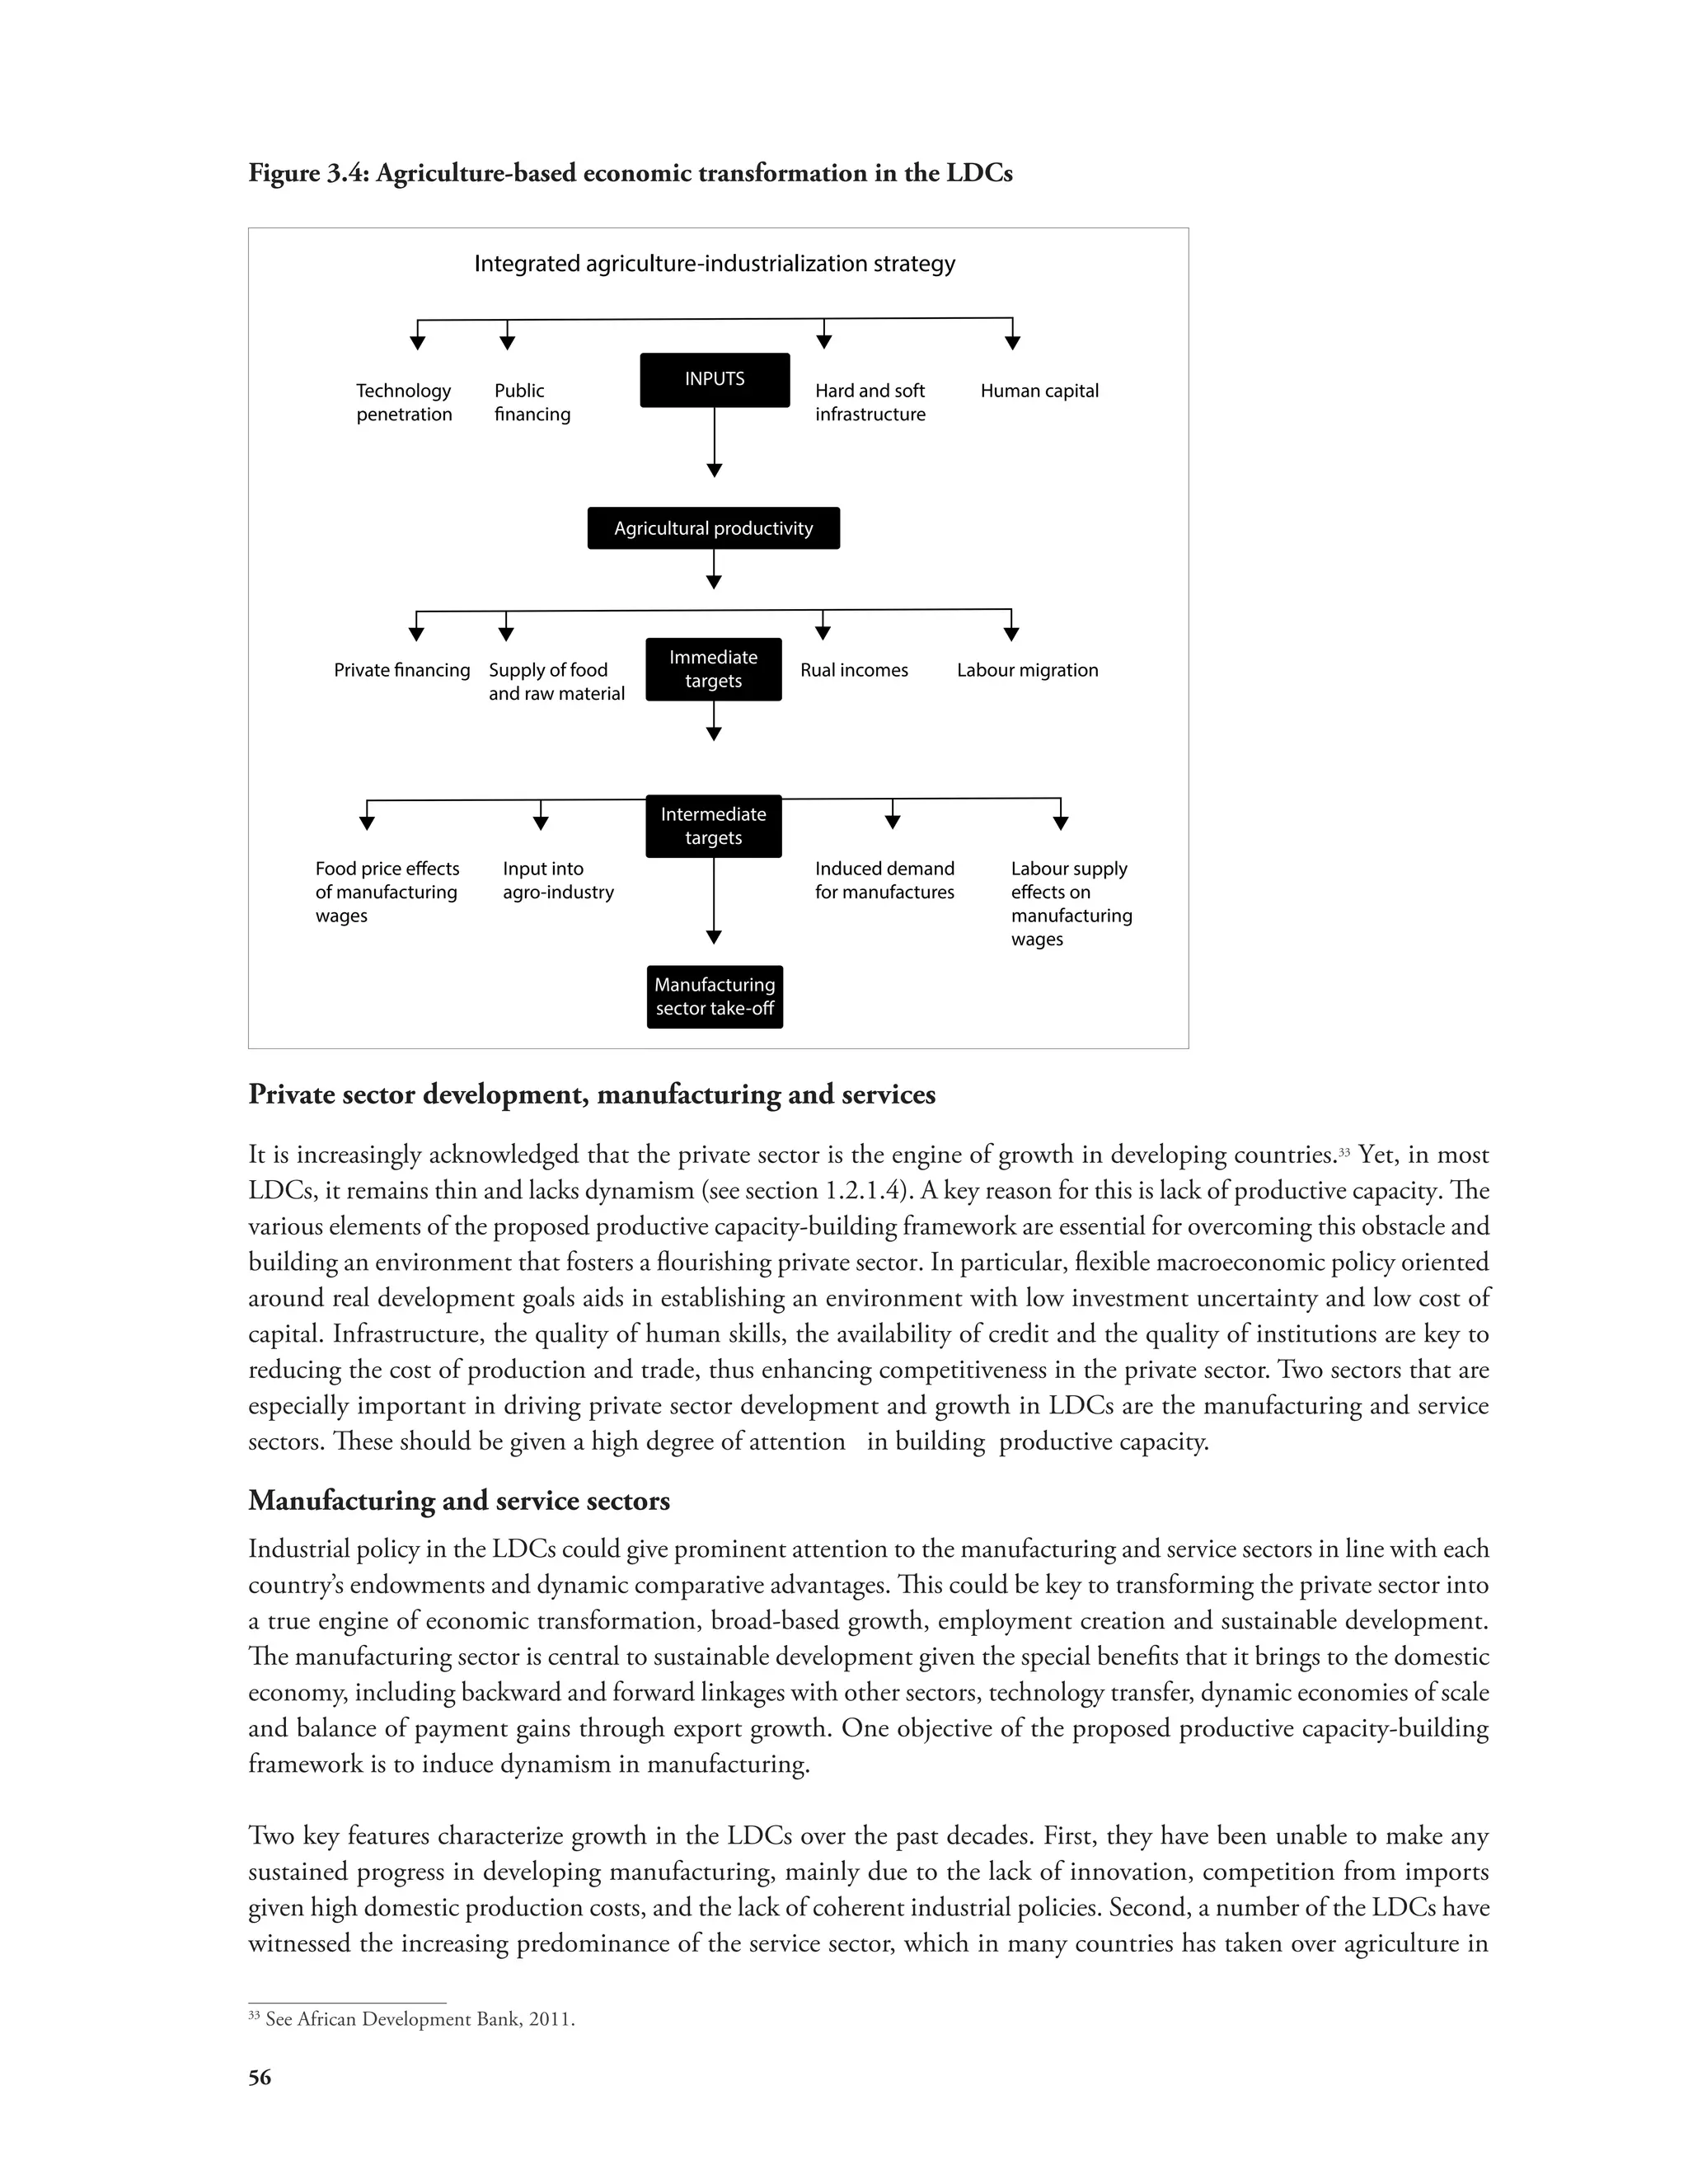
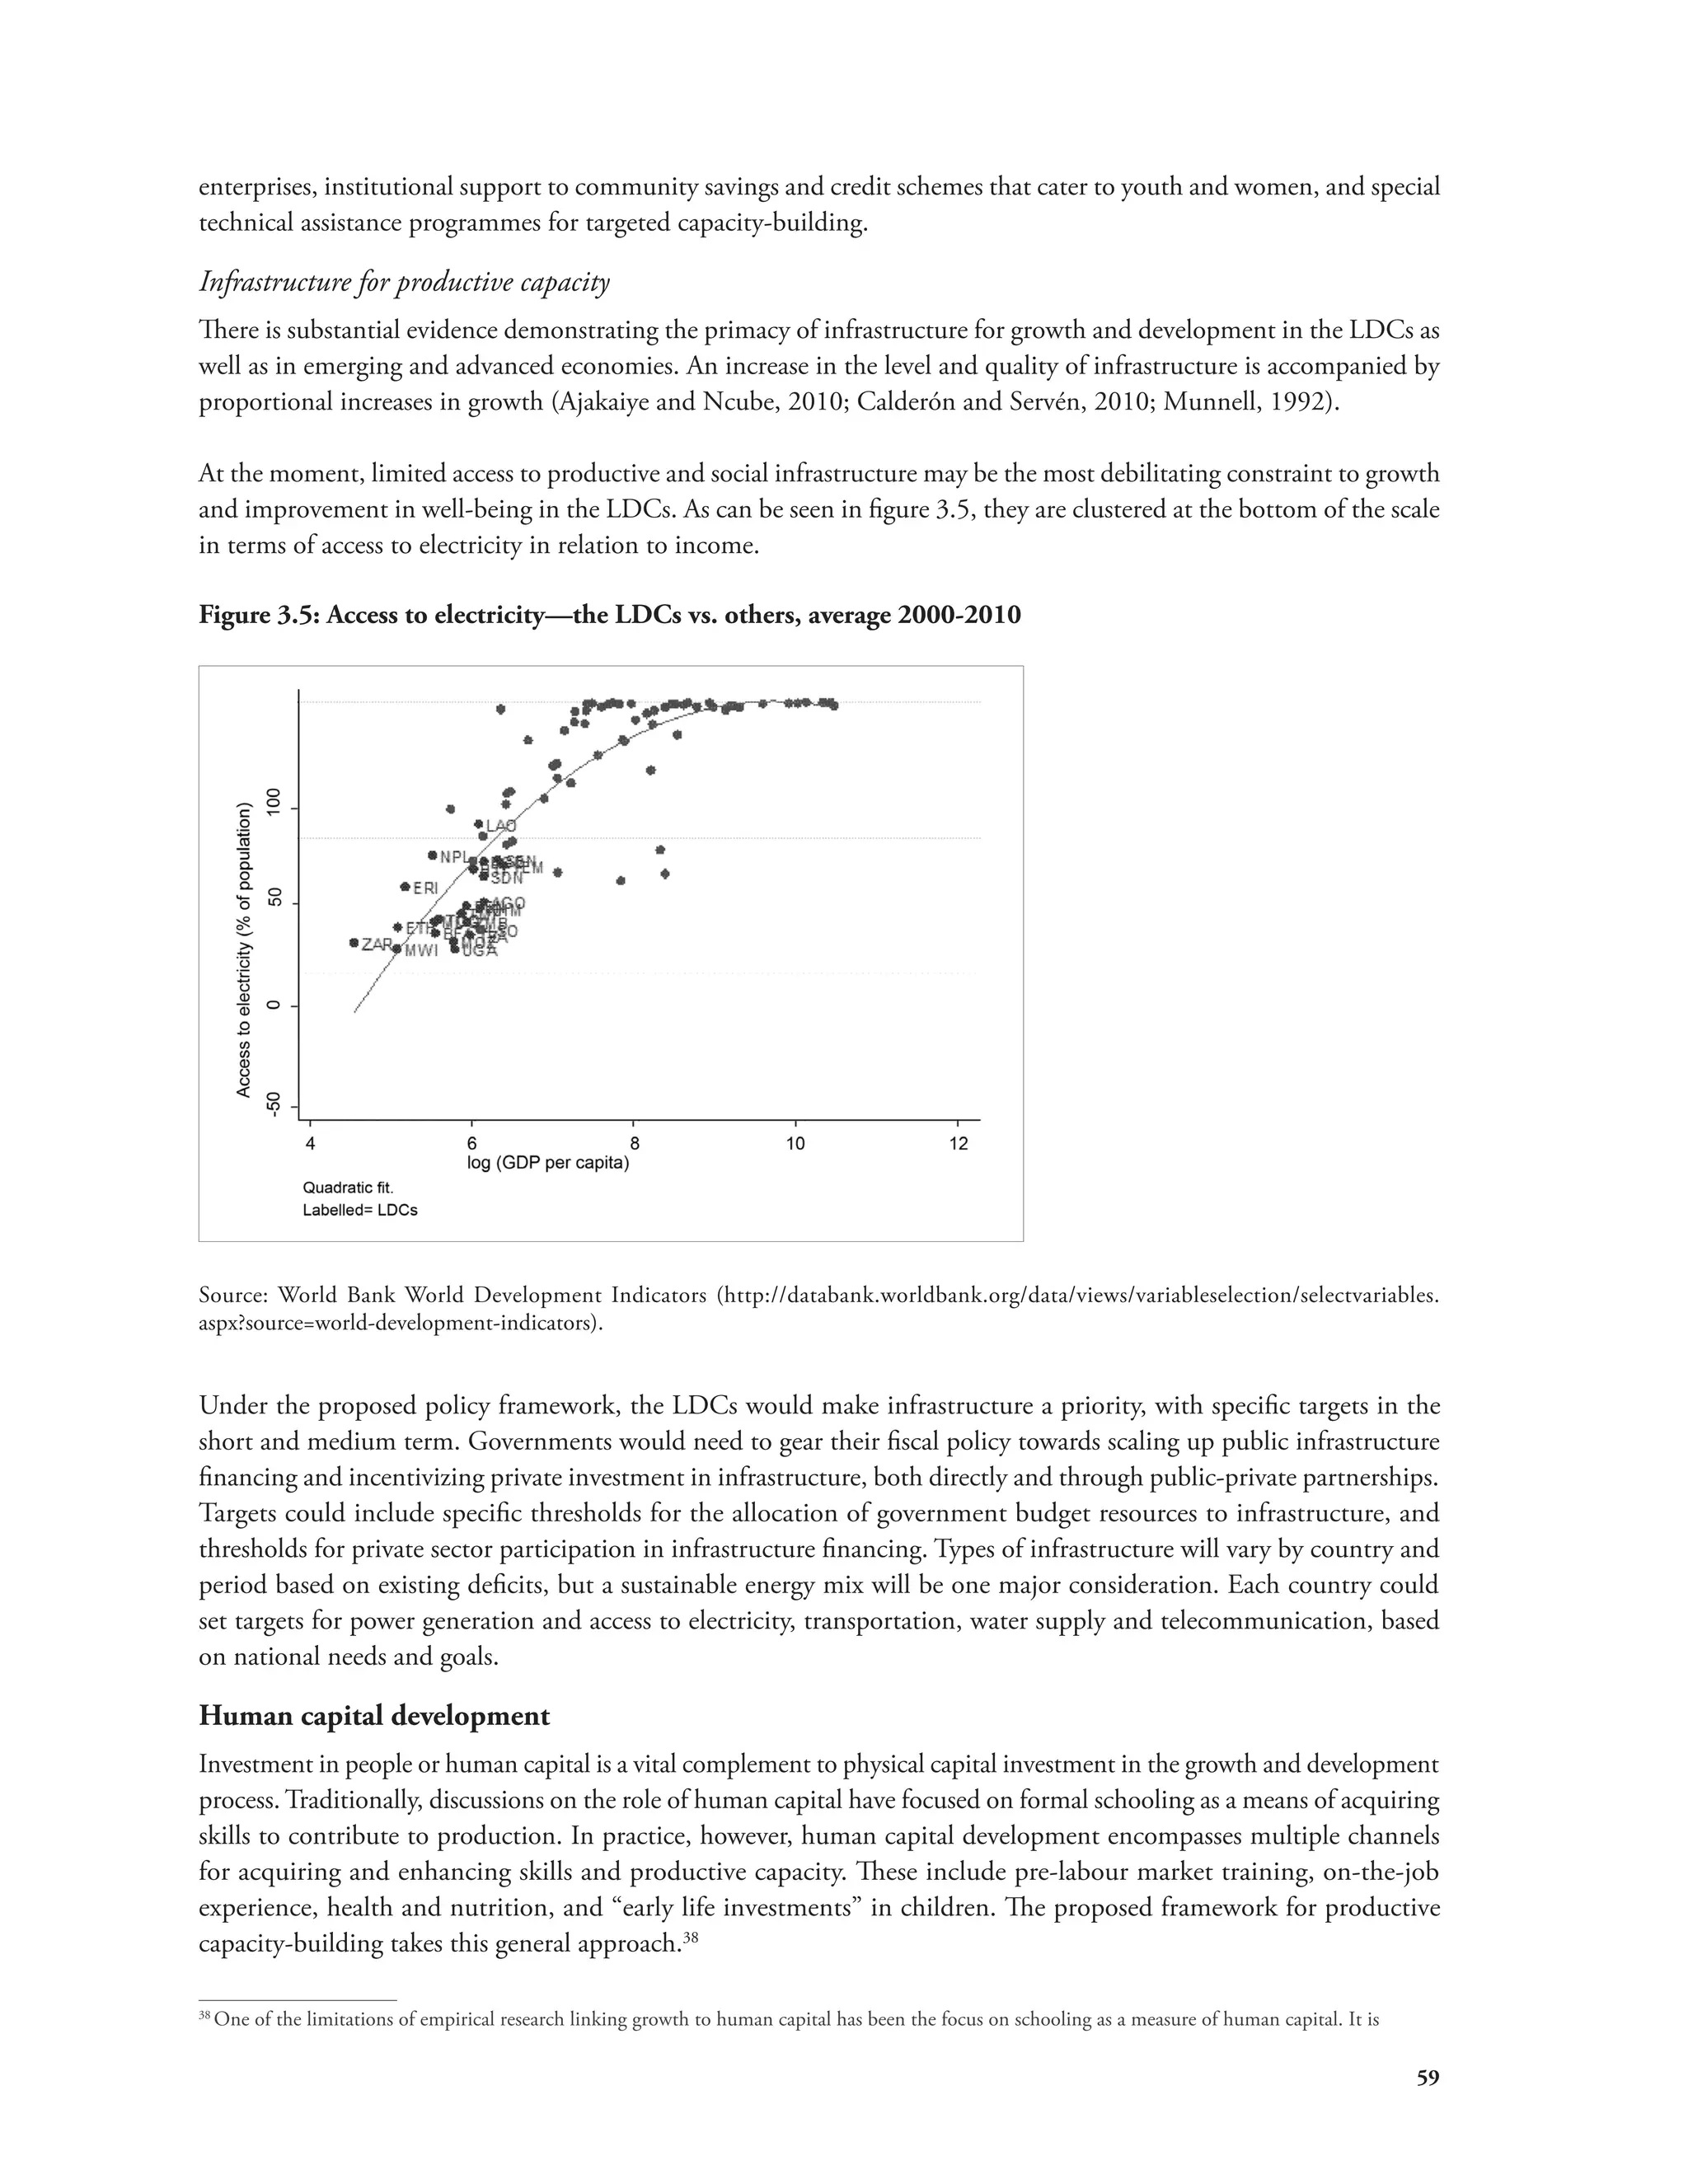
This document provides an executive summary of the 2013 State of the Least Developed Countries report. It finds that while some LDCs have experienced economic growth above 7% per year, most LDCs still face challenges such as poverty, lack of infrastructure, and limited capacity for innovation. It recognizes productive capacity building as essential for structural transformation and sustainable growth in LDCs. The report proposes a strategy for the post-2015 period focused on making employment creation the goal of macroeconomic policies and increasing the labor intensity of growth. This would require shifting to a framework targeting real development objectives through expanded policy tools.


