The document provides consolidated financial statements for a company for the years 2005-2007. It shows that total revenues increased from $10.2 billion in 2005 to $13.6 billion in 2007. Net income decreased from $549 million in 2005 to a net loss of $95 million in 2007. Key line items include total revenues, operating expenses, income from continuing operations, and net income/loss for each year.
This document provides operating statistics and financial results for El Paso Corporation for the fourth quarter and full year of 2006. Some key details include:
- For the fourth quarter of 2006, El Paso reported net income of $166 million compared to a net loss of $162 million for the same period in 2005.
- For the full year 2006, net income was $475 million, an improvement from a net loss of $606 million in 2005.
- Earnings were positively impacted by higher earnings from the Pipelines, Exploration and Production, and Field Services segments.
- The results show improvement in El Paso's overall financial performance in 2006 compared to 2005.
This document provides financial information for Advanced Micro Devices for the first quarter of 2009 including statements of operations, balance sheets, and selected corporate data. It shows a net loss of $414 million for the quarter, decreased revenue compared to the same quarter last year, and cash, cash equivalents, and marketable securities of $2.719 billion as of the end of the quarter. Non-GAAP information is also provided to show financial results excluding AMD's Foundry segment.
The document provides operating statistics and financial results for El Paso Corporation for the fourth quarter and full year of 2005. Some key details include:
- For the fourth quarter of 2005, El Paso reported a net loss of $162 million and a loss from continuing operations of $283 million.
- For the full year 2005, El Paso reported a net loss of $606 million and a loss from continuing operations of $702 million.
- El Paso reported earnings before interest and taxes of -$106 million for the fourth quarter and $398 million for the full year from its various business segments including pipelines, exploration and production, marketing and trading, power and field services.
- Advanced Micro Devices reported a net loss of $600 million for the quarter ended June 30, 2007, bringing the total net loss for the first half of 2007 to $1.211 billion.
- Revenue increased 11.9% compared to the previous quarter but the gross margin percentage declined from 28.1% to 33.5% due to higher costs.
- Research and development expenses increased 9.5% compared to the previous quarter as the company continued investing in new products.
The document contains financial statements and segment information for Motorola for Q4 2003 and full year 2003. It shows that Motorola's net sales were $8.02 billion for Q4 2003, with operating earnings of $520 million. For the full year, net sales were $27.06 billion and operating earnings were $1.08 billion. It provides details on results by business segment and excludes certain special items from GAAP results to show underlying performance.
The document is the second quarter 2008 investor supplement from Dover Corporation. It provides condensed consolidated financial statements and quarterly segment information for Dover for Q2 2008 and comparisons to prior periods. Some key details include:
- Revenue for Q2 2008 was $2.01 billion, up 10% from $1.82 billion in Q2 2007. Net earnings for Q2 2008 were $135.3 million, down 21% from $172.2 million in Q2 2007.
- All business segments saw revenue increases in Q2 2008 compared to Q2 2007, with the exception of Electronic Technologies which was flat. Industrial Products and Fluid Management had the largest revenue gains.
el paso 22758BEF-CBE8-4368-BDC6-D02434EE5C13_EP_4Q08OpStatsFinalfinance49
The document provides operating statistics for El Paso Corporation for the fourth quarter of 2008. It includes consolidated statements of income, operating results, and business segment results for Pipelines, Exploration and Production, Marketing, Power, and Corporate/Other. Key details include a net loss of $1.68 billion for Q4 2008 driven by $2.66 billion in ceiling test charges in Exploration and Production. Pipelines EBIT was $319 million for Q4. Exploration and Production had an EBIT loss of $2.526 billion for the quarter due to the ceiling test charges.
Advanced Micro Devices reported a net loss of $611 million for the first quarter of 2007, with net revenue of $1.233 billion. The Computing Solutions segment experienced an operating loss of $321 million on $918 million in revenue. Research and development expenses were $432 million for the quarter. Adjusted EBITDA, which excludes certain one-time acquisition costs, was a loss of $196 million.
- Motorola reported net earnings of $1.384 billion for Q2 2006, up from $933 million in Q2 2005, with net sales rising 29% to $10.876 billion. Net earnings for the first six months of 2006 were $2.070 billion, up from $1.625 billion in the same period in 2005.
- Mobile device sales increased 46% in Q2 2006 compared to Q2 2005, contributing to a 28% rise in total segment sales. Operating earnings also increased across all segments except networks and enterprise.
- The financial results demonstrated strong growth in Motorola's key metrics compared to the previous year, driven primarily by a large increase in mobile device sales and earnings.
- ConocoPhillips reported significantly higher revenues and net income for both the fourth quarter and full year 2004 compared to the same periods in 2003, driven by higher oil and gas prices and increased production volumes.
- Revenues for the fourth quarter of 2004 were $40.1 billion, up 54% from $26 billion in the fourth quarter of 2003. Net income for the fourth quarter was $2.4 billion, up 138% from $1 billion.
- For the full year 2004, revenues were $136.9 billion compared to $105.1 billion in 2003. Net income was $8.1 billion compared to $4.7 billion in 2003.
- Motorola reported net earnings of $933 million for Q2 2005 compared to a net loss of $203 million in Q2 2004, driven by higher sales and gains on investments.
- Net sales increased 17% to $8.825 billion in Q2 2005 from $7.541 billion in Q2 2004, with mobile devices sales growing 24%.
- Earnings per share for continuing operations were $0.38 in Q2 2005 compared to $0.26 in Q2 2004.
Motorola reported financial results for Q4 2006 and full year 2006. Net sales increased 17% in Q4 2006 compared to Q4 2005 but operating earnings decreased from $1.71 billion to $753 million. For the full year, net sales increased 22% while operating earnings fell from $4.61 billion to $4.09 billion. Mobile Devices sales increased but earnings decreased in both periods due to increased costs and charges.
Motorola reported higher net earnings for the quarter and nine months ended October 1, 2005 compared to the same periods in 2004, driven by increased net sales and gains on sales of investments. Net sales increased 25% for the quarter and 17% for the nine months with growth in all reportable segments, especially mobile devices which grew 41%. Earnings from continuing operations increased 311% for the quarter and 123% for the nine months.
Motorola reported higher net sales, earnings, and segment net sales in the fourth quarter and full year of 2005 compared to the same periods in 2004. Net earnings for the fourth quarter of 2005 were $1.202 billion compared to $647 million in 2004. For the full year, net earnings reached $4.578 billion in 2005, up from $1.532 billion in 2004. Mobile Devices and Government & Enterprise Mobility Solutions experienced the strongest sales growth across all segments.
Foundation Health Systems reported on its 1999 annual report. Key highlights included:
- Revenues for 1999 were $8.7 billion, a slight increase from 1998. Net income was $147.8 million compared to a $165.2 million loss in 1998.
- Operating cash flow significantly improved to $297.1 million in 1999 compared to $100.9 million in 1998, strengthening the balance sheet.
- A debt reduction program successfully lowered debt from $1.25 billion in 1998 to $1.04 billion in 1999.
The document provides operating statistics for El Paso Corporation for the third quarter of 2007. It includes consolidated statements of income, operating results, and business segment results for the Pipelines, Exploration and Production, Marketing, and Power segments. Specifically, it shows that for the third quarter of 2007 the company reported net income of $155 million on operating revenues of $1.166 billion, with the Pipelines segment generating earnings before interest and taxes of $275 million and the Exploration and Production segment earning $232 million on that measure.
- AES reported strong third quarter results in 2008, with earnings per share up 57% and adjusted earnings per share up 47% compared to third quarter 2007. Cash flow also increased, with consolidated free cash flow up 9%.
- For full year 2008, AES reaffirmed its operating cash flow and free cash flow guidance but lowered adjusted earnings per share guidance to reflect foreign currency losses. Guidance for 2009 was also lowered primarily due to changes in foreign exchange rate assumptions.
- AES continues to strengthen its financial position and expects that debt maturities in 2009-2010 will be met by existing cash flows. The company is well positioned to weather current market conditions.
- Advanced Micro Devices reported a net loss of $600 million for the quarter ended June 30, 2007, bringing the total net loss for the first half of 2007 to $1.211 billion.
- Revenue increased 11.9% compared to the previous quarter but the gross margin percentage declined from 28.1% to 33.5% due to higher costs.
- Research and development expenses increased 9.5% compared to the previous quarter as the company continued investing in new products.
Advanced Micro Devices reported financial results for the second quarter of 2008 that showed a net loss of $1.19 billion compared to a net loss of $600 million in the second quarter of 2007. Revenue from continuing operations was $1.35 billion, up 3% from the previous year. The larger net loss was primarily due to an $876 million impairment charge related to discontinued operations. Excluding discontinued operations, the operating loss was $143 million compared to an operating loss of $396 million in the prior year, as gross margin improved to 52% from 34% a year ago.
This document provides operating statistics for El Paso Corporation for the fourth quarter of 2006. It includes consolidated statements of income, operating results, and business segment results for the company's pipelines, exploration and production, marketing, power, field services, and corporate divisions. For the fourth quarter of 2006, the company reported a net loss of $166 million compared to a net loss of $162 million in the fourth quarter of 2005. The pipelines segment reported earnings before interest and taxes of $302 million for the fourth quarter of 2006.
The document provides operating statistics for El Paso Corporation for the fourth quarter of 2008. It includes consolidated statements of income, operating results, and business segment results for Pipelines, Exploration and Production, Marketing, Power, and Corporate/Other. Key details include a net loss of $1.68 billion for Q4 2008 driven by $2.66 billion in ceiling test charges in Exploration and Production. Pipelines contributed operating income of $291 million in Q4. Exploration and Production had an operating loss of $2.39 billion in Q4 due to the ceiling test charges.
el paso 22758BEF-CBE8-4368-BDC6-D02434EE5C13_EP_4Q08OpStatsFinalfinance49
The document provides operating statistics for El Paso Corporation for the fourth quarter of 2008. It includes consolidated statements of income, operating results, and business segment results for Pipelines, Exploration and Production, Marketing, Power, and Corporate/Other. Key details include a net loss of $1.68 billion for Q4 2008 driven by $2.66 billion in ceiling test charges in Exploration and Production. Pipelines generated $319 million in EBIT for Q4. Exploration and Production had an EBIT loss of $2.53 billion for the quarter due to the ceiling test charges.
- AMD reported a net loss of $67 million for Q3 2008 and $1.6 billion for the first 9 months of 2008 due to losses from discontinued operations related to its memory chip business Spansion. Revenue increased 14% in Q3 2008 compared to Q3 2007 but gross margin percentage increased from 41% to 51%.
- Total assets decreased from $11.55 billion as of December 2007 to $9.49 billion as of September 2008 mainly due to assets transferred from discontinued operations to liabilities held for sale. Cash and marketable securities decreased from $1.89 billion to $1.34 billion over the same period.
This document provides operating statistics and financial results for El Paso Corporation for the fourth quarter of 2005.
Some key highlights include:
- Consolidated net loss was $162 million for Q4 2005 compared to a net loss of $542 million for Q4 2004.
- The Pipeline Group segment earned $233 million in earnings before interest and taxes for Q4 2005, down from $369 million in Q4 2004.
- Exploration & Production earned $168 million in earnings before interest and taxes for Q4 2005, down slightly from $176 million in Q4 2004.
- Marketing and Trading lost $224 million in earnings before interest and taxes for Q4 2005, an improvement from a $
The document provides operating statistics and financial results for El Paso Corporation for the fourth quarter and full year of 2007. Key highlights include:
- Consolidated net income for Q4 2007 was $160 million compared to a net loss of $166 million in Q4 2006. For the full year, net income was $1.11 billion compared to $475 million in 2006.
- The Pipelines segment saw earnings before interest and taxes of $277 million in Q4 2007, up from $270 million in Q4 2006. For the full year, earnings were $1.11 billion, up from $1.06 billion in 2006.
- Exploration and Production earnings before interest and taxes were $252
- The document reports financial results for Clorox for the third quarter and first nine months of fiscal year 2006 compared to the same periods in fiscal year 2005. Net sales increased 7% in the third quarter and 6% year-to-date. Earnings from continuing operations were $110 million for the third quarter and $301 million year-to-date.
- Motorola reported a net loss of $203 million for the quarter ended July 3, 2004 compared to net earnings of $119 million for the same period in 2003. Revenues increased 41% to $8.7 billion for the quarter.
- For the six months ended July 3, 2004, Motorola reported net earnings of $406 million on revenues of $17.3 billion, up 41% compared to the same period in 2003.
- Motorola's Personal Communications segment led growth, with revenues up 67% for both the quarter and six months, while operating earnings increased across most business segments.
- AMD reported a net loss of $611 million for Q1 2007 due to lower revenue and higher costs. Revenue fell to $1.23 billion from $1.77 billion in the previous quarter.
- Gross margin declined to 28.1% from 36.2% in the previous quarter due to higher costs and lower factory utilization. Research and development expenses increased while marketing and administrative costs declined slightly.
- The Computing Solutions segment reported an operating loss of $321 million on revenue of $918 million, compared to an operating income of $65 million on revenue of $1.486 billion in the previous quarter.
This document provides financial information for Advanced Micro Devices for the first quarter of 2009 including statements of operations, balance sheets, and selected corporate data. It shows a net loss of $414 million for the quarter, decreased revenue compared to the same quarter last year, and cash, cash equivalents and marketable securities of $2.719 billion. Non-GAAP information is also provided to show financial results without consolidation of GLOBALFOUNDRIES operations.
This document provides an overview and summary of key financial information for Big Lots for fiscal year 2003. It includes selected financial data such as net sales, costs of sales, gross profit, selling and administrative expenses, operating profit, interest expense/income, income before taxes, tax expense, net income, earnings per share, balance sheet information, and store count data for fiscal years 2004, 2003, 2002, 2001, and 2000. It also provides a cautionary statement about forward-looking statements and an overview of Big Lots' business operations and seasonal fluctuations.
The document provides operating statistics for El Paso Corporation for the third quarter of 2007. It includes consolidated statements of income, operating results, and business segment results for the Pipelines, Exploration and Production, Marketing, and Power segments. Specifically, it shows that the company reported net income of $155 million for Q3 2007 compared to $135 million for the same period in 2006. The Pipelines segment reported earnings before interest and taxes of $275 million for Q3 2007.
- El Paso Corporation reported operating revenues of $1.598 billion and net income of $445 million for the third quarter of 2008.
- The Pipelines segment earned $278 million in earnings before interest and taxes, with throughput volumes averaging 4.605 trillion British thermal units per day on the Tennessee Gas Pipeline and 4.649 trillion British thermal units per day on the El Paso Natural Gas Pipeline.
- The Exploration and Production segment earned $528 million in operating income on average daily production volumes of 881 million cubic feet equivalent per day.
- El Paso Corporation reported financial results for the third quarter of 2008 with consolidated net income of $445 million compared to $155 million in the third quarter of 2007.
- The Pipelines segment saw earnings before interest and taxes of $278 million in the third quarter of 2008 compared to $275 million in the third quarter of 2007, while throughput increased.
- Exploration and Production saw earnings before interest and taxes increase to $528 million in the third quarter of 2008 from $228 million in the third quarter of 2007, with production volumes and realized prices increasing.
- Overall, the company reported higher earnings across most business segments in the third quarter of 2008 compared to the same period in 2007.
Advanced Micro Devices reported financial results for the third quarter of 2007, with revenue of $1.632 billion, up 20.7% from the previous year. However, the company reported a net loss of $396 million compared to a net income of $136 million in the prior year. Gross margin declined to 41% from 51% due to higher costs. Operating losses increased to $226 million from income of $121 million, driven by increased research and development, marketing, and acquisition-related expenses. On a non-GAAP basis, adjusted EBITDA was $60 million, down 82% from the previous year.
Advanced Micro Devices reported a net loss of $396 million for the quarter and $1.6 billion for the nine months ended September 29, 2007. Revenue increased 22% for the quarter but fell 9% for the nine months. Gross margin declined to 41% for the quarter and 35% for the nine months due to higher costs. Research and development expenses increased 68% for the nine months as the company worked to develop new products.
The document provides operating statistics for El Paso Corporation for the third quarter of 2006. It shows that consolidated net income was $135 million for the quarter. It also provides key financial data segmented by each of El Paso's business units, including pipelines, exploration and production, marketing and trading, power, and field services. The pipelines segment reported earnings before interest and taxes of $305 million for the quarter and throughput volumes on its major pipelines.
The document discusses Pepsi Bottling Group's use of non-GAAP financial measures to provide additional context for investors beyond standard GAAP reporting. It defines one such measure, Operating Free Cash Flow (OFCF), as cash from operations less capital expenditures plus excess tax benefits from stock options. Management uses OFCF to evaluate business performance and liquidity. The document provides Pepsi's forecast for 2007 OFCF between $530-550 million and outlines adjustments made to certain first quarter 2007 financial results to exclude foreign currency translation impacts.
The document discusses Pepsi Bottling Group's (PBG) use of non-GAAP financial measures to provide additional context for investors beyond standard GAAP reporting. It provides non-GAAP adjusted figures for PBG's second quarter 2007 results which exclude the impact of foreign currency translation. It also gives adjusted guidance figures for full year 2007 diluted EPS and effective tax rate which exclude the impact of reversing tax contingencies. Finally, it defines and discusses the non-GAAP measure of operating free cash flow, and provides PBG's estimated range for full year 2007 operating free cash flow.
The document provides reconciliations of Pepsi Bottling Group's (PBG) reported and comparable non-GAAP financial measures for the third quarter and year-to-date 2007, including net revenue, gross profit, operating income, earnings per share (EPS), and operating free cash flow (OFCF). It also provides PBG's 2007 guidance ranges on a reported and adjusted basis, adjusting for items affecting comparability including tax matters, restructuring charges, and asset rationalization charges.
pepsi bottling Non Gaap Investor Day121307finance19
The document provides reconciliations of non-GAAP financial measures reported by The Pepsi Bottling Group to GAAP measures for 2005-2007 and 2008 guidance. It summarizes adjustments made for items affecting comparability between years, including restructuring charges, tax law changes, and accounting rule changes. Operating profit growth, EPS, and cash flow are reconciled for these periods. Non-GAAP measures are used to evaluate underlying business performance by excluding certain non-recurring or variable items.
The document summarizes Pepsi Bottling Group's (PBG) fourth quarter 2007 earnings conference call. It provides non-GAAP financial measures to allow for meaningful year-over-year comparisons. Items affecting comparability in 2007 include a tax contingency reversal, tax law changes, and restructuring charges. The document also reconciles 2007 and Q4 2007 reported results to comparable results. Guidance for 2008 reported and comparable operating income growth and EPS is also provided.
The document provides a reconciliation of non-GAAP financial measures for Pepsi Bottling Group's first quarter 2008 earnings conference call. It summarizes restructuring charges and an asset disposal charge that affected comparability between periods. It provides comparable and reported operating income growth, EPS, and guidance figures. It also defines and provides guidance for operating free cash flow.
The document summarizes Pepsi Bottling Group's second quarter 2008 earnings conference call. It discusses non-GAAP financial measures used by the company to provide meaningful year-over-year comparisons and evaluate underlying business performance. Items affecting comparability between years are also reviewed, including restructuring charges, asset disposal charges, and tax items. Specific metrics for certain international markets and 2008 guidance figures both on a comparable and reported basis are also presented. Operating free cash flow is defined and full-year 2008 expectations provided.
The document provides reconciliations of non-GAAP financial measures reported by The Pepsi Bottling Group for 2008. It identifies items affecting comparability between years, including restructuring charges, asset disposal charges, and stock-based compensation. The document summarizes the quantitative impact of these items on key financial metrics like operating income growth, earnings per share, and cash flow. It also provides guidance for 2008 operating free cash flow.
The document provides reconciliations of non-GAAP financial measures and items affecting comparability for The Pepsi Bottling Group's third quarter 2008 earnings conference call. It summarizes restructuring charges, asset disposal charges, a tax audit settlement, tax law changes, and stock-based compensation adjustments. It also provides comparable and reported figures for net revenue, operating income, earnings per share, and other metrics. Guidance is given for full-year 2008 measures on a comparable and reported basis.
The document provides financial information and reconciliation of non-GAAP measures for The Pepsi Bottling Group's fourth quarter 2008 earnings conference call. It summarizes items affecting comparability for 2008 and 2009, including impairment charges, restructuring charges, and the impact of foreign exchange rates. It also provides the company's operating free cash flow for 2008 and guidance for comparable net revenues, costs, operating income, earnings per share, and operating free cash flow for 2009.
The document provides reconciliation of non-GAAP financial measures for The Pepsi Bottling Group for 2008. It summarizes items affecting comparability between years such as impairment charges, restructuring charges, and accounting standard changes. Tables show the impact of these items on operating income, net revenues, operating profit, and earnings per share for 2008 compared to 2005, 2007, and 2003. The document also provides 2009 guidance forecasts for revenue growth, operating income growth, earnings per share, and operating free cash flow.
The document discusses PBG's financial highlights and growth in 2000. Key points:
1) PBG had strong financial results in 2000, with net revenues of $7.982 billion and EPS of $1.53, up from 1999. Operating income and EBITDA also grew substantially.
2) Two-thirds of PBG's business comes from take-home sales. In 2000 PBG focused on growing its bottled water and flavor carbonated soft drink segments in the take-home market.
3) PBG launched Sierra Mist, a new lemon-lime flavor, to capitalize on the fast growing lemon-lime segment of the carbonated soft drink category. The launch was swift in
World Fuel Services Corporation is a global leader in the downstream marketing and financing of aviation and marine fuel products and related services. For the nine-month period ended December 31, 2002, the company reported revenue of $1.55 billion, up 52.6% from the same period the previous year. Net income was $9.9 million, down 22.6% from the previous year. The company has a strong balance sheet with $312 million in total assets and $127.7 million in stockholders' equity.
Understanding how timely GST payments influence a lender's decision to approve loans, this topic explores the correlation between GST compliance and creditworthiness. It highlights how consistent GST payments can enhance a business's financial credibility, potentially leading to higher chances of loan approval.
Falcon stands out as a top-tier P2P Invoice Discounting platform in India, bridging esteemed blue-chip companies and eager investors. Our goal is to transform the investment landscape in India by establishing a comprehensive destination for borrowers and investors with diverse profiles and needs, all while minimizing risk. What sets Falcon apart is the elimination of intermediaries such as commercial banks and depository institutions, allowing investors to enjoy higher yields.
Vicinity Jobs’ data includes more than three million 2023 OJPs and thousands of skills. Most skills appear in less than 0.02% of job postings, so most postings rely on a small subset of commonly used terms, like teamwork.
Laura Adkins-Hackett, Economist, LMIC, and Sukriti Trehan, Data Scientist, LMIC, presented their research exploring trends in the skills listed in OJPs to develop a deeper understanding of in-demand skills. This research project uses pointwise mutual information and other methods to extract more information about common skills from the relationships between skills, occupations and regions.
Falcon stands out as a top-tier P2P Invoice Discounting platform in India, bridging esteemed blue-chip companies and eager investors. Our goal is to transform the investment landscape in India by establishing a comprehensive destination for borrowers and investors with diverse profiles and needs, all while minimizing risk. What sets Falcon apart is the elimination of intermediaries such as commercial banks and depository institutions, allowing investors to enjoy higher yields.
[4:55 p.m.] Bryan Oates
OJPs are becoming a critical resource for policy-makers and researchers who study the labour market. LMIC continues to work with Vicinity Jobs’ data on OJPs, which can be explored in our Canadian Job Trends Dashboard. Valuable insights have been gained through our analysis of OJP data, including LMIC research lead
Suzanne Spiteri’s recent report on improving the quality and accessibility of job postings to reduce employment barriers for neurodivergent people.
Decoding job postings: Improving accessibility for neurodivergent job seekers
Improving the quality and accessibility of job postings is one way to reduce employment barriers for neurodivergent people.
Lecture slide titled Fraud Risk Mitigation, Webinar Lecture Delivered at the Society for West African Internal Audit Practitioners (SWAIAP) on Wednesday, November 8, 2023.
In a tight labour market, job-seekers gain bargaining power and leverage it into greater job quality—at least, that’s the conventional wisdom.
Michael, LMIC Economist, presented findings that reveal a weakened relationship between labour market tightness and job quality indicators following the pandemic. Labour market tightness coincided with growth in real wages for only a portion of workers: those in low-wage jobs requiring little education. Several factors—including labour market composition, worker and employer behaviour, and labour market practices—have contributed to the absence of worker benefits. These will be investigated further in future work.
Abhay Bhutada, the Managing Director of Poonawalla Fincorp Limited, is an accomplished leader with over 15 years of experience in commercial and retail lending. A Qualified Chartered Accountant, he has been pivotal in leveraging technology to enhance financial services. Starting his career at Bank of India, he later founded TAB Capital Limited and co-founded Poonawalla Finance Private Limited, emphasizing digital lending. Under his leadership, Poonawalla Fincorp achieved a 'AAA' credit rating, integrating acquisitions and emphasizing corporate governance. Actively involved in industry forums and CSR initiatives, Abhay has been recognized with awards like "Young Entrepreneur of India 2017" and "40 under 40 Most Influential Leader for 2020-21." Personally, he values mindfulness, enjoys gardening, yoga, and sees every day as an opportunity for growth and improvement.
BONKMILLON Unleashes Its Bonkers Potential on Solana.pdfcoingabbar
Introducing BONKMILLON - The Most Bonkers Meme Coin Yet
Let's be real for a second – the world of meme coins can feel like a bit of a circus at times. Every other day, there's a new token promising to take you "to the moon" or offering some groundbreaking utility that'll change the game forever. But how many of them actually deliver on that hype?
How Does CRISIL Evaluate Lenders in India for Credit RatingsShaheen Kumar
CRISIL evaluates lenders in India by analyzing financial performance, loan portfolio quality, risk management practices, capital adequacy, market position, and adherence to regulatory requirements. This comprehensive assessment ensures a thorough evaluation of creditworthiness and financial strength. Each criterion is meticulously examined to provide credible and reliable ratings.
1. Elemental Economics - Introduction to mining.pdfNeal Brewster
After this first you should: Understand the nature of mining; have an awareness of the industry’s boundaries, corporate structure and size; appreciation the complex motivations and objectives of the industries’ various participants; know how mineral reserves are defined and estimated, and how they evolve over time.
Independent Study - College of Wooster Research (2023-2024) FDI, Culture, Glo...AntoniaOwensDetwiler
"Does Foreign Direct Investment Negatively Affect Preservation of Culture in the Global South? Case Studies in Thailand and Cambodia."
Do elements of globalization, such as Foreign Direct Investment (FDI), negatively affect the ability of countries in the Global South to preserve their culture? This research aims to answer this question by employing a cross-sectional comparative case study analysis utilizing methods of difference. Thailand and Cambodia are compared as they are in the same region and have a similar culture. The metric of difference between Thailand and Cambodia is their ability to preserve their culture. This ability is operationalized by their respective attitudes towards FDI; Thailand imposes stringent regulations and limitations on FDI while Cambodia does not hesitate to accept most FDI and imposes fewer limitations. The evidence from this study suggests that FDI from globally influential countries with high gross domestic products (GDPs) (e.g. China, U.S.) challenges the ability of countries with lower GDPs (e.g. Cambodia) to protect their culture. Furthermore, the ability, or lack thereof, of the receiving countries to protect their culture is amplified by the existence and implementation of restrictive FDI policies imposed by their governments.
My study abroad in Bali, Indonesia, inspired this research topic as I noticed how globalization is changing the culture of its people. I learned their language and way of life which helped me understand the beauty and importance of cultural preservation. I believe we could all benefit from learning new perspectives as they could help us ideate solutions to contemporary issues and empathize with others.
STREETONOMICS: Exploring the Uncharted Territories of Informal Markets throug...sameer shah
Delve into the world of STREETONOMICS, where a team of 7 enthusiasts embarks on a journey to understand unorganized markets. By engaging with a coffee street vendor and crafting questionnaires, this project uncovers valuable insights into consumer behavior and market dynamics in informal settings."
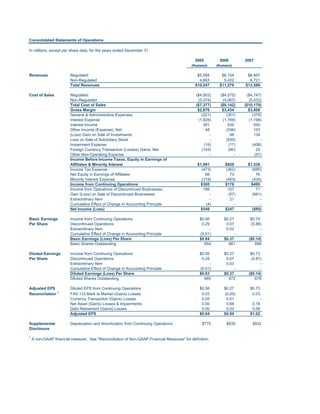
1. Consolidated Statements of Operations
In millions, except per share data, for the years ended December 31
2005 2006 2007
(Restated) (Restated)
Revenues Regulated $5,584 $6,154 $6,867
Non-Regulated 4,663 5,422 6,721
Total Revenues $10,247 $11,576 $13,588
Cost of Sales Regulated ($4,003) ($4,075) ($4,747)
Non-Regulated (3,374) (4,067) (5,432)
Total Cost of Sales ($7,377) ($8,142) ($10,179)
Gross Margin $2,870 $3,434 $3,409
General & Administrative Expenses (221) (301) (379)
Interest Expense (1,828) (1,769) (1,788)
Interest Income 381 434 500
Other Income (Expense), Net 48 (336) 103
(Loss) Gain on Sale of Investments - 98 134
Loss on Sale of Subsidiary Stock - (535) -
Impairment Expense (16) (17) (408)
Foreign Currency Transaction (Losses) Gains, Net (143) (80) 24
Other Non-Operating Expense - - (57)
Income Before Income Taxes, Equity in Earnings of
Affiliates & Minority Interest $1,091 $928 $1,538
Income Tax Expense (473) (362) (685)
Net Equity in Earnings of Affiliates 66 73 76
Minority Interest Expense (319) (463) (434)
Income from Continuing Operations $365 $176 $495
Income from Operations of Discontinued Businesses 188 107 71
Gain (Loss) on Sale of Discontinued Businesses - (57) (661)
Extraordinary Item - 21 -
Cumulative Effect of Change in Accounting Principle (4) - -
Net Income (Loss) $549 $247 ($95)
Basic Earnings Income from Continuing Operations $0.56 $0.27 $0.74
Per Share Discontinued Operations 0.29 0.07 (0.88)
Extraordinary Item - 0.03 -
Cumulative Effect of Change in Accounting Principle (0.01) - -
Basic Earnings (Loss) Per Share $0.84 $0.37 ($0.14)
Basic Shares Outstanding 654 661 668
Diluted Earnings Income from Continuing Operations $0.56 $0.27 $0.73
Per Share Discontinued Operations 0.28 0.07 (0.87)
Extraordinary Item - 0.03 -
Cumulative Effect of Change in Accounting Principle (0.01) - -
Diluted Earnings (Loss) Per Share $0.83 $0.37 ($0.14)
Diluted Shares Outstanding 665 672 678
Adjusted EPS Diluted EPS from Continuing Operations $0.56 $0.27 $0.73
Reconciliation 1 FAS 133 Mark to Market (Gains) Losses 0.03 (0.05) 0.03
Currency Transaction (Gains) Losses 0.05 0.01 -
Net Asset (Gains) Losses & Impairments 0.00 0.68 0.18
Debt Retirement (Gains) Losses 0.00 0.03 0.08
Adjusted EPS $0.64 $0.94 $1.02
Supplemental Depreciation and Amortization from Continuing Operations $770 $835 $932
Disclosure
1
A non-GAAP financial measure. See quot;Reconciliation of Non-GAAP Financial Measuresquot; for definition.
2. Consolidated Balance Sheets
In millions, as of December 31
2005 2006 2007
(Restated) (Restated)
Assets
Current Assets Cash & Cash Equivalents $1,169 $1,358 $2,058
Restricted Cash 437 548 522
Short-Term Investments 199 640 1,306
Accounts Receivable, Net 1,513 1,765 2,270
Inventory 414 445 480
Receivable from Affiliates 85 91 56
Deferred Income Taxes - Current 258 214 286
Prepaid Expenses 110 106 137
Other Current Assets 661 927 1,076
Current Assets of Held for Sale & Discontinued Businesses 448 484 145
Total Current Assets 5,294 6,578 8,336
Property, Plant & Land 831 921 1,052
Equipent Electric Generation & Distribution Assets 19,906 21,464 24,824
Accumulated Depreciation (5,540) (6,427) (7,591)
Construction in Progress 686 987 1,774
Property, Plant & Equipment, Net 15,883 16,945 20,059
Other Assets Deferred Financing Costs, Net 267 311 352
Investments in & Advances to Affiliates 660 591 730
Debt Service Reserves & Other Deposits 525 515 568
Goodwill, Net 1,408 1,414 1,416
Other Intangible Assets, Net 485 498 466
Deferred Income Taxes - Noncurrent 703 601 647
Other Assets 1,391 1,587 1,698
Long-Term Assets of Held for Sale & Discontinued Businesses 2,409 2,234 181
Total Other Assets 7,848 7,751 6,058
Total Assets $29,025 $31,274 $34,453
Liabilities & Stockholders' Equity
Current Liabilities Accounts Payable $999 $788 $1,073
Accrued Interest 372 404 255
Accrued & Other Liabilities 2,069 2,143 2,638
Recourse Debt - Current Position 200 - 223
Non-Recourse Debt - Current Position 1,356 1,402 1,142
Current Liabilities of Held for Sale & Discontinued Businesses 318 313 151
Total Current Liabilities 5,314 5,050 5,482
Long-Term Liabilities Non-Recourse Debt 10,308 9,840 11,297
Recourse Debt 4,682 4,790 5,332
Deferred Income Taxes - Noncurrent 772 809 1,197
Pension Liabilities & Other Post-Retirement Liabilities 829 844 921
Other Long-Term Liabilities 3,370 3,556 3,754
Long-Term Liabilities of Held for Sale & Discontinued Businesses 580 479 65
Total Long-Term Liabilities 20,541 20,318 22,566
Minority Interest 1,587 2,927 3,241
Stockholders' Equity Common Stock 7 7 7
Additional Paid-In Capital 6,566 6,659 6,776
Accumulated Deficit (1,340) (1,093) (1,241)
Accumulated Other Comprehensive Loss (3,650) (2,594) (2,378)
Total Stockholders' Equity 1,583 2,979 3,164
Total Liabilities & Stockholders' Equity $29,025 $31,274 $34,453
3. Consolidated Statements of Cash Flows
In millions, for the years ended December 31
2005 2006 2007
(Restated) (Restated)
Operating Activities Net Income (Loss) 549 247 (95)
Adjustments to Net Income (Loss):
Depreciation & Amortization 864 933 942
Loss from Sale of Investments & Impairment Expense 45 471 333
(Gain) Loss on Disposal & Impairment Write-Down - Discontinued Operations - 57 669
Provision for Deferred Taxes 120 (10) 210
Minority Interest Expense 348 482 452
Contingencies (9) 173 196
(Gain) Loss on the Extinguishment of Debt 1 148 92
Other 175 12 (34)
Changes in Operating Assets & Liabilities:
Decrease (Increase) in Accounts Receivable - 94 (306)
Increase in Inventory (58) (3) (26)
Decrease (Increase) in Prepaid Expenses & Other Current Assets 123 (69) 335
Decrease (Increase) in Other Assets 83 149 (134)
Decrease in Accounts Payable & Other Current Liabilities (124) (385) (398)
Increase in Other Liabilities 103 52 121
Net Cash Provided by Operating Activities $2,220 $2,351 $2,357
Investing Activities Capital Expenditures ($826) ($1,460) ($2,425)
Acquisitions - Net of Cash Acquired (85) (19) (315)
Proceeds from the Sales of Businesses 22 898 1,136
Proceeds from the Sales of Assets 26 24 16
Sale of Short-Term Investments 1,499 2,011 2,492
Purchase of Short-Term Investments (1,345) (2,359) (2,982)
Decrease (Increase) in Restricted Cash 94 (8) (28)
Purchase of Emission Allowances (19) (77) (13)
Proceeds from the Sales of Emission Allowances 42 82 17
(Decrease) Increase in Debt Service Reserves & Other Assets (93) 39 122
Purchase of Long-Term Available-for-Sale Securities - (52) (49)
Repayment of Affiliate Loan - - 55
Other Investing 32 14 4
Net Cash Used in Investing Activities ($653) ($907) ($1,970)
Financing Activities Borrowings (Repayments) Under the Revolving Credit Facilities, Net $53 $72 ($85)
Issuance of Recourse Debt 5 - 2,000
Issuance of Non-Recourse Debt 1,710 3,097 2,297
Repayments of Recourse Debt (259) (150) (1,315)
Repayments of Non-Recourse Debt (2,651) (4,059) (2,251)
Payments for Deferred Financing Costs (21) (86) (97)
Distributions to Minority Interests (186) (335) (699)
Contributions from Minority Interests 1 125 374
Issuance of Common Stock 26 78 58
Financed Capital Expenditures (1) (52) (35)
Other Financing (16) (7) (3)
Net Cash (Used in) Provided by Financing Activities ($1,339) ($1,317) $244
Effect of Exchange Rate Changes on Cash 13 62 69
Total Increase in Cash & Cash Equivalents $241 $189 $700
Cash & Cash Equivalents, Beginning 928 1,169 1,358
Cash & Cash Equivalents, Ending $1,169 $1,358 $2,058
Supplemental Cash Payments for Interest - Net of Amounts Capitalized 1,674 1,718 1,762
Disclosures Cash Payments for Income Taxes - Net of Refunds 268 479 621
Maintenance Capital Expenditures 635 867 878
Growth Capital Expenditures 192 645 1,582
1
Free Cash Flow 1,585 1,484 1,479
Schedule of Non- Assets Acquired in Acquisitions - - 434
Cash Investing & Non-Recourse Debt Assumed in Acquisitions - - 647
Financing Activities Liabilities Extinguished Due to Sale of Assets - 30 134
Liabilities Assumed in Acquisitions - - 37
1
A non-GAAP financial measure. See quot;Reconciliation of Non-GAAP Financial Measuresquot; for definition.
8. Top 10 Subsidiary Distributions
In millions, for the years ended December 31
2004 2005 2006 2007
IPALCO $177 IPALCO $208 Eastern Energy $162 IPALCO $170
Gener 151 EDC 107 IPALCO 142 New York 122
EDC 1 EDC 1
Eastern Energy 94 Eastern Energy 85 100 97
EDC 1 77 Shady Point 57 Gener 81 Brasiliana 90
Shady Point 76 Hawaii 46 Hungary 37 Kilroot 69
Hawaii 47 Ras Laffan 45 Hawaii 35 Hawaii 49
Ebute 33 Gener 36 Alicura 33 Cartagena 42
Southland 28 Alicura 30 CAESS & EEO 31 Shady Point 38
Barka 21 Southland 29 Shady Point 30 Ekibastuz 37
CTSN (San Nicolas) 21 Global Insurance 25 Deepwater 29 Gener 36
Subtotal - Top 10 $725 Subtotal - Top 10 $668 Subtotal - Top 10 $680 Subtotal - Top 10 $750
Other Businesses 279 Other Businesses 325 Other Businesses 291 Other Businesses 349
Total $1,004 Total $993 Total $971 Total $1,099
1
A business AES sold in May 2007.
9. Reconciliation of Non-GAAP Financial Measures
In millions, except per share data, for the years ended December 31
2005 2006 2007
(Restated) (Restated)
Reconciliation of Maintenance Capital Expenditures $635 $867 $878
Capital Expenditures Growth Capital Expenditures 192 645 1,582
Capital Expenditures $827 $1,512 $2,460
Reconciliation of Net Cash Provided by Operating Activities $2,220 $2,351 $2,357
1
Free Cash Flow Maintenance Capital Expenditures 635 867 878
Free Cash Flow $1,585 $1,484 $1,479
Reconciliation of Adjusted Diluted Earnings Per Share from Continuing Operations $0.56 $0.27 $0.73
2
Earnings Per Share FAS 133 Mark to Market (Gains) Losses 0.03 (0.05) 0.03
Currency Transaction (Gains) Losses 0.05 0.01 -
Net Asset (Gains) Losses & Impairments 0.00 0.68 0.18
Debt Retirement (Gains) Losses 0.00 0.03 0.08
Adjusted Earnings Per Share $0.64 $0.94 $1.02
Reconciliation of Subsidiary Distributions to Parent $993 $971 $1,099
3
Subsidiary Distributions Returns of Capital to Parent 57 72 106
Total Subsidiary Distributions & Returns of Capital to Parent $1,050 $1,043 $1,205
1
Free cash flow is defined as net cash from operating activities less maintenance capital expenditures (including environmental capital expenditures). AES
believes that free cash flow is a useful measure for evaluating our financial condition because it represents the amount of cash provided by operations less
maintenance capital expenditures as defined by our businesses, that may be available for investing or for repaying debt.
2
Adjusted earnings per share is defined as diluted earnings per share from continuing operations excluding gains or losses associated with (a) mark-to-market
amounts related to FAS 133 derivative transactions, (b) foreign currency transaction impacts on the net monetary position related to Brazil and Argentina, (c)
significant asset gains or losses due to disposition transactions and impairments, and (d) costs related to early retirement of debt. AES believes that adjusted
earnings per share better reflects the underlying business performance of the Company, and is considered in the Company’s internal evaluation of financial
performance. Factors in this determination include the variability associated with mark-to-market gains or losses related to certain derivative transactions, currency
gains and losses, periodic strategic decisions to dispose of certain assets which may influence results in a given period, and the early retirement of debt.
3
Subsidiary distributions should not be construed as an alternative to Net Cash Provided by Operating Activities which are determined in accordance with GAAP.
Subsidiary distributions are important to the Parent Company because the Parent Company is a holding company that does not derive any significant direct
revenues from its own activities but instead relies on its subsidiaries' business activities and the resultant distributions to fund the debt service, investment and
other cash needs of the holding company. The reconciliation of difference between the subsidiary distributions and the Net Cash Provided by Operating Activities
consists of cash generated from operating activities that is retained at the subsidiaries for a variety of reasons which are both discretionary and non-discretionary in
nature. These factors include, but are not limited to, retention of cash to fund capital expenditures at the subsidiary, cash retention associated with non-recourse
debt covenant restrictions and related debt service requirements at the subsidiaries, retention of cash related to sufficiency of local GAAP statutory retained
earnings at the subsidiaries, retention of cash for working capital needs at the subsidiaries, and other similar timing differences between when the cash is
generated at the subsidiaries and when it reaches the Parent Company and related holding companies.
10. Selected Financial Data
In millions, except per share data, for the years ended December 31
Statement of Operations Data 2007 2006 2005 2004 2003
(Restated) (Restated) (Restated) (Restated)
Revenues $13,588 $11,576 $10,247 $8,728 $7,676
Income from Continuing Operations 495 176 365 183 177
Discontinued Operations, Net of Tax (590) 50 188 132 (681)
Extraordinary Items, Net of Tax - 21 - - -
Cumulative Effect of Change in Accounting Principle, Net of Tax - - (4) - 41
Net (Loss) Income Available to Common Stockholders ($95) $247 $549 $315 ($463)
Basic (Loss) Income from Continuing Operations, Net of Tax $0.74 $0.27 $0.56 $0.29 $0.30
Earnings Per Discontinued Operations, Net of Tax (0.88) 0.07 0.29 0.20 (1.15)
Share Extraordinary Items, Net of Tax - 0.03 - - -
Cumulative Effect of Change in Accounting Principle, Net of Tax - - (0.01) - 0.07
Basic (Loss) Earnings Per Share ($0.14) $0.37 $0.84 $0.49 ($0.78)
Diluted (Loss) Income from Continuing Operations, Net of Tax $0.73 $0.27 $0.56 $0.29 $0.30
Earnings Per Discontinued Operations, Net of Tax (0.87) 0.07 0.28 0.20 (1.14)
Share Extraordinary Items, Net of Tax - 0.03 - - -
Cumulative Effect of Change in Accounting Principle, Net of Tax - - (0.01) - 0.07
Diluted (Loss) Earnings Per Share ($0.14) $0.37 $0.83 $0.49 ($0.77)
Balance Sheet Data 2007 2006 2005 2004 2003
(Restated) (Restated) (Restated) (Restated)
Total Assets $34,453 $31,274 $29,025 $28,449 $29,145
Non-Recourse Debt (Long-Term) $11,297 $9,840 $10,308 $10,571 $10,038
Non-Recourse Debt (Long-Term) - Discontinued Operations $33 $342 $467 $742 $719
Recourse Debt (Long-Term) $5,332 $4,790 $4,682 $5,010 $5,862
Accumulated Deficit ($1,241) ($1,093) ($1,340) ($1,889) ($2,204)
Stockholders' Equity (Deficit) $3,164 $2,979 $1,583 $997 ($99)
13. Income Before Income Taxes, Equity in Earnings of Affiliates &
Minority Interest(1)(2) $ in millions
$1,800
$1,538
$1,600
$1,400
$1,200
$1,091
$928
$1,000
$800
$600
$400
$200
$0
2005 2006 2007
(1)
2005 & 2006 Restated.
(2)
2006 results include Brazil restructuring impacts that are unfavorable to income before taxes, equity in earnings & minority interest by ($509) million and
unfavorable to diluted EPS from continuing operations by ($0.76) per share.
15. Adjusted EPS(1)(2)
$ per share
$1.20
$1.02
$1.00 $0.94
$0.80
$0.64
$0.60
$0.40
$0.20
$0.00
2005 2006 2007
(1)
2005 & 2006 based on restated diluted earnings per share.
(2)
A non-GAAP financial measure. See quot;Reconciliation of Non-GAAP Financial Measuresquot; for definition.
16. Net Cash Provided by Operating Activities and Free Cash Flow (1)(2)(3)
$ in millions
$2,400
$2,206
$2,087
$1,878 $599
$1,800 $632
$538
$235
$165
$64
$1,200
$1,372
$1,290
$1,276
$600
$0
2005 2006 2007
Free Cash Flow Environmental Capex Maintenance Capex
(1)
2005 & 2006 Restated.
(2)
A non-GAAP financial measure. See quot;Reconciliation of Non-GAAP Financial Measuresquot; for definition.
(3)
Excludes results from EDC, a Latin America utility business that was sold in May 2007.
17. Reconciliation of Cash Flow
In millions, except per share data, for the years ended December 31
2005 2006 2007
(Restated) (Restated)
Net Cash Provided by Operating Activities $2,220 $2,351 $2,357
EDC Impact 1 (342) (264) (151)
Net Cash Provided by Operating Activities, Excluding EDC $1,878 $2,087 $2,206
Maintenance Capital Expenditures $571 $867 $878
Maintenance Capital Expenditures, EDC 1 33 70 44
Free Cash Flow 2 $1,649 $1,484 $1,479
1, 2
Free Cash Flow, Excluding EDC $1,340 $1,290 $1,372
1
Unaudited.
2
A non-GAAP financial measure. See quot;Reconciliation of Non-GAAP Financial Measuresquot; for definition.
18. Non-Recourse Debt
$ in millions
$15,000
$12,439
$11,664
$12,000 $11,242
$9,000
$6,000
$3,000
$0
2005 2006 2007
19. Recourse Debt
$ in millions
$6,000
$5,555
$4,882 $4,790
$4,500
$3,000
$1,500
$0
2005 2006 2007