Download to read offline

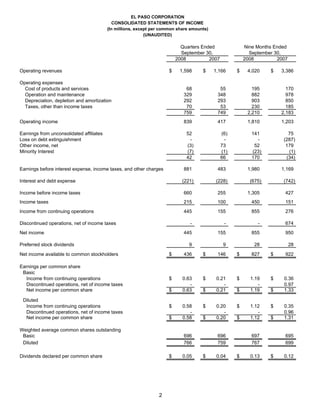
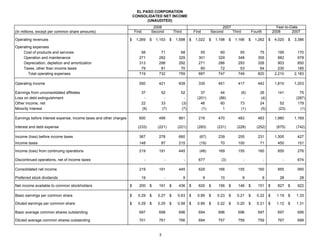
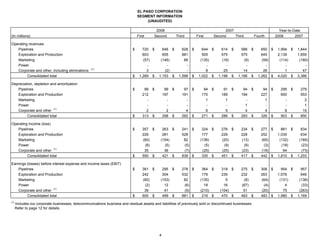
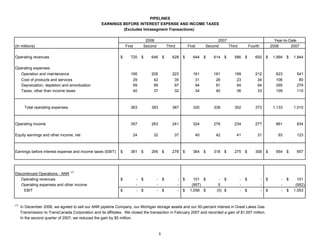
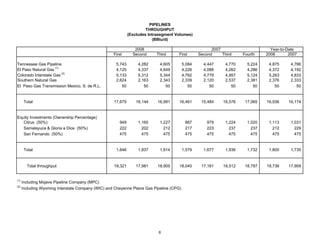
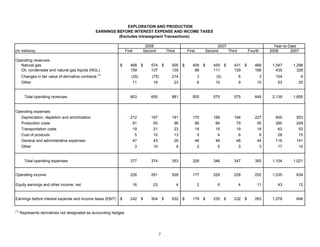
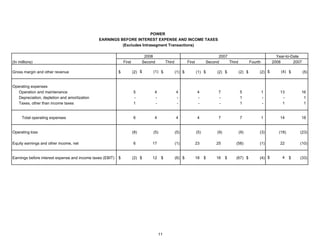
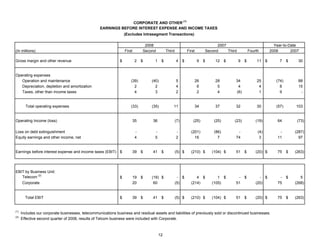
- El Paso Corporation reported financial results for the third quarter of 2008 with consolidated net income of $445 million compared to $155 million in the third quarter of 2007. - The Pipelines segment saw earnings before interest and taxes of $278 million in the third quarter of 2008 compared to $275 million in the third quarter of 2007, while throughput increased. - Exploration and Production saw earnings before interest and taxes increase to $528 million in the third quarter of 2008 from $228 million in the third quarter of 2007, with production volumes and realized prices increasing. - Overall, the company reported higher earnings across most business segments in the third quarter of 2008 compared to the same period in 2007.


