Download to read offline


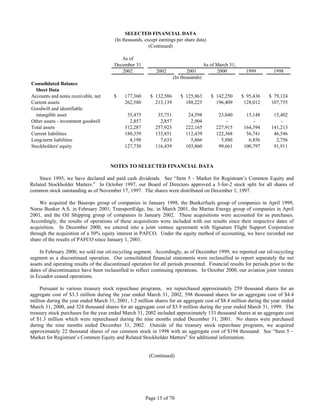
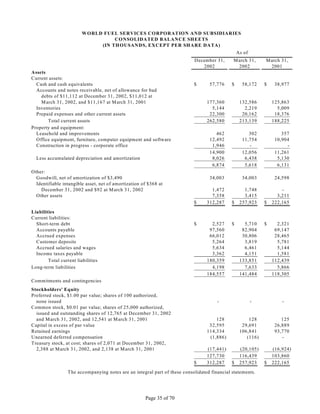
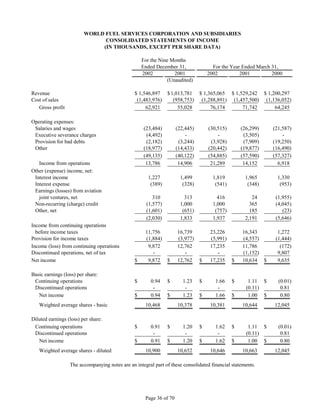
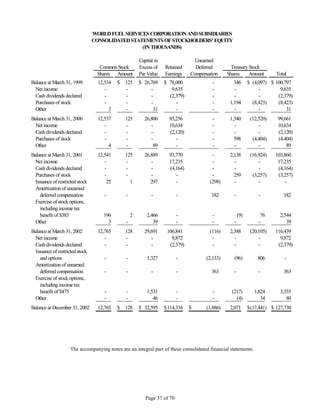
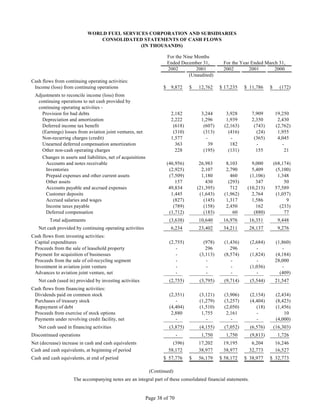
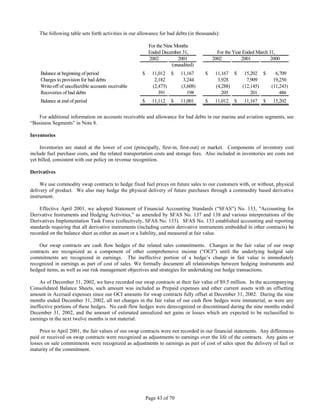
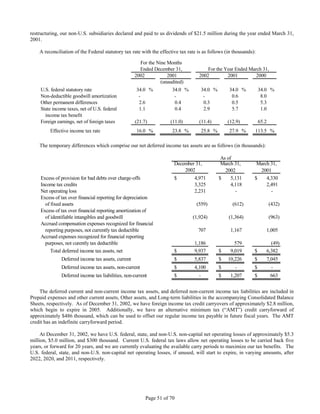


World Fuel Services Corporation is a global leader in the downstream marketing and financing of aviation and marine fuel products and related services. For the nine-month period ended December 31, 2002, the company reported revenue of $1.55 billion, up 52.6% from the same period the previous year. Net income was $9.9 million, down 22.6% from the previous year. The company has a strong balance sheet with $312 million in total assets and $127.7 million in stockholders' equity.


