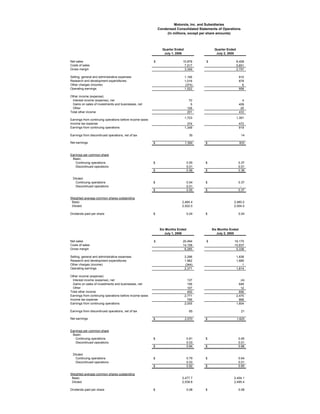
1. Motorola, Inc. and Subsidiaries
Condensed Consolidated Statements of Operations
(In millions, except per share amounts)
Quarter Ended Quarter Ended
July 1, 2006 July 2, 2005
Net sales $ 10,876 $ 8,408
Costs of sales 7,517 5,651
Gross margin 3,359 2,757
Selling, general and administrative expenses 1,195 915
Research and development expenditures 1,016 878
Other charges (income) (374) 6
Operating earnings 1,522 958
Other income (expense):
Interest income (expense), net 70 4
Gains on sales of investments and businesses, net 5 409
Other 126 20
Total other income 201 433
1,723 1,391
Earnings from continuing operations before income taxes
Income tax expense 374 472
Earnings from continuing operations 1,349 919
Earnings from discontinued operations, net of tax 35 14
Net earnings $ 1,384 $ 933
Earnings per common share
Basic:
Continuing operations $ 0.55 $ 0.37
Discontinued operations 0.01 0.01
$ 0.56 $ 0.38
Diluted:
Continuing operations $ 0.54 $ 0.37
Discontinued operations 0.01 -
$ 0.55 $ 0.37
Weighted average common shares outstanding
Basic 2,464.4 2,460.2
Diluted 2,522.0 2,504.0
Dividends paid per share $ 0.04 $ 0.04
Six Months Ended Six Months Ended
July 1, 2006 July 2, 2005
Net sales $ 20,484 $ 16,175
Costs of sales 14,199 10,837
Gross margin 6,285 5,338
Selling, general and administrative expenses 2,296 1,838
Research and development expenditures 1,962 1,685
Other charges (income) (344) 1
Operating earnings 2,371 1,814
Other income (expense):
Interest income (expense), net 137 (4)
Gains on sales of investments and businesses, net 156 648
Other 107 12
Total other income 400 656
Earnings from continuing operations before income taxes 2,771 2,470
Income tax expense 766 866
Earnings from continuing operations 2,005 1,604
Earnings from discontinued operations, net of tax 65 21
Net earnings $ 2,070 $ 1,625
Earnings per common share
Basic:
Continuing operations $ 0.81 $ 0.65
Discontinued operations 0.03 0.01
$ 0.84 $ 0.66
Diluted:
Continuing operations $ 0.79 $ 0.64
Discontinued operations 0.03 0.01
$ 0.82 $ 0.65
Weighted average common shares outstanding
Basic 2,477.7 2,454.1
Diluted 2,538.8 2,495.4
Dividends paid per share $ 0.08 $ 0.08
2. Motorola, Inc. and Subsidiaries
Condensed Consolidated Balance Sheets
(In millions)
ASSETS July 1, December 31,
2006 2005
Cash & cash equivalents $ 3,401 $ 3,774
Sigma funds 10,801 10,867
Short-term investments 188 144
Accounts receivable, net 6,420 5,635
Inventories, net 2,716 2,422
Deferred income taxes 2,123 2,355
Other current assets 2,440 2,360
Current assets held for sale 339 312
Total current assets 28,428 27,869
Property, plant and equipment, net 2,084 2,020
Investments 1,395 1,644
Deferred income taxes 991 1,196
Other assets 2,804 2,597
Non-current assets held for sale 302 323
Total assets $ 36,004 $ 35,649
LIABILITIES AND STOCKHOLDERS' EQUITY
Notes payable and current portion of
long-term debt $ 490 $ 448
Accounts payable 4,134 4,295
Accrued liabilities 7,149 7,376
Current liabilities held for sale 281 320
Total current liabilities 12,054 12,439
Long-term debt 3,758 3,806
Other liabilities 2,907 2,727
Non-current liabilities held for sale 8 4
Stockholders' equity 17,277 16,673
Total liabilities and stockholders' equity $ 36,004 $ 35,649
3. Motorola, Inc. and Subsidiaries
Segment Information
(In millions)
Summarized below are the Company's net sales by reportable segment for the quarters and six months
ended July 1, 2006 and July 2, 2005.
Net Sales
Quarter Ended Quarter Ended % Change
July 1, 2006 July 2, 2005 from 2005
Mobile Devices $ 7,140 $ 4,902 46%
Networks and Enterprise 2,903 2,825 3%
Connected Home Solutions 803 743 8%
Segment Totals 10,846 8,470 28%
Other and Eliminations 30 (62) 148%
Company Totals $ 10,876 $ 8,408 29%
Net Sales
Six Months Ended Six Months Ended % Change
July 1, 2006 July 2, 2005 from 2005
Mobile Devices $ 13,543 $ 9,317 45%
Networks and Enterprise 5,423 5,562 -2%
Connected Home Solutions 1,535 1,425 8%
Segment Totals 20,501 16,304 26%
Other and Eliminations (17) (129) 87%
Company Totals $ 20,484 $ 16,175 27%
4. Motorola, Inc. and Subsidiaries
Segment Information
(In millions)
Summarized below are the Company's operating earnings (loss) by reportable segment
for the quarters and six months ended July 1, 2006 and July 2, 2005.
Operating Earnings (Loss)
Quarter Ended Quarter Ended
July 1, 2006 July 2, 2005
Mobile Devices $ 799 $ 493
Networks and Enterprise 386 494
Connected Home Solutions 56 33
Segment Totals 1,241 1,020
Other and Eliminations 281 (62)
Company Totals $ 1,522 $ 958
Operating Earnings (Loss)
Six Months Ended Six Months Ended
July 1, 2006 July 2, 2005
Mobile Devices $ 1,498 $ 931
Networks and Enterprise 685 909
Connected Home Solutions 45 42
Segment Totals 2,228 1,882
Other and Eliminations 143 (68)
Company Totals $ 2,371 $ 1,814