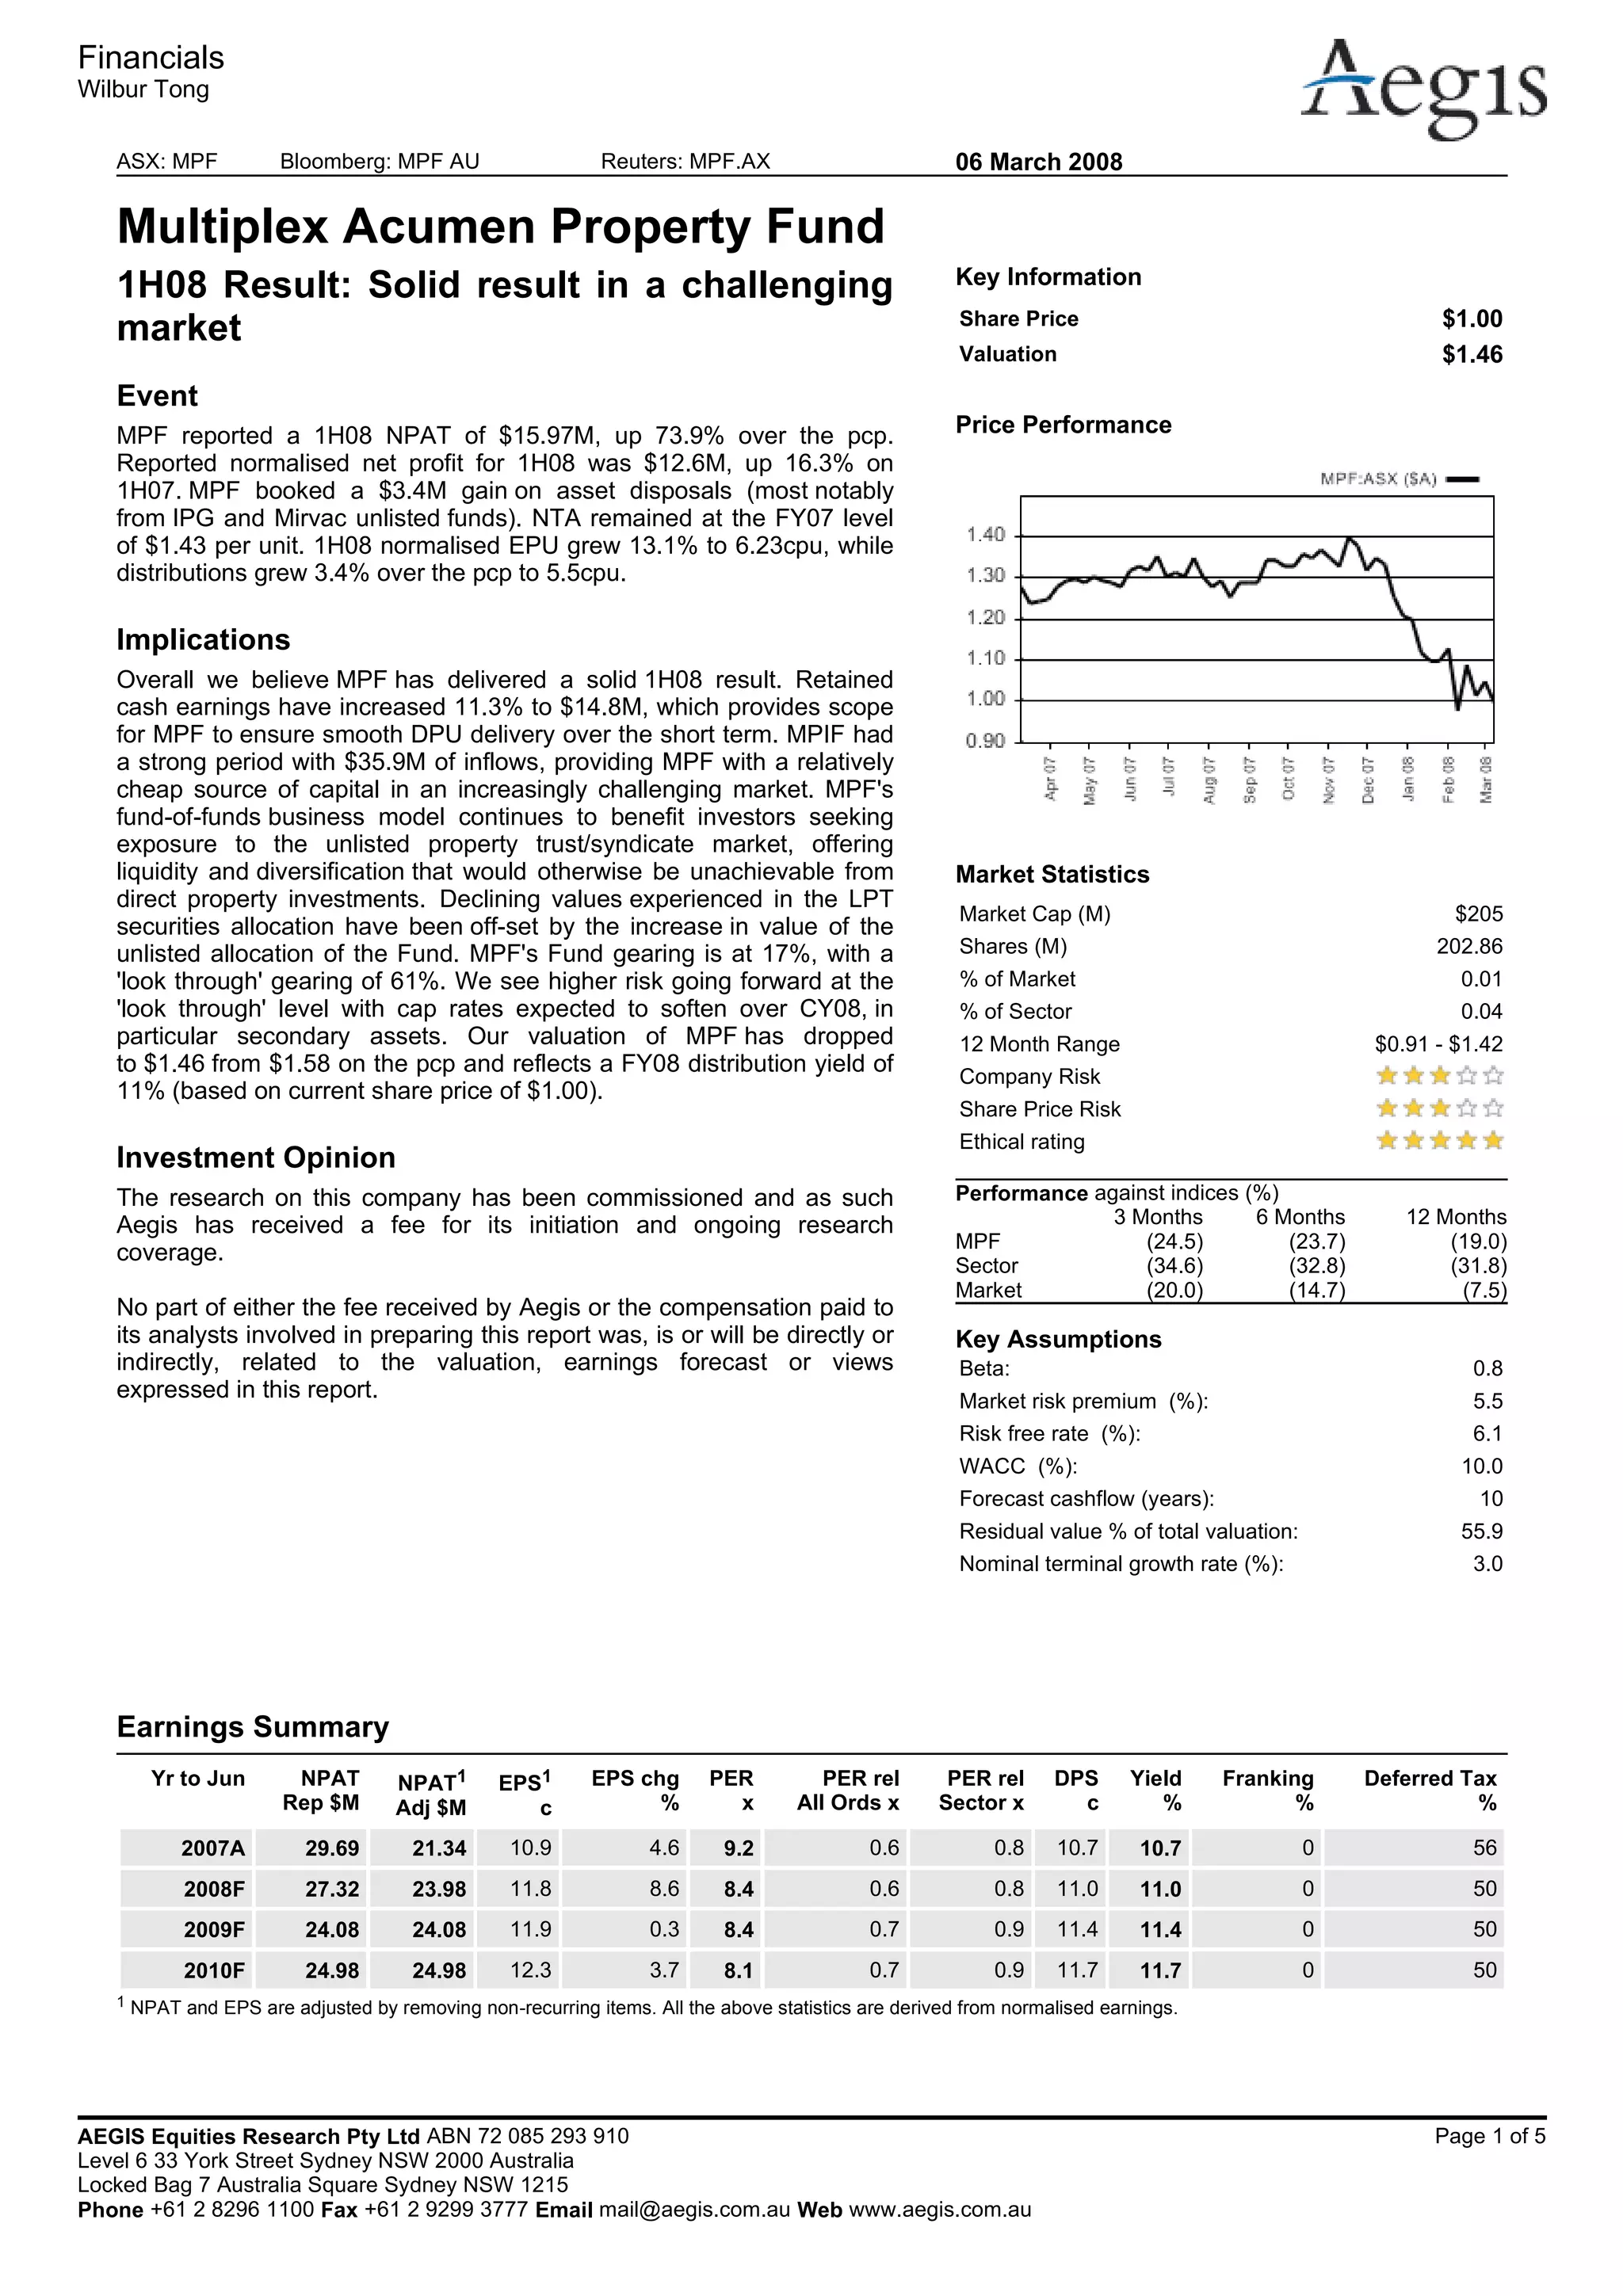
MPF reported a 1H08 NPAT of $15.97M, up 73.9% over 1H07. Normalised NPAT was $12.6M, up 16.3% on 1H07. Total assets increased 9.3% to $439.2M, driven by $13.9M in unlisted revaluation gains and $20.3M in unlisted investments, offset by a $16.5M decrease in listed securities. NTA remained at $1.43 per unit. Normalized EPU grew 13.1% and distributions grew 3.4% to 5.5cpu. Retained earnings increased 11.3% to $14.8M and