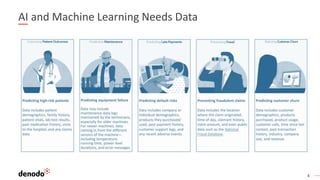
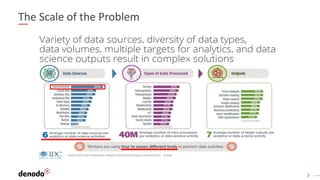
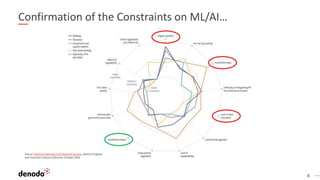
Advanced Analytics and
Machine Learning:
Removing Friction from the Data
Pipeline with Data Virtualization
Alexey Sidorov
Chief Evangelist Middle East & Eastern Europe
June 2020
Alexey Sidorov
Chief Evangelist Middle East &
Eastern Europe, Denodo
Speakers
1. What are Advanced Analytics?
2. The Data Challenge
3. The Rise of Logical Data Architectures
4. Tackling the Data Pipeline Problem
5. Real-time Machine Learning with Data Virtualization
6. Key Takeaways
7. Q&A
8. Next Steps
Agenda
4
AI and Machine Learning Needs Data
5
The Economist
The world’s most valuable resource
is no longer oil, but data.
6
Data – New Oil … but Not Easy To Extract & Deliver
7
The Scale of the Problem
8
Confirmation of the Constraints on ML/AI…
Logical Data Warehouse
9
Logical Data Warehouse Architecture
Reporting
Analytics
Data Science
Data Market Place
Data Monetization
AI/ML
iPaaS
Kafka
ETL
CDC
Sqoop
Flume
RawDataZoneStagingArea
CuratedDataZoneCoreDWHmodel
Data Warehouse
Data Lake
Data Virtualization Platform
Analytical Views
Data Science Views
λ Views
Real-Time Views
DWH Views
Hybrid Views
Cloud Views
UniversalCatalogofDataServices
CentralizedAccessControl
Logical Data Warehouse
11
Gartner, Adopt the Logical Data Warehouse Architecture to Meet Your Modern
Analytical Needs, May 2018
“When designed properly, Data Virtualization can speed data
integration, lower data latency, offer flexibility and reuse, and
reduce data sprawl across dispersed data sources.
Due to its many benefits, Data Virtualization is often the first step
for organizations evolving a traditional, repository-style data
warehouse into a Logical Architecture”
Tackling the Data Pipeline Problem
12
13
Typical Data Science Workflow
A typical workflow for a data scientist is:
1. Gather the requirements for the business problem
2. Identify and ingest data useful for the case
3. Cleanse data into a useful format
4. Analyze data
5. Prepare input for your algorithms
6. Execute data science algorithms (ML, AI, etc.)
7. Visualize and share
14
Typical Data Science Workflow
80% of time – Finding and preparing the data
10% of time – Analysis
10% of time – Visualizing data
15
Where Does Your Time Go?
A large amount of time and effort goes into tasks not intrinsically related to data science:
• Finding where the right data may be
• Getting access to the data
• Bureaucracy
• Understand access methods and technology (noSQL, REST APIs, etc.)
• Transforming data into a format easy to work with
• Combining data originally available in different sources and formats
• Profile and cleanse data to eliminate incomplete or inconsistent data points
Demonstration
Accelerating the Machine Learning Data Pipeline
with Data Virtualization
16
17
https://flic.kr/p/x8HgrF
Can we predict the usage of the NYC bike
system based on data from previous years?
18
Data Sources – Citibike
19
https://flic.kr/p/CYT7SS
20
Data Sources – NWS Weather Data
21
What We’re Going To Do…
1. Connect to data and have a look
2. Format the data (prep it) so that we can look for significant factors
• e.g. bike trips on different days of week, different months of year, etc.
3. Once we’ve decided on the significant attributes, prepare that data for the ML
algorithm
4. Using Python, read the 2019 data and run it through our ML algorithm for training
5. Read the 2020 data, test the algorithm
6. Save the results and load them into the Denodo Platform
Demo
22
Key Takeaways
23
24
The Key Ingredient for Advanced Analytics is…Data ☺
Input data for a data science project may come in a variety of systems and formats.
Some examples:
• Files (CSV, logs, Parquet)
• Relational databases (EDW, operational systems)
• NoSQL systems (key-value pairs, document stores, time series, etc.)
• SaaS APIs (Salesforce, Marketo, ServiceNow, Facebook, Twitter, etc.)
In addition, the Big Data community has also embraced data science as one of their
pillars. For example Spark and SparkML, and architectural patterns like the Data Lake
25
Key Takeaways
• Finally…People don’t like to ride their bikes in the cold weather
• The Denodo Platform makes all kinds of data – from a variety of data sources –
readily available to your data analysts and data scientists
• Data virtualization shortens the ‘data wrangling’ phases of analytics/ML projects
• Avoids needing to write ‘data prep’ scripts in Python, R, etc.
• It’s easy to access and analyze the data from analytics tools such as Zeppelin or
Jupyter
• You can use the Denodo Platform to share the results of your analytics with others
Q&A
Customers
800+ customers
Many F500 & G2000
Offices
Head quarters : A Coruna (Spain) and Palo-Alto
California
Offices: Paris, Munich, London, Madrid, Dubai,
Riyahd …
Denodo
20 years of experience in Data Virtualisation
Recognized as the leader by independent analysts
(Forrester, Gartner)
Many IT Industry rewards and nominations
NEXT STEPS
Download
Denodo Express
Take a cloud test-
drive (1h)
Get Denodo training
ABOUT DENODO
https://www.denodo.com/en/denodo-platform/test-drives
www.denodo.com
LET’S FIGHT COVID-19 TOGETHER!
Open Covid-19 Data Portal
About Denodo
Thanks!
www.denodo.com info@denodo.com
© Copyright Denodo Technologies. All rights reserved
Unless otherwise specified, no part of this PDF file may be reproduced or utilized in any for or by any means, electronic or mechanical, including photocopying and microfilm,
without prior the written authorization from Denodo Technologies.

Advanced Analytics and Machine Learning with Data Virtualization

  • 1.
    Advanced Analytics and MachineLearning: Removing Friction from the Data Pipeline with Data Virtualization Alexey Sidorov Chief Evangelist Middle East & Eastern Europe June 2020
  • 2.
    Alexey Sidorov Chief EvangelistMiddle East & Eastern Europe, Denodo Speakers
  • 3.
    1. What areAdvanced Analytics? 2. The Data Challenge 3. The Rise of Logical Data Architectures 4. Tackling the Data Pipeline Problem 5. Real-time Machine Learning with Data Virtualization 6. Key Takeaways 7. Q&A 8. Next Steps Agenda
  • 4.
    4 AI and MachineLearning Needs Data
  • 5.
    5 The Economist The world’smost valuable resource is no longer oil, but data.
  • 6.
    6 Data – NewOil … but Not Easy To Extract & Deliver
  • 7.
    7 The Scale ofthe Problem
  • 8.
    8 Confirmation of theConstraints on ML/AI…
  • 9.
  • 10.
    Logical Data WarehouseArchitecture Reporting Analytics Data Science Data Market Place Data Monetization AI/ML iPaaS Kafka ETL CDC Sqoop Flume RawDataZoneStagingArea CuratedDataZoneCoreDWHmodel Data Warehouse Data Lake Data Virtualization Platform Analytical Views Data Science Views λ Views Real-Time Views DWH Views Hybrid Views Cloud Views UniversalCatalogofDataServices CentralizedAccessControl Logical Data Warehouse
  • 11.
    11 Gartner, Adopt theLogical Data Warehouse Architecture to Meet Your Modern Analytical Needs, May 2018 “When designed properly, Data Virtualization can speed data integration, lower data latency, offer flexibility and reuse, and reduce data sprawl across dispersed data sources. Due to its many benefits, Data Virtualization is often the first step for organizations evolving a traditional, repository-style data warehouse into a Logical Architecture”
  • 12.
    Tackling the DataPipeline Problem 12
  • 13.
    13 Typical Data ScienceWorkflow A typical workflow for a data scientist is: 1. Gather the requirements for the business problem 2. Identify and ingest data useful for the case 3. Cleanse data into a useful format 4. Analyze data 5. Prepare input for your algorithms 6. Execute data science algorithms (ML, AI, etc.) 7. Visualize and share
  • 14.
    14 Typical Data ScienceWorkflow 80% of time – Finding and preparing the data 10% of time – Analysis 10% of time – Visualizing data
  • 15.
    15 Where Does YourTime Go? A large amount of time and effort goes into tasks not intrinsically related to data science: • Finding where the right data may be • Getting access to the data • Bureaucracy • Understand access methods and technology (noSQL, REST APIs, etc.) • Transforming data into a format easy to work with • Combining data originally available in different sources and formats • Profile and cleanse data to eliminate incomplete or inconsistent data points
  • 16.
    Demonstration Accelerating the MachineLearning Data Pipeline with Data Virtualization 16
  • 17.
    17 https://flic.kr/p/x8HgrF Can we predictthe usage of the NYC bike system based on data from previous years?
  • 18.
  • 19.
  • 20.
    20 Data Sources –NWS Weather Data
  • 21.
    21 What We’re GoingTo Do… 1. Connect to data and have a look 2. Format the data (prep it) so that we can look for significant factors • e.g. bike trips on different days of week, different months of year, etc. 3. Once we’ve decided on the significant attributes, prepare that data for the ML algorithm 4. Using Python, read the 2019 data and run it through our ML algorithm for training 5. Read the 2020 data, test the algorithm 6. Save the results and load them into the Denodo Platform
  • 22.
  • 23.
  • 24.
    24 The Key Ingredientfor Advanced Analytics is…Data ☺ Input data for a data science project may come in a variety of systems and formats. Some examples: • Files (CSV, logs, Parquet) • Relational databases (EDW, operational systems) • NoSQL systems (key-value pairs, document stores, time series, etc.) • SaaS APIs (Salesforce, Marketo, ServiceNow, Facebook, Twitter, etc.) In addition, the Big Data community has also embraced data science as one of their pillars. For example Spark and SparkML, and architectural patterns like the Data Lake
  • 25.
    25 Key Takeaways • Finally…Peopledon’t like to ride their bikes in the cold weather • The Denodo Platform makes all kinds of data – from a variety of data sources – readily available to your data analysts and data scientists • Data virtualization shortens the ‘data wrangling’ phases of analytics/ML projects • Avoids needing to write ‘data prep’ scripts in Python, R, etc. • It’s easy to access and analyze the data from analytics tools such as Zeppelin or Jupyter • You can use the Denodo Platform to share the results of your analytics with others
  • 26.
  • 27.
    Customers 800+ customers Many F500& G2000 Offices Head quarters : A Coruna (Spain) and Palo-Alto California Offices: Paris, Munich, London, Madrid, Dubai, Riyahd … Denodo 20 years of experience in Data Virtualisation Recognized as the leader by independent analysts (Forrester, Gartner) Many IT Industry rewards and nominations NEXT STEPS Download Denodo Express Take a cloud test- drive (1h) Get Denodo training ABOUT DENODO https://www.denodo.com/en/denodo-platform/test-drives www.denodo.com LET’S FIGHT COVID-19 TOGETHER! Open Covid-19 Data Portal About Denodo
  • 28.
    Thanks! www.denodo.com info@denodo.com © CopyrightDenodo Technologies. All rights reserved Unless otherwise specified, no part of this PDF file may be reproduced or utilized in any for or by any means, electronic or mechanical, including photocopying and microfilm, without prior the written authorization from Denodo Technologies.