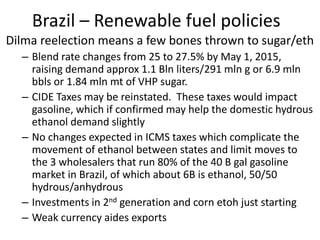
Global Economic Outlook for Ethanol Producers 
Joe Harroun 
Advance Trading, Inc (ATI)
Advance Trading, Inc 
• 
Started in 1980, employee owned S Corporation 
• 
Experts in the industry to provide advisory and execution services to agribusiness worldwide. 
• 
Well established, profitable firm, low turnover 
• 
Top quality personnel with an industry leading proven track record 
• 
Branch office network spans U.S. Cornbelt 
• 
Main office in Bloomington IL
Crude oil prices collapse. 10 year treasury notes 2.16%, US Dollar very strong… Market is probing levels that shutter inefficient crude oil producers.
The breakeven price for every international oil company project through 2020 
Source: Ed Morse
EIA Short Term Energy Outlook –Supplies outpace Demand The 2015 global demand forecast was also revised downward by 0.2 million bbl/d to an average of 92.3 million bbl/d, based on weaker global economic growth prospects for next year. 
Source: EIA
Crude Oil WTI Seasonal Chart 
Source: HDEA Analytics
Crude Oil Brent Seasonal Chart 
Source: HDEA Analytics
ULSD Heating Oil Seasonal Chart 
Source: HDEA Analytics
Gasoline Seasonal Chart 
Source: HDEA Analytics
Chicago Ethanol ITT Seasonal Chart 
Source: Platts 
Many will say this simply reflects tightness in front month ethanol for Chicago, yest traded $2.08/g ITT Argo, while CBOB was pegged at $1.53/g, diff $.55/g
Corn Seasonal Chart 
Source: CME Group
Ethanol close to RBOB Q1 ’15, by driving season more normal, reflective nearby Chicago strength in ethanol 
0 
0.05 
0.1 
0.15 
0.2 
0.25 
0.3 
0.35 
Jan 
Feb 
Mar 
April 
May 
June 
July 
August 
Sep 
Oct 
Nov 
Dec 
$ / gallon 
RBOB - Ethanol (CU)
Global Factors Impacting Ethanol Mfg 
• 
Price relationships 
• 
Blend economics worldwide 
• 
Economic health of key trade partners 
• 
Renewable fuel policies globally 
• 
Co-product demand 
• 
Feedstock supplies
Midwest Corn Gross Cash Crush Ethanol Seasonal 
.48 
.44 
.27 
.81 
1.08 
Anyone can operate a plant. We make it or lose it by buying , selling and converting better than the competition. A plant is a thing we must put up with as an operating base for exercising our procurement, trading and merchandising skills. Economics of Futures Trading, Thomas A Hieronymus, 1971
Chicago In Tank Ethanol Price 12 year average Hi to Low $1.22/g 
1.04 1.40 1.77 2.06 2.29 2.62 1.84 2.21 2.89 3.03 2.92 2.85 RBOB 
31 41 57 66 72 99 62 79 95 94 98 95 WTI 
Source: Platts, CME Group
Chicago In Tank Seasonal Average Monthly Price & Variation 2003-2014 
0 
10 
20 
30 
40 
50 
60 
70 
80 
185 
190 
195 
200 
205 
210 
215 
220 
Standard Deviation 
Average 
Source: Platts
Record high Q3 ‘14 Earning Highlights 
• 
REX 12/4/14 record third-quarter net income of $23.3 million 
– 
We have not sold out all of our ethanol in the future markets and can take advantage of more favorable spot or index pricing," 
– 
"We have no long-term hedges out there; everything is either spot or index pricing. Most people in the industry, I imagine, are on index or spot pricing because ... there is no real market to hedge if you look at the futures market,“ 
• 
ANDE 11/6/14 Ethanol Group net income for the quarter was $21.3 million, up from $10.9 million LY 
– 
Looking ahead, CFO John Granato told analysts on a conference call that the company has hedged 85% of its anticipated fourth-quarter production and almost half of its anticipated January production. However, those hedges are not locking in the extraordinary profits enjoyed in ethanol and DDGS at times in the last year. 
• 
GPRE 10/29/14 Third-quarter 2014 EBITDA $91.4 million, compared with $37.4 million same period in 2013. 
– 
As Becker explained on a conference call with analysts on Wednesday, for the fourth quarter of this year, the company is approximately 65% hedged as of today, with approximately 50% open for the remainder of November and December. 
– 
"We locked margins away before the current correction, but we are starting to see those margins recover quite nicely and believe the rest of the quarter has excellent market fundamentals to build on," he said.
Chicago In Tank Seasonal Average Monthly Price 2003-2014, ’15 paper 
100 
150 
200 
250 
300 
350 
Jan 
Feb 
Mar 
Apr 
May 
June 
July 
Aug 
Sep 
Oct 
Nov 
Dec 
2015 Chi Platts 
LT Low 
LT average Cash Chi 
ST MIN 2010-2014 
ST MAX 2010-2014 
ST Average 2010-2014 
2004 
Source: Platts, CME Group 
LT=Long Term, 14y 
ST= Short Term, 5y
US Ethanol Fundamentals 
So if Run-rate expectations of 957kbpd Q1 ’15 are realized AND 
exports verify at 58 kbpd Q1 ’15, then Inventory builds to 21-22 mln bbls Q1 
How might we avoid that build ??? 
To hold stocks at 18 mln bbls in Q1, presuming stronger NI & limited imports 
Q1 Run-rates at 927 vs. 909kbpd LY would do it 
Or 
Q1 Exports at 88kbpd vs. 64kbpd LY would do it 
-- 
After Q1 US driving season and exports may help keep inventories in check
Cash gasoline & ethanol Chicago 
Source: Reuters/Eikon
Keeping tabs on US ethanol imports Spike in US ethanol in Nov sparked fuel imports, above and beyond the nominal flow of imports devoted to re- exported products, < 100 mgy imports expected
286, 44% 
78, 12% 
68, 11% 
52, 8% 
26, 4% 
23, 4% 
19, 3% 
16, 2% 
14, 2% 
14, 2% 
14, 2% 
13, 2% 
9, 1% 
6, 1% 
3, 1% 
3 
3 
2 
Canada 
Brazil 
United Arab Em 
Philippines 
Korea 
Mexico 
Spain 
Netherlands 
Jamaica 
Tunisia 
India 
Peru 
Singapore 
Finland 
Nigeria 
China 
Colombia 
Panama 
Israel 
January – October 2014, US Ethanol Exports , Mln G, % ttl 
Source: U.S. Census
January – October 2014, US Ethanol Exports , Mln G 
Source: U.S. Census 
2014JanuaryFebruaryMarchAprilMayJuneJulyAugustSeptemberOctoberNovemberDecemberCanada19,275,52217,120,88028,333,95648,379,08630,497,88034,006,05633,393,82232,249,70028,440,84622,966,650294,664,398Brazil23,941,80612,963,88813,906,6209,357,5585,232,822011,594,6880766,62677,764,008UAE12,357,4086,902,6587,988,90403,891,5525,016,6068,241,4085,046,6782,558,76616,336,23668,340,216Philippines5,452,02008,684,0042,728,3202,715,4262,662,04405,265,8347,899,19216,254,08451,660,924EU484,84813,947,6962,486,508429,1982,960,7065,632,4946,360,942235,5368,934,9121,429,76442,902,604South Korea1,370,8383,760,3864,097,6043,109,1764,713,2822,839,78849,5182,714,9641,066,7586,860,28030,582,594Mexico3,365,1242,172,3662,184,546578,8862,119,9085,872,9023,503,8922,383,2482,434,6143,948,75628,564,242Jamaica2,554,4822,562,0004,156,27825,36817,3462,504,62835,0702,610,80414,465,976Tunisia2,770,53000011,268,01214,038,542Peru2,112,9783,286,9202,091,5583,243,5762,049,516012,784,548Spain4,310,5444,726,3443,347,98812,384,876India10,725,5825,54433,97811,21412,55810,788,876Nigeria3,172,00803,415,98603,602,21410,190,208Netherlands5,344,6681,277,6826,622,350China3,304,2663,304,266Colombia1,018,9621,018,0381,010,646041,4123,089,058Singapore1,028,874247,0021,275,8762014 Total gal86,489,13062,566,43479,585,95066,710,36455,446,46864,894,57867,905,68454,802,44063,667,42281,355,09285,680,00078,120,000847,223,562bpd67,96349,16462,53852,42143,56950,99453,36043,06350,02963,92867,32761,386 
If we get strong exports as expected in Nov-Dec, annual exports look to be 850 mln g 
The concern in the trade is the customers without mandates e.g. UAE, South Korea, 
Mexico, Tunisia, Nigeria, China will buy on energy and relative octane value to substitutes 
Like Akylate, MTBE, and others
-6 
-4 
-2 
0 
2 
4 
6 
8 
10 
12 
2000 
2001 
2002 
2003 
2004 
2005 
2006 
2007 
2008 
2009 
2010 
2011 
2012 
2013 
2014 
2015 
2016 
Canada 
Brazil 
United Arab Em 
Philipines 
GDP YoY change for Key Ethanol Importers Reasonable 
Source: World Bank
0 
500 
1,000 
1,500 
2,000 
2,500 
3,000 
10,000 
12,000 
14,000 
16,000 
18,000 
20,000 
22,000 
1980 
1981 
1982 
1983 
1984 
1985 
1986 
1987 
1988 
1989 
1990 
1991 
1992 
1993 
1994 
1995 
1996 
1997 
1998 
1999 
2000 
2001 
2002 
2003 
2004 
2005 
2006 
2007 
2008 
2009 
2010 
2011 
2012 
2013 
2014 
2015 
K Bbl/day (Canada) 
K Bbl/day (US) 
Crude Oil Consumption 
Canada 
U.S. 
Real per capita GDP projected to grow 1.2 and 1.6% for Canada and US respectively leading to potential increased energy use next year of about 1.3%. If the 35% reduction in crude oil holds, this could double growth rates based on GDP alone 
Source: World Bank, ATI
As a basic input to many industries, Copper prices are not indicative of strong economic activity
China Crush Margins despite record soybean imports are not on fire
Source: The Economist
Canada #1 US ethanol market 
• 
Actual ethanol blend exceed 5% federal mandate because of positive blend economics since 2011 
• 
Federal ethanol mandate requires only 528 mln g ethanol 
• 
2014 estimated consumption 821 mln g ethanol 
• 
2014 production capacity 461 mln g from corn & wheat feedstocks 
• 
2014 imports projected 365 mln g 
• 
If blend economics turn negative, will demand revert to 5% federal mandate? 
• 
Big focus on advance renewable fuel from indigenous Canadian industries 
0.0% 
1.0% 
2.0% 
3.0% 
4.0% 
5.0% 
6.0% 
7.0% 
8.0% 
2006 
2007 
2008 
2009 
2010 
2011 
2012 
2013 
2014 
2015 
Canadian Ethanol Blend Rate 
• 
Due to NAFTA no tariff on US ethanol, while Brazil has a 5c/liter tariff
World Renewable Fuel Stakeholder 
• 
Brazil - Sugarcane and soon corn ethanol producer 
– 
While Brazil’s sugar/ethanol industry profits are limited, the fact remains that October 2014 Center / South inventories are 66.5 mln bbls, up from 52.0 mln bbls LY. 
– 
Sugar mills can shift 10% between sugar and ethanol, this allowed Brazil to build huge inventories despite a short crop of sugarcane 
– 
70% of Brazil’s power comes from Hydro, electricity prices vary widely, due to drought $.3/KW-Hr, therefore Begasse (cane residue left after sucrose extraction is valuable. Begasse powers the entire plant and puts power back on the grid
World Renewable Fuel Stakeholder
222 
229 
223 
218 
241 
252 
288 
303 
315 
307 
258 
293 
321 
359 
386 
387 
426 
496 
569 
602 
620 
559 
588 
651 
630 
609 
626 
648 
0.0 
100.0 
200.0 
300.0 
400.0 
500.0 
600.0 
700.0 
90/91 
91/92 
92/93 
93/94 
94/95 
95/96 
96/97 
97/98 
98/99 
99/00 
00/01 
01/02 
02/03 
03/04 
04/05 
05/06 
06/07 
07/08 
08/09 
09/10 
10/11 
11/12 
12/13 
13/14 
14/15 
15/16 Lo 
15/16 Mid 
15/16 Hi 
Total BRAZIL Sugar cane Production 
10% grown in north east – Sep – March 90% grown in center/south – April - November
Brazil – Renewable fuel policies 
Dilma reelection means a few bones thrown to sugar/eth 
– 
Blend rate changes from 25 to 27.5% by May 1, 2015, raising demand approx 1.1 Bln liters/291 mln g or 6.9 mln bbls or 1.84 mln mt of VHP sugar. 
– 
CIDE Taxes may be reinstated. These taxes would impact gasoline, which if confirmed may help the domestic hydrous ethanol demand slightly 
– 
No changes expected in ICMS taxes which complicate the movement of ethanol between states and limit moves to the 3 wholesalers that run 80% of the 40 B gal gasoline market in Brazil, of which about 6B is ethanol, 50/50 hydrous/anhydrous 
– 
Investments in 2nd generation and corn etoh just starting 
– 
Weak currency aides exports
Cane Harvester 
Source: AT Educational Excursion September 2014
Cane Harvester 
Source: AT Educational Excursion September 2014
Cane transportation 
Source: AT Educational Excursion September 2014
Transportation Equipment 
Source: AT Educational Excursion September 2014
Asian Ethanol Policies Key to US Ethanol Exports 
• 
The Philippines 
– 
Gasoline use 1.2Bgy 
– 
@10% = 120 mgy 
– 
Domestic production 46mgy 
– 
Imports 77 mgy 
– 
Weather / Typhoon impacts 
• 
Thailand 
– 
Gas demand 2.2 Bgy 
– 
@13.4% = 300 mgy 
– 
molasses 55%, Cassava 30%, 15% sugarcane 
– 
Zero imports of ethanol 
– 
Growth in E20 and E85 may limit exports 
– 
Exports: 2009 4mgy, 2010 12, 2011 44, 2012 80, 2013 17 mgy Philippine Ethanol Imports Mln gCountry of OriginJan - Oct2011201220132014USA1522052Brazil0012Subic Freeport182513Thailand62310Vietnam327Australia075Indonesia102Singapore561Korea1011Others009Totals576679
U.S. - Renewable Fuel Policies 
• 
Status quo – limited to no growth policies 
• 
Obligated parties yet to turn in 2013 RINS 
• 
Obligated parties yet to know RVO for 2014 maybe buy April 2015? 
• 
Obligated parties continue to buy cellulosic waiver credits in lieu of buying cellulosic because the cost 25c/rin g plus inflation since 2008, and if cellulosic mandates are revised lower obligated parties are refunded full value of waiver credits… this kill’s commercial activity dependent on cellulosic (D3) rins.
36% 
32% 
35% 
34% 
31% 
28% 
36% 
33% 
26% 
27% 
36% 
32% 
36% 
29% 
27% 
27% 
25% 
27% 
33% 
29% 
32% 
29% 
28% 
29% 
31% 
32% 
28% 
32% 
29% 
16% 
19% 
20% 
17% 
19% 
20% 
16% 
18% 
25% 
21% 
18% 
19% 
19% 
21% 
21% 
21% 
24% 
18% 
16% 
20% 
21% 
19% 
17% 
21% 
23% 
15% 
17% 
17% 
17% 
23% 
0% 
5% 
10% 
15% 
20% 
25% 
30% 
35% 
40% 
Quarterly Producer Corn Sales 
SON 
DJF 
MAM 
JJA 
Producer Marketing Corn History 2015 suggests slow start, and cash basis has been firm suggesting we may seem a merchandising 101 axiom to create movement 1) basis rallies, 2) futures spreads firm or narrow 3) flat price rallies – we are not far from $4.00 cash corn today
Corn Supply & Demand
Disclaimer 
This material is a solicitation to enter into a derivatives transaction. The information and data contained herein have been obtained from sources believed to be reliable but Advance Trading Inc. ("Advance") does not warrant their accuracy or completeness. Recommendations and opinions contained herein reflect the judgment of Advance as of the date hereof, are subject to change, and are based on certain assumptions, only some of which are noted herein. Different assumptions could yield substantially different results. You are cautioned that there is no universally accepted method for analyzing financial instruments. Advance does not guarantee any results and there is no guarantee as to the liquidity of the instruments involved in our analysis. Advance, its affiliates, and its and their officers, directors, and employees may sell or purchase, for their own account or for customers, positions in futures, options or other instruments which may be similar or different from the positions referred to herein. As a matter of policy, Advance does not give tax, accounting, regulatory or legal advice to clients. Clients therefore should consult their own advisors regarding the tax, accounting and legal implications of the recommended strategies before transactions are affected. Trading commodity futures and options involves significant risk and is not appropriate for all investors. Information relating to past performance is not necessarily indicative of future results. Reproduction in any form without Advance's express written consent is strictly forbidden.
All Wheat Supply & Demand
Soybean Supply & Demand

Global Economic Outlook for Ethanol Producers

  • 1.
    Global Economic Outlookfor Ethanol Producers Joe Harroun Advance Trading, Inc (ATI)
  • 2.
    Advance Trading, Inc • Started in 1980, employee owned S Corporation • Experts in the industry to provide advisory and execution services to agribusiness worldwide. • Well established, profitable firm, low turnover • Top quality personnel with an industry leading proven track record • Branch office network spans U.S. Cornbelt • Main office in Bloomington IL
  • 3.
    Crude oil pricescollapse. 10 year treasury notes 2.16%, US Dollar very strong… Market is probing levels that shutter inefficient crude oil producers.
  • 4.
    The breakeven pricefor every international oil company project through 2020 Source: Ed Morse
  • 5.
    EIA Short TermEnergy Outlook –Supplies outpace Demand The 2015 global demand forecast was also revised downward by 0.2 million bbl/d to an average of 92.3 million bbl/d, based on weaker global economic growth prospects for next year. Source: EIA
  • 6.
    Crude Oil WTISeasonal Chart Source: HDEA Analytics
  • 7.
    Crude Oil BrentSeasonal Chart Source: HDEA Analytics
  • 8.
    ULSD Heating OilSeasonal Chart Source: HDEA Analytics
  • 9.
    Gasoline Seasonal Chart Source: HDEA Analytics
  • 10.
    Chicago Ethanol ITTSeasonal Chart Source: Platts Many will say this simply reflects tightness in front month ethanol for Chicago, yest traded $2.08/g ITT Argo, while CBOB was pegged at $1.53/g, diff $.55/g
  • 11.
    Corn Seasonal Chart Source: CME Group
  • 12.
    Ethanol close toRBOB Q1 ’15, by driving season more normal, reflective nearby Chicago strength in ethanol 0 0.05 0.1 0.15 0.2 0.25 0.3 0.35 Jan Feb Mar April May June July August Sep Oct Nov Dec $ / gallon RBOB - Ethanol (CU)
  • 13.
    Global Factors ImpactingEthanol Mfg • Price relationships • Blend economics worldwide • Economic health of key trade partners • Renewable fuel policies globally • Co-product demand • Feedstock supplies
  • 14.
    Midwest Corn GrossCash Crush Ethanol Seasonal .48 .44 .27 .81 1.08 Anyone can operate a plant. We make it or lose it by buying , selling and converting better than the competition. A plant is a thing we must put up with as an operating base for exercising our procurement, trading and merchandising skills. Economics of Futures Trading, Thomas A Hieronymus, 1971
  • 15.
    Chicago In TankEthanol Price 12 year average Hi to Low $1.22/g 1.04 1.40 1.77 2.06 2.29 2.62 1.84 2.21 2.89 3.03 2.92 2.85 RBOB 31 41 57 66 72 99 62 79 95 94 98 95 WTI Source: Platts, CME Group
  • 16.
    Chicago In TankSeasonal Average Monthly Price & Variation 2003-2014 0 10 20 30 40 50 60 70 80 185 190 195 200 205 210 215 220 Standard Deviation Average Source: Platts
  • 17.
    Record high Q3‘14 Earning Highlights • REX 12/4/14 record third-quarter net income of $23.3 million – We have not sold out all of our ethanol in the future markets and can take advantage of more favorable spot or index pricing," – "We have no long-term hedges out there; everything is either spot or index pricing. Most people in the industry, I imagine, are on index or spot pricing because ... there is no real market to hedge if you look at the futures market,“ • ANDE 11/6/14 Ethanol Group net income for the quarter was $21.3 million, up from $10.9 million LY – Looking ahead, CFO John Granato told analysts on a conference call that the company has hedged 85% of its anticipated fourth-quarter production and almost half of its anticipated January production. However, those hedges are not locking in the extraordinary profits enjoyed in ethanol and DDGS at times in the last year. • GPRE 10/29/14 Third-quarter 2014 EBITDA $91.4 million, compared with $37.4 million same period in 2013. – As Becker explained on a conference call with analysts on Wednesday, for the fourth quarter of this year, the company is approximately 65% hedged as of today, with approximately 50% open for the remainder of November and December. – "We locked margins away before the current correction, but we are starting to see those margins recover quite nicely and believe the rest of the quarter has excellent market fundamentals to build on," he said.
  • 18.
    Chicago In TankSeasonal Average Monthly Price 2003-2014, ’15 paper 100 150 200 250 300 350 Jan Feb Mar Apr May June July Aug Sep Oct Nov Dec 2015 Chi Platts LT Low LT average Cash Chi ST MIN 2010-2014 ST MAX 2010-2014 ST Average 2010-2014 2004 Source: Platts, CME Group LT=Long Term, 14y ST= Short Term, 5y
  • 19.
    US Ethanol Fundamentals So if Run-rate expectations of 957kbpd Q1 ’15 are realized AND exports verify at 58 kbpd Q1 ’15, then Inventory builds to 21-22 mln bbls Q1 How might we avoid that build ??? To hold stocks at 18 mln bbls in Q1, presuming stronger NI & limited imports Q1 Run-rates at 927 vs. 909kbpd LY would do it Or Q1 Exports at 88kbpd vs. 64kbpd LY would do it -- After Q1 US driving season and exports may help keep inventories in check
  • 20.
    Cash gasoline &ethanol Chicago Source: Reuters/Eikon
  • 21.
    Keeping tabs onUS ethanol imports Spike in US ethanol in Nov sparked fuel imports, above and beyond the nominal flow of imports devoted to re- exported products, < 100 mgy imports expected
  • 22.
    286, 44% 78,12% 68, 11% 52, 8% 26, 4% 23, 4% 19, 3% 16, 2% 14, 2% 14, 2% 14, 2% 13, 2% 9, 1% 6, 1% 3, 1% 3 3 2 Canada Brazil United Arab Em Philippines Korea Mexico Spain Netherlands Jamaica Tunisia India Peru Singapore Finland Nigeria China Colombia Panama Israel January – October 2014, US Ethanol Exports , Mln G, % ttl Source: U.S. Census
  • 23.
    January – October2014, US Ethanol Exports , Mln G Source: U.S. Census 2014JanuaryFebruaryMarchAprilMayJuneJulyAugustSeptemberOctoberNovemberDecemberCanada19,275,52217,120,88028,333,95648,379,08630,497,88034,006,05633,393,82232,249,70028,440,84622,966,650294,664,398Brazil23,941,80612,963,88813,906,6209,357,5585,232,822011,594,6880766,62677,764,008UAE12,357,4086,902,6587,988,90403,891,5525,016,6068,241,4085,046,6782,558,76616,336,23668,340,216Philippines5,452,02008,684,0042,728,3202,715,4262,662,04405,265,8347,899,19216,254,08451,660,924EU484,84813,947,6962,486,508429,1982,960,7065,632,4946,360,942235,5368,934,9121,429,76442,902,604South Korea1,370,8383,760,3864,097,6043,109,1764,713,2822,839,78849,5182,714,9641,066,7586,860,28030,582,594Mexico3,365,1242,172,3662,184,546578,8862,119,9085,872,9023,503,8922,383,2482,434,6143,948,75628,564,242Jamaica2,554,4822,562,0004,156,27825,36817,3462,504,62835,0702,610,80414,465,976Tunisia2,770,53000011,268,01214,038,542Peru2,112,9783,286,9202,091,5583,243,5762,049,516012,784,548Spain4,310,5444,726,3443,347,98812,384,876India10,725,5825,54433,97811,21412,55810,788,876Nigeria3,172,00803,415,98603,602,21410,190,208Netherlands5,344,6681,277,6826,622,350China3,304,2663,304,266Colombia1,018,9621,018,0381,010,646041,4123,089,058Singapore1,028,874247,0021,275,8762014 Total gal86,489,13062,566,43479,585,95066,710,36455,446,46864,894,57867,905,68454,802,44063,667,42281,355,09285,680,00078,120,000847,223,562bpd67,96349,16462,53852,42143,56950,99453,36043,06350,02963,92867,32761,386 If we get strong exports as expected in Nov-Dec, annual exports look to be 850 mln g The concern in the trade is the customers without mandates e.g. UAE, South Korea, Mexico, Tunisia, Nigeria, China will buy on energy and relative octane value to substitutes Like Akylate, MTBE, and others
  • 24.
    -6 -4 -2 0 2 4 6 8 10 12 2000 2001 2002 2003 2004 2005 2006 2007 2008 2009 2010 2011 2012 2013 2014 2015 2016 Canada Brazil United Arab Em Philipines GDP YoY change for Key Ethanol Importers Reasonable Source: World Bank
  • 25.
    0 500 1,000 1,500 2,000 2,500 3,000 10,000 12,000 14,000 16,000 18,000 20,000 22,000 1980 1981 1982 1983 1984 1985 1986 1987 1988 1989 1990 1991 1992 1993 1994 1995 1996 1997 1998 1999 2000 2001 2002 2003 2004 2005 2006 2007 2008 2009 2010 2011 2012 2013 2014 2015 K Bbl/day (Canada) K Bbl/day (US) Crude Oil Consumption Canada U.S. Real per capita GDP projected to grow 1.2 and 1.6% for Canada and US respectively leading to potential increased energy use next year of about 1.3%. If the 35% reduction in crude oil holds, this could double growth rates based on GDP alone Source: World Bank, ATI
  • 26.
  • 27.
    As a basicinput to many industries, Copper prices are not indicative of strong economic activity
  • 28.
    China Crush Marginsdespite record soybean imports are not on fire
  • 29.
  • 30.
    Canada #1 USethanol market • Actual ethanol blend exceed 5% federal mandate because of positive blend economics since 2011 • Federal ethanol mandate requires only 528 mln g ethanol • 2014 estimated consumption 821 mln g ethanol • 2014 production capacity 461 mln g from corn & wheat feedstocks • 2014 imports projected 365 mln g • If blend economics turn negative, will demand revert to 5% federal mandate? • Big focus on advance renewable fuel from indigenous Canadian industries 0.0% 1.0% 2.0% 3.0% 4.0% 5.0% 6.0% 7.0% 8.0% 2006 2007 2008 2009 2010 2011 2012 2013 2014 2015 Canadian Ethanol Blend Rate • Due to NAFTA no tariff on US ethanol, while Brazil has a 5c/liter tariff
  • 31.
    World Renewable FuelStakeholder • Brazil - Sugarcane and soon corn ethanol producer – While Brazil’s sugar/ethanol industry profits are limited, the fact remains that October 2014 Center / South inventories are 66.5 mln bbls, up from 52.0 mln bbls LY. – Sugar mills can shift 10% between sugar and ethanol, this allowed Brazil to build huge inventories despite a short crop of sugarcane – 70% of Brazil’s power comes from Hydro, electricity prices vary widely, due to drought $.3/KW-Hr, therefore Begasse (cane residue left after sucrose extraction is valuable. Begasse powers the entire plant and puts power back on the grid
  • 32.
  • 33.
    222 229 223 218 241 252 288 303 315 307 258 293 321 359 386 387 426 496 569 602 620 559 588 651 630 609 626 648 0.0 100.0 200.0 300.0 400.0 500.0 600.0 700.0 90/91 91/92 92/93 93/94 94/95 95/96 96/97 97/98 98/99 99/00 00/01 01/02 02/03 03/04 04/05 05/06 06/07 07/08 08/09 09/10 10/11 11/12 12/13 13/14 14/15 15/16 Lo 15/16 Mid 15/16 Hi Total BRAZIL Sugar cane Production 10% grown in north east – Sep – March 90% grown in center/south – April - November
  • 34.
    Brazil – Renewablefuel policies Dilma reelection means a few bones thrown to sugar/eth – Blend rate changes from 25 to 27.5% by May 1, 2015, raising demand approx 1.1 Bln liters/291 mln g or 6.9 mln bbls or 1.84 mln mt of VHP sugar. – CIDE Taxes may be reinstated. These taxes would impact gasoline, which if confirmed may help the domestic hydrous ethanol demand slightly – No changes expected in ICMS taxes which complicate the movement of ethanol between states and limit moves to the 3 wholesalers that run 80% of the 40 B gal gasoline market in Brazil, of which about 6B is ethanol, 50/50 hydrous/anhydrous – Investments in 2nd generation and corn etoh just starting – Weak currency aides exports
  • 35.
    Cane Harvester Source:AT Educational Excursion September 2014
  • 36.
    Cane Harvester Source:AT Educational Excursion September 2014
  • 37.
    Cane transportation Source:AT Educational Excursion September 2014
  • 38.
    Transportation Equipment Source:AT Educational Excursion September 2014
  • 39.
    Asian Ethanol PoliciesKey to US Ethanol Exports • The Philippines – Gasoline use 1.2Bgy – @10% = 120 mgy – Domestic production 46mgy – Imports 77 mgy – Weather / Typhoon impacts • Thailand – Gas demand 2.2 Bgy – @13.4% = 300 mgy – molasses 55%, Cassava 30%, 15% sugarcane – Zero imports of ethanol – Growth in E20 and E85 may limit exports – Exports: 2009 4mgy, 2010 12, 2011 44, 2012 80, 2013 17 mgy Philippine Ethanol Imports Mln gCountry of OriginJan - Oct2011201220132014USA1522052Brazil0012Subic Freeport182513Thailand62310Vietnam327Australia075Indonesia102Singapore561Korea1011Others009Totals576679
  • 40.
    U.S. - RenewableFuel Policies • Status quo – limited to no growth policies • Obligated parties yet to turn in 2013 RINS • Obligated parties yet to know RVO for 2014 maybe buy April 2015? • Obligated parties continue to buy cellulosic waiver credits in lieu of buying cellulosic because the cost 25c/rin g plus inflation since 2008, and if cellulosic mandates are revised lower obligated parties are refunded full value of waiver credits… this kill’s commercial activity dependent on cellulosic (D3) rins.
  • 41.
    36% 32% 35% 34% 31% 28% 36% 33% 26% 27% 36% 32% 36% 29% 27% 27% 25% 27% 33% 29% 32% 29% 28% 29% 31% 32% 28% 32% 29% 16% 19% 20% 17% 19% 20% 16% 18% 25% 21% 18% 19% 19% 21% 21% 21% 24% 18% 16% 20% 21% 19% 17% 21% 23% 15% 17% 17% 17% 23% 0% 5% 10% 15% 20% 25% 30% 35% 40% Quarterly Producer Corn Sales SON DJF MAM JJA Producer Marketing Corn History 2015 suggests slow start, and cash basis has been firm suggesting we may seem a merchandising 101 axiom to create movement 1) basis rallies, 2) futures spreads firm or narrow 3) flat price rallies – we are not far from $4.00 cash corn today
  • 42.
  • 43.
    Disclaimer This materialis a solicitation to enter into a derivatives transaction. The information and data contained herein have been obtained from sources believed to be reliable but Advance Trading Inc. ("Advance") does not warrant their accuracy or completeness. Recommendations and opinions contained herein reflect the judgment of Advance as of the date hereof, are subject to change, and are based on certain assumptions, only some of which are noted herein. Different assumptions could yield substantially different results. You are cautioned that there is no universally accepted method for analyzing financial instruments. Advance does not guarantee any results and there is no guarantee as to the liquidity of the instruments involved in our analysis. Advance, its affiliates, and its and their officers, directors, and employees may sell or purchase, for their own account or for customers, positions in futures, options or other instruments which may be similar or different from the positions referred to herein. As a matter of policy, Advance does not give tax, accounting, regulatory or legal advice to clients. Clients therefore should consult their own advisors regarding the tax, accounting and legal implications of the recommended strategies before transactions are affected. Trading commodity futures and options involves significant risk and is not appropriate for all investors. Information relating to past performance is not necessarily indicative of future results. Reproduction in any form without Advance's express written consent is strictly forbidden.
  • 44.
  • 45.