Downloaded 3,026 times


![Troubleshooting and Optimizing UMTS Network Workshop 12
Scanner Attributes (Coverage Related Events)
Uu_Scan_PilotPollution (Pilot Pollution)
Actix Software s event detection allows you to visualize pilot pollution
on a map with drive test scanner data. The pilot pollution event occurs
when 4 or more pilots with Ec/Io greater than
Uu_PilotPollutionThreshold are can be seen.
Uu_Scan_TooManyServer (Too Many Servers)
Due to UMTS uses relative levels to evaluate additions/removals to the
active set. Actix Software has a different event that allows the
engineer to visualize pilot pollution relative to the best server. The
Too Many Servers event behaves similarly like the pilot pollution
event except with relative levels. The event occurs when 4 or more
pilots with Ec/No within Uu_Scan_TooManyServersThreshold dB of
the best server (CPICH_Scan_EcIo_SortedBy_EcIo [0]).
Other Information Attributes (Emulated Active Set Module)
EventCellAddition
EventCellRemoval
EcIo_in_ActiveSet
EcIo_in_MonitoredSet
CPICH Pollution Analysis and Handoff Analysis are both based on a
calculated Active Set, which is determined by the Emulated Active Set
module. The Emulated Active Set module implements the 3GPP
handoff algorithm and uses scanner Ec/Io measurements in
conjunction with user-specific 3GPP handoff thresholds to emulate the
Active Set at each point along a drive test.](https://image.slidesharecdn.com/100498575-actix-troubleshooting-and-optimizing-umts-network-130729033034-phpapp01/85/actix-troubleshooting-and-optimizing-umts-network-12-320.jpg)


![Troubleshooting and Optimizing UMTS Network Workshop 56
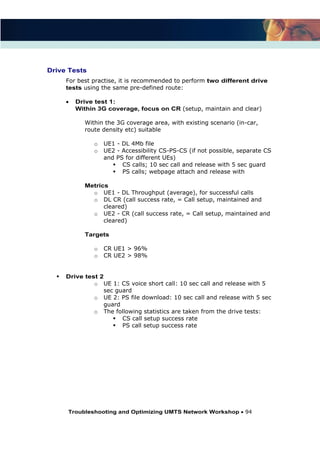
Criteria 3: Avoiding pilot pollution
In order to detect pilot pollution, the following criterion needs to be checked:
Number of
[Best CPICH Ec/Io - CPICH Ec/Io 2 x SHO_ w indow ] 4
All measurement points fulfilling the criterion above suffer from pilot pollution
and optimization changes need to be undertaken. The possible solution for
pilot pollution can be:
Up tilt the antenna providing the best server in the area in order to
improve the CPICH RSCP
Down tilt the antennas from interfering cells and as such reduce the
RSSI.
Change azimuth from antennas in order to create a dominant server in
the polluted area.
In the following graph you can detect an area of pilot pollution. The next step
in this case would be to detect which of the surrounding sites is covering the
area and to try to limit the amount of servers through up- and down tilting.
That comes down to creating 1 or 2 dominant servers.](https://image.slidesharecdn.com/100498575-actix-troubleshooting-and-optimizing-umts-network-130729033034-phpapp01/85/actix-troubleshooting-and-optimizing-umts-network-56-320.jpg)


![Troubleshooting and Optimizing UMTS Network Workshop 114
Step Action
4 Keep the workbook open. Switch back to Actix Software and
display the Uu_CallDropped (from UMTS Event Data Call
data group) on the existing workbook (active workbook).
Notice how all three views from these two attributes have been added
to the workbook (Series, Histogram and S.tatistic Formatted Data
tabs).
5 Save your workbook
6 To create new query, goto Analysis Manager (ctrl-A)
7 Create a histogram query using the Uu_UE_HandoffState
parameter, and creating discrete values from 0 (inclusive) to 6
(inclusive).
8 Create a crosstab query with FileName from the Attribute
Picker( ) as the dimension, and add 2 new statistics for:
Mean (linear) of Uu_ActiveSet_RSCP[0] formatted as
WCDMA RSCP, and
Sum of Uu_CallDuration formatted as Time.
9 Save your query into the workspace and check the results are
accurate.
10 Open the report template through the Workbook Open
Workbook/Report menu option, and choose to run it on your log
file.
11 Right-click on Queries folder, find your new query and display it on
the existing workbook. It will be added to a new sheet called
Crosstab Formatted Data.
12 These tabs will contain the results from whatever file you run the
report template on. Open Sheet 1 and create your KPI statistics
here as follows (see next page):](https://image.slidesharecdn.com/100498575-actix-troubleshooting-and-optimizing-umts-network-130729033034-phpapp01/85/actix-troubleshooting-and-optimizing-umts-network-114-320.jpg)


The document provides an overview of troubleshooting and optimizing UMTS networks using Actix software. It covers topics such as scanner thresholds and attributes, UE thresholds and attributes, site integration, cluster integration, cell reselection, handover analysis, and report generation. The document aims to teach engineers how to use Actix software to identify issues, analyze data, develop optimization solutions, and fine-tune network performance through an understanding of integration procedures and optimization techniques. Various examples are provided to illustrate concepts like coverage analysis, dropped call analysis, and determining hardware problems during site integration.


![10 gsm bss network kpi (uplink downlink balance) optimization manual[1].doc](https://cdn.slidesharecdn.com/ss_thumbnails/10gsmbssnetworkkpiuplink-downlinkbalanceoptimizationmanual1-140618022209-phpapp01-thumbnail.jpg?width=640&height=640&fit=bounds)