
Recommended
More Related Content
Similar to activity in linear and non-linear.pptx
Similar to activity in linear and non-linear.pptx (20)
More from LOVELYANNESCOBIDO1
Recently uploaded
Recently uploaded (20)
activity in linear and non-linear.pptx
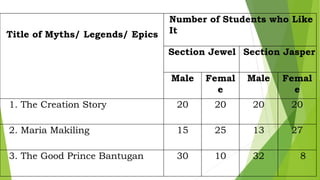
- 1. Title of Myths/ Legends/ Epics Number of Students who Like It Section Jewel Section Jasper Male Femal e Male Femal e 1. The Creation Story 20 20 20 20 2. Maria Makiling 15 25 13 27 3. The Good Prince Bantugan 30 10 32 8
- 2. 1. How many students are there in section Jewel? How about in section Jasper? 2. Based on the sections surveyed, what conclusions can you make about the preferred story of male and female students? 3. Write at least (5) sentences about the data as inferred from the chart.
- 3. Directions: Read the following linear text and transcode it to non- linear text.
- 4. Suppose you are selling two different kinds of magazine for a school fund- raising campaign. Show how you keep track of your sales for one week by using a graph with the following data:
- 5. Monday: 6 fashion magazines and 2 sports magazines, Tuesday: 6 fashion magazines and 3 sports magazines, Wednesday: 8 fashion magazines and 5 sports magazines, Thursday: 6 fashion magazines and 3 sports magazines, Friday: 2 fashion magazines and 4 sports magazines, Saturday: 3 fashion magazines and 1 sports magazine, and Sunday: 2 fashion magazines and 1 sports magazine.
- 6. According to the survey, 33% of the students listen to pop music while 29% listen to indie and rock music, 15% listen to country music, 13% listen to metal, and 10% listen to classical music.
- 7. You were given by your parents five hundred pesos as allowance good for a week. Based on the pie graph shown below, how much would be allotted for each of the following areas? Write your answers on a separate sheet of paper.
- 9. Recall some highlights in your life’s journey and make a Road Map. Describe each stop by using pictures and descriptions that tell the story of how you arrived at this point in your life. You must have a minimum of 5 “stops”.
Editor's Notes
- A. Below is a chart containing the result of a survey taken from two sections of Grade 7 classes. Study the data presented and answer the questions or do the required tasks.
- Let us see if you can use non-linear texts in real- life situations.