Acid Base Titration curves.pptx
•
1 like•144 views

"A titration curve is a plot of pH vs the amount of titrant added.”

Recommended
More Related Content
What's hot
What's hot (20)
Similar to Acid Base Titration curves.pptx
Similar to Acid Base Titration curves.pptx (20)
More from CLASH CATALYSTS
Recently uploaded
Recently uploaded (20)
Acid Base Titration curves.pptx
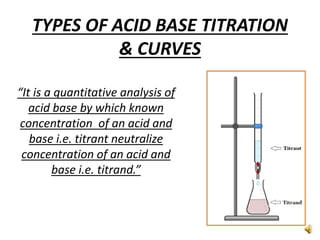
- 1. TYPES OF ACID BASE TITRATION & CURVES “It is a quantitative analysis of acid base by which known concentration of an acid and base i.e. titrant neutralize concentration of an acid and base i.e. titrand.”
- 2. Types of acid & base titration • There are 4 types of acid & base titration . Strong Acid & Strong Base HCl & NaOH Strong Acid & Weak Base HCl & NH3 Weak Acid & Strong Base CH3COOH & NaOH Weak Acid & Weak Base CH3COOH & NH3 TYPES OF ACID & BASE TITRATION
- 3. TITRATION CURVES “A titration curve is a plot of pH vs the amount of titrant added.” Graph:- • pH = Y-axis • volume of titrant = on X-axis. Typically titrant is strong completely dissociated acid or base. • These curves are useful for determining the end points and dissociation constant of acid and base.
- 4. ACID BASE pH at Equivalence INDICATOR Strong Strong = 7 Neutral Methyl orange Phenolphthalein Strong Weak <7 Acidic Methyl orange Weak Strong >7 Basic Phenolphthalein Weak Weak pH depends on ka &kb of acid and base concentration pH Of Acid Base Reaction At Its Equivalence Point
- 5. 1- Strong Acid And Strong Base Strong acid is taken in conical flask and titrated with strong base. • The strong acid is completely dissolved in water and it produces H+ ions which are neutralized by OH- ions present in the strong base solution. HCl + H20 → H30+ +Cl- At Equivalence point:- • The H+ is completely neutralized by OH- ions. • The # o f moles of NaOH= the # of moles of HCl NaOH + HCl → NaCl+ H2O
- 6. In the graph :- • Initially, it shows that the slow rise in pH and then there is a sharp rise in the pH. • This indicates that the neutralization is completed. pH at equivalence point =7 Example :- HCl & NaOH
- 7. 2- Strong Acid & Weak Base Weak base is taken in the conical flask and a little quantity of indicator is added. Then the resulting solution is titrated with strong acid. Graph:- • The plot between pH and titrant shows decrease in pH and then at the end point the rapid pH drop and then remain constant. • This indicates the completion of neutralization by the formation of salts. HCl + NH3 → NH4Cl
- 8. pH at equivalence point <7 (acidic) • Example :- HCl & NH3
- 9. 3- Weak Acid And Strong Base • The weak acid is taken in the conical flask and the appropriate indicator is added. Then it is titrated with strong base. • When weak base is dissolve in water it partially dissociate the H+ ions which is then neutralized by the strong base that are produced the OH- ions. CH3COOH +H20 → CH3COO- + H30+ Graph = • Initially , shows the low pH and then after adding the strong base , it shows the increase in pH and at the end point it shows the sharp increase in pH . • This indicates the completion of the neutralization. CH3COOH + NaOH → CH3COONa + H20
- 10. • pH at equivalence point >7 (basic) Example :- CH3COOH & NaOH
- 11. 4- Weak Acid And Weak Base The weak acid is taken in the conical flask then add the appropriate indicator and then titrate with the weak base. • It is titrated until the color change appears. • The weak acid is partially dissociated and is neutralized with the NH3 which is the weak base. Graph= • It shows the continuous decrease in the pH . • Ph Change is not observed rapidly. • End point is indicated by the formation of salt CH3COOH + NH3 → CH3COONH4
- 12. At equivalence point, pH depends on ka &kb of acid and base concentration Example :- CH3COOH & NH3