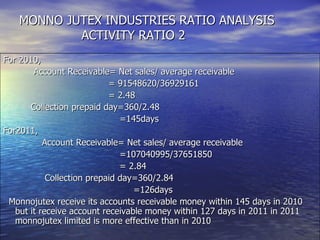
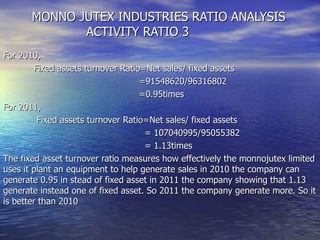
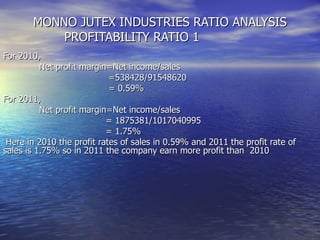
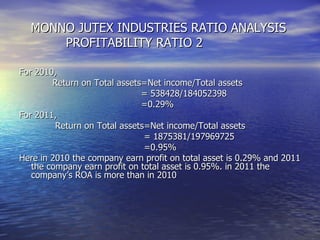
1) The document presents a ratio analysis of Monno Jutex Industries Ltd for the years 2010 and 2011. It analyzes various financial ratios including liquidity ratios, activity ratios, profitability ratios, and coverage ratios.
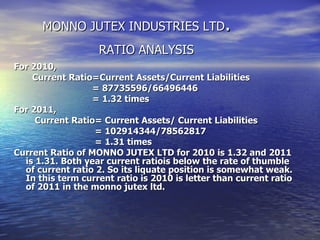
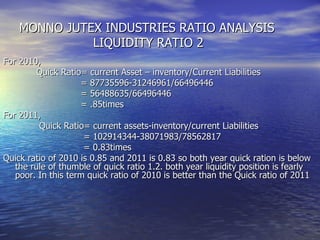
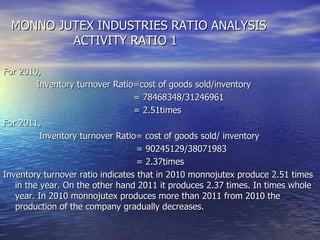
2) The current ratio and quick ratio for both years were below benchmarks, indicating weak liquidity position. Inventory turnover declined from 2010 to 2011.
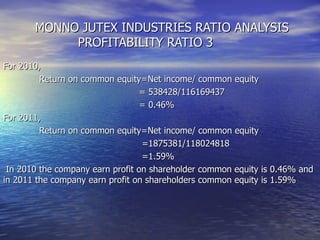
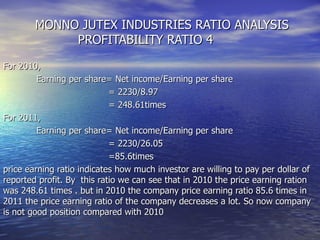
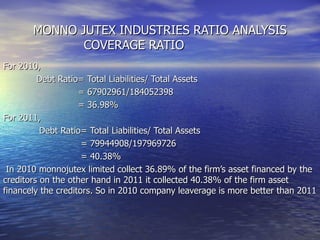
3) Net profit margin, return on assets, and return on equity increased from 2010 to 2011, while price-earnings ratio, debt ratio, and earnings per share decreased.