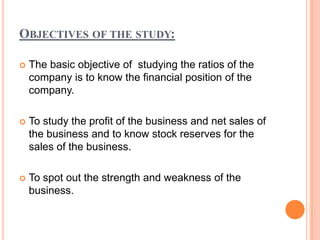
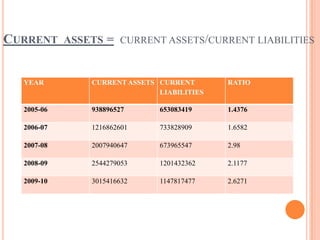
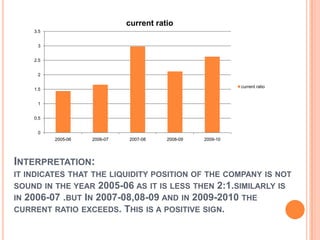
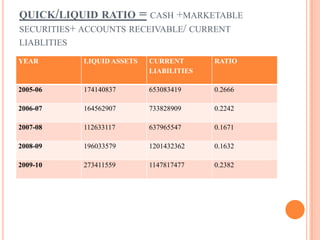
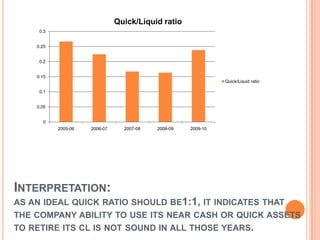
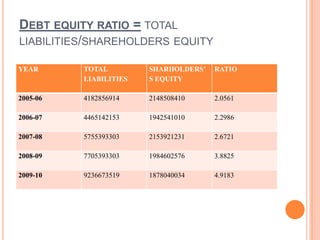
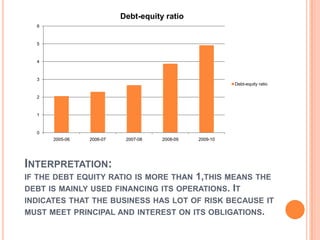
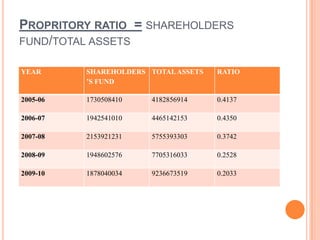
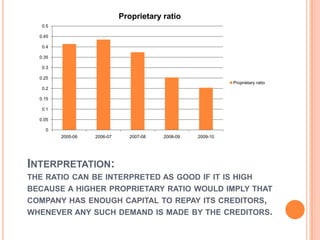
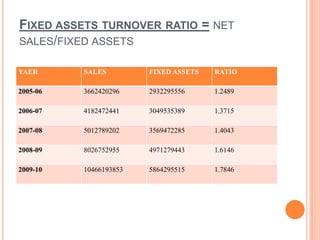
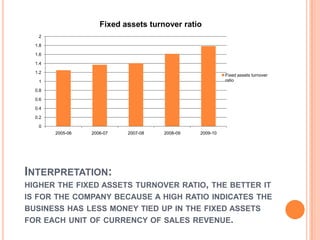
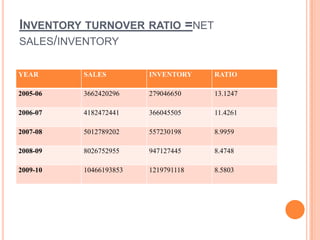
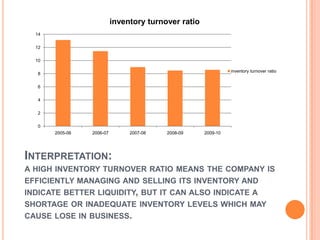
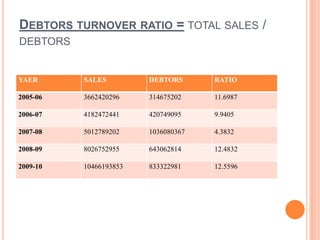
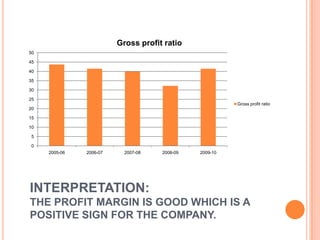
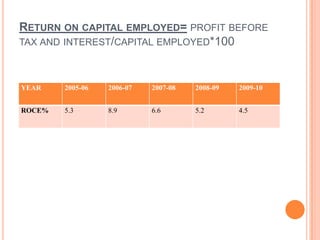
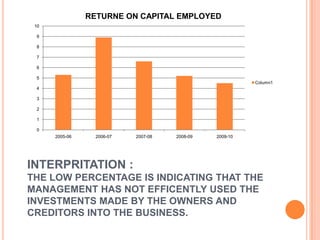
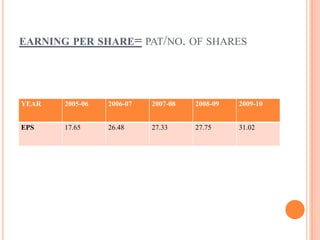
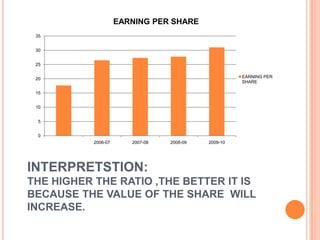
SlideShare a Scribd company logo
1 of 34
A PRESENTATION ON THE TOPIC :
        RATIO ANALYSIS

 FOR THE TRAINING UNDER GONE AT:


PRESENTED BY:     SOURABH MODGIL
                  5TH SEMESTER
                   ROLL NO. - 44
COMPANY PROFILE

   Liberty group started operation in 1954 and comprises of
    five firms namely:

   Liberty footwear company
   Liberty enterprise
   Liberty leathers
   Liberty group marketing division
   Liberty shoes limitted
   The company was started by three dreamers in a
    small town- MR.DP GUPTA,MR.PD GUPTA AND
    MR.R BANSAL.

    Liberty Shoes have been fashioning footwear, for
    well over 50 years now Currently with an annual
    turnover exceeding INR.600 crore (U.S. $150
    million), we figure amongst the top 5 manufacturers
    of leather footwear of the world producing more
    than 50,000 pairs a day.

   Liberty has quality-seeking customers in more than
    25 countries.
BRANDS
OBJECTIVES OF THE STUDY:

   The basic objective of studying the ratios of the
    company is to know the financial position of the
    company.

   To study the profit of the business and net sales of
    the business and to know stock reserves for the
    sales of the business.

   To spot out the strength and weakness of the
    business.
CURRENT ASSETS =   CURRENT ASSETS/CURRENT LIABILITIES


  YEAR      CURRENT ASSETS CURRENT       RATIO
                           LIABILITIES

  2005-06   938896527      653083419     1.4376

  2006-07   1216862601     733828909     1.6582

  2007-08   2007940647     673965547     2.98

  2008-09   2544279053     1201432362    2.1177

  2009-10   3015416632     1147817477    2.6271
current ratio
    3.5


     3


    2.5


     2

                                                             current ratio
    1.5


     1


    0.5


     0
          2005-06   2006-07   2007-08    2008-09   2009-10


INTERPRETATION:
IT INDICATES THAT THE LIQUIDITY POSITION OF THE COMPANY IS NOT
SOUND IN THE YEAR 2005-06 AS IT IS LESS THEN 2:1.SIMILARLY IS
IN 2006-07 .BUT IN 2007-08,08-09 AND IN 2009-2010 THE
CURRENT RATIO EXCEEDS. THIS IS A POSITIVE SIGN.
QUICK/LIQUID RATIO = CASH +MARKETABLE
SECURITIES+ ACCOUNTS RECEIVABLE/ CURRENT
LIABLITIES

YEAR         LIQUID ASSETS   CURRENT       RATIO
                             LIABILITIES

2005-06      174140837       653083419     0.2666

2006-07      164562907       733828909     0.2242

2007-08      112633117       637965547     0.1671

2008-09      196033579       1201432362    0.1632

2009-10      273411559       1147817477    0.2382
Quick/Liquid ratio
     0.3


    0.25


     0.2


    0.15
                                                               Quick/Liquid ratio

     0.1


    0.05


      0
           2005-06   2006-07     2007-08   2008-09   2009-10


INTERPRETATION:
AS AN IDEAL QUICK RATIO SHOULD BE1:1, IT INDICATES THAT
THE COMPANY ABILITY TO USE ITS NEAR CASH OR QUICK ASSETS
TO RETIRE ITS CL IS NOT SOUND IN ALL THOSE YEARS.
DEBT EQUITY RATIO = TOTAL
LIABILITIES/SHAREHOLDERS EQUITY

YEAR      TOTAL         SHARHOLDERS’   RATIO
          LIABILITIES   S EQUITY

2005-06   4182856914    2148508410     2.0561

2006-07   4465142153    1942541010     2.2986

2007-08   5755393303    2153921231     2.6721

2008-09   7705393303    1984602576     3.8825

2009-10   9236673519    1878040034     4.9183
Debt-equity ratio
  6


  5


  4


  3
                                                         Debt-equity ratio

  2


  1


  0
      2005-06   2006-07    2007-08   2008-09   2009-10


INTERPRETATION:
IF THE DEBT EQUITY RATIO IS MORE THAN 1,THIS MEANS THE
DEBT IS MAINLY USED FINANCING ITS OPERATIONS. IT
INDICATES THAT THE BUSINESS HAS LOT OF RISK BECAUSE IT
MUST MEET PRINCIPAL AND INTEREST ON ITS OBLIGATIONS.
PROPRITORY RATIO = SHAREHOLDERS
FUND/TOTAL ASSETS

YEAR      SHAREHOLDERS TOTAL ASSETS   RATIO
          ’S FUND

2005-06   1730508410   4182856914     0.4137

2006-07   1942541010   4465142153     0.4350

2007-08   2153921231   5755393303     0.3742

2008-09   1948602576   7705316033     0.2528

2009-10   1878040034   9236673519     0.2033
Proprietary ratio
   0.5

  0.45

   0.4

  0.35

   0.3

  0.25
                                                             Proprietary ratio
   0.2

  0.15

   0.1

  0.05

    0
         2005-06   2006-07     2007-08   2008-09   2009-10


INTERPRETATION:
THE RATIO CAN BE INTERPRETED AS GOOD IF IT IS HIGH
BECAUSE A HIGHER PROPRIETARY RATIO WOULD IMPLY THAT
COMPANY HAS ENOUGH CAPITAL TO REPAY ITS CREDITORS,
WHENEVER ANY SUCH DEMAND IS MADE BY THE CREDITORS.
FIXED ASSETS TURNOVER RATIO = NET
SALES/FIXED ASSETS

YAER      SALES         FIXED ASSETS   RATIO

2005-06   3662420296    2932295556     1.2489

2006-07   4182472441    3049535389     1.3715

2007-08   5012789202    3569472285     1.4043

2008-09   8026752955    4971279443     1.6146

2009-10   10466193853   5864295515     1.7846
Fixed assets turnover ratio
   2

  1.8

  1.6

  1.4

  1.2
                                                          Fixed assets turnover
   1                                                      ratio

  0.8

  0.6

  0.4

  0.2

   0
        2005-06   2006-07   2007-08   2008-09   2009-10


INTERPRETATION:
HIGHER THE FIXED ASSETS TURNOVER RATIO, THE BETTER IT
IS FOR THE COMPANY BECAUSE A HIGH RATIO INDICATES THE
BUSINESS HAS LESS MONEY TIED UP IN THE FIXED ASSETS
FOR EACH UNIT OF CURRENCY OF SALES REVENUE.
INVENTORY TURNOVER RATIO =NET
SALES/INVENTORY

YEAR      SALES         INVENTORY    RATIO

2005-06   3662420296    279046650    13.1247

2006-07   4182472441    366045505    11.4261

2007-08   5012789202    557230198    8.9959

2008-09   8026752955    947127445    8.4748

2009-10   10466193853   1219791118   8.5803
inventory turnover ratio
  14

  12

  10

                                                                inventory turnover ratio
   8

   6

   4

   2

   0
       2005-06   2006-07        2007-08   2008-09     2009-10


INTERPRETATION:
A HIGH INVENTORY TURNOVER RATIO MEANS THE COMPANY IS
EFFICIENTLY MANAGING AND SELLING ITS INVENTORY AND
INDICATE BETTER LIQUIDITY, BUT IT CAN ALSO INDICATE A
SHORTAGE OR INADEQUATE INVENTORY LEVELS WHICH MAY
CAUSE LOSE IN BUSINESS.
DEBTORS TURNOVER RATIO = TOTAL SALES /
DEBTORS


YAER      SALES         DEBTORS      RATIO

2005-06   3662420296    314675202    11.6987

2006-07   4182472441    420749095    9.9405

2007-08   5012789202    1036080367   4.3832

2008-09   8026752955    643062814    12.4832

2009-10   10466193853   833322981    12.5596
Debtors turnover ratio
     14


     12


     10


      8
                                                                 Debtors turnover
                                                                 ratio
      6


      4


      2


      0
          2005-06   2006-07       2007-08   2008-09    2009-10


INTERPRETATION:
THE HIGHER THE VALUE OF DEBTORS TURNOVER RATIO ,THE
MORE EFFICIENT IS THE MANAGEMENT OF DEBTORS OR MORE
LIQUID THE DEBTOR’S ARE. HIGHER TURNOVER SIGNIFIES
SPEEDY AND EFFECTIVE COLLECTION.
WORKING CAPITAL TURNOVER RATIO=
COST OF SALES/NET WORKING CAPITAL

YEAR      COST OF SALES   NET WORKING   RATIO
                          CAPITAL

2005-06   3120167111      285813108     10.917

2006-07   3425500099      485813108     7.0916

2007-08   4326627922      1333975100    3.2434

2008-09   7444286989      1342846691    5.5437

2009-10   9424223978      1867599155    5.0461
Working capital turnover ratio
 12


 10


  8
                                                        Working capital turnover
                                                        ratio
  6


  4


  2


  0
      2005-06   2006-07   2007-08   2008-09   2009-10


INTERPRETATION:
            POSITIVE SIGN SHOWING THE
A HIGH RATIO IS
COMPANY IS ABLE TO GENRATE SALES FROM
AND INDICATES EFFICENT UTILISATION OF
WORKING CAPITAL.
TOTAL ASSETS TURNOVER RATIO= TOTAL
ASSETS/NET SALES


YEAR      TOTAL ASSETS   NET SALES     RATIO

2005-06   4182856914     3662420296    1.142

2006-07   4465142153     4182472441    1.068

2007-08   5755393303     5012789202    1.148

2008-09   7705316033     8026752955    0.959

2009-10   9236673519     10466193853   0.882
Total assets turnover ratio
  1.4

  1.2

   1

  0.8                                                     Total assets turnover
                                                          ratio
  0.6

  0.4

  0.2

   0
        2005-06   2006-07   2007-08   2008-09   2009-10


INTERPRETATION:
HIGHER THE COMPANY ASSETS TURNOVER
RATIO ,THE LOWER THE PROFIT MARGINES
SINCE THE COMPANY IS ABLE TO SALE MORE
PRODUCTS AT A CHEPER RATE.
NET PROFIT RATIO= NET PROFIT/SALES*100

YEAR      NET PROFIT   SALES         %

2005-06   845169350    3662420296    23.076

2006-07   1057201950   4182472441    25.276

2007-08   1266429294   5012789202    25.264

2008-09   1057292022   8026752955    13.172

2009-10   992700974    10466193853   9.485
net profit ratio
 30


 25


 20


 15
                                                          net profit ratio

 10


 5


 0
      2005-06   2006-07    2007-08    2008-09   2009-10


INTERPRETATION:
IT’S A NOT GOOD SIGN FOR THE COMPANY AS
HIGHER THE NET PROFIT RATIO WILL HELP THE
FIRM SERVICE IN THE FALL OF INCOME FROM THE
SERVICE S,RISE IN COST OF PRODUCTION OR
DECLINING DEMAND.
GROSS PROFIT RATIO= GROSS PROFIT/NET
SALES*100

YEAR      GROSS PROFIT   SALES         %

2005-06   1399308423     3662420296    43.71

2006-07   1513523474     4182472441    41.45

2007-08   1787683614     5012789202    39.93

2008-09   2410931568     8026752955    23.31

2009-10   4333815676     10466193853   41.41
Gross profit ratio
50

45

40

35

30

25
                                                         Gross profit ratio
20

15

10

 5

 0
     2005-06   2006-07     2007-08   2008-09   2009-10


INTERPRETATION:
THE PROFIT MARGIN IS GOOD WHICH IS A
POSITIVE SIGN FOR THE COMPANY.
RETURN ON CAPITAL EMPLOYED= PROFIT BEFORE
TAX AND INTEREST/CAPITAL EMPLOYED*100


YEAR    2005-06   2006-07   2007-08   2008-09   2009-10


ROCE%   5.3       8.9       6.6       5.2       4.5
RETURNE ON CAPITAL EMPLOYED
 10

 9

 8

 7

 6

 5
                                                          Column1
 4

 3

 2

 1

 0
      2005-06     2006-07   2007-08   2008-09   2009-10


INTERPRITATION :
THE LOW PERCENTAGE IS INDICATING THAT THE
MANAGEMENT HAS NOT EFFICENTLY USED THE
INVESTMENTS MADE BY THE OWNERS AND
CREDITORS INTO THE BUSINESS.
EARNING PER SHARE= PAT/NO. OF SHARES


YEAR   2005-06   2006-07   2007-08   2008-09   2009-10


EPS    17.65     26.48     27.33     27.75     31.02
EARNING PER SHARE
 35


 30


 25


 20                                                   EARNING PER
                                                      SHARE

 15


 10


  5


  0
           2006-07      2007-08   2008-09   2009-10


INTERPRETSTION:
THE HIGHER THE RATIO ,THE BETTER IT IS
BECAUSE THE VALUE OF THE SHARE WILL
INCREASE.
RECOMMENDATIONS AND SUGGESTIONS :
 Either the company should decrease the prices or
  the shoes of less price range should also be there
  so that need of every kind of customers could be
  fulfilled.
 The dealer should regularly visit the retailers and
  listen to there complaints .
 Stock should be verified more frequently to avoid
  difference between book figures and actual figures .
 Funds should be available in smooth and steady
  flow so that the construction at the site is not
  affected.
A presentation on the topic

More Related Content

What's hot

Working capital management of wcl
Working capital management of wclWorking capital management of wcl
Working capital management of wclkoach1787
 
Aerospace, Defense and Government Services Monthly Market Overview
Aerospace, Defense and Government Services Monthly Market OverviewAerospace, Defense and Government Services Monthly Market Overview
Aerospace, Defense and Government Services Monthly Market OverviewMichael Papazis
 
Cfa research presentation university at buffalo
Cfa research presentation university at buffalo Cfa research presentation university at buffalo
Cfa research presentation university at buffalo Ke Guo
 
Glaxo smithkline case study
Glaxo smithkline case studyGlaxo smithkline case study
Glaxo smithkline case studyKing Abidi
 
Activity-Based Costing
Activity-Based CostingActivity-Based Costing
Activity-Based Costingrexcris
 
ARG Presentation
ARG PresentationARG Presentation
ARG PresentationNoel Lally
 
Under Armour_Security Analysis
Under Armour_Security AnalysisUnder Armour_Security Analysis
Under Armour_Security AnalysisTrang Nguyen
 
Work Sample: BAUSCH+LOMB 2012 Sales Modeling
Work Sample: BAUSCH+LOMB 2012 Sales ModelingWork Sample: BAUSCH+LOMB 2012 Sales Modeling
Work Sample: BAUSCH+LOMB 2012 Sales ModelingBinglinglin
 
Financial Management
Financial ManagementFinancial Management
Financial ManagementPhú Tuấn
 
ACG Cup Executive Presentation
ACG Cup Executive PresentationACG Cup Executive Presentation
ACG Cup Executive PresentationJin Guo
 
Financial Ratio Analysis PowerPoint Presentation Slides
Financial Ratio Analysis PowerPoint Presentation SlidesFinancial Ratio Analysis PowerPoint Presentation Slides
Financial Ratio Analysis PowerPoint Presentation SlidesSlideTeam
 
Ratio Analysis on Maruti Suzuki
Ratio Analysis on Maruti SuzukiRatio Analysis on Maruti Suzuki
Ratio Analysis on Maruti SuzukiRahul's Ventures
 

What's hot (20)

Excel Model of Trading Firm
Excel Model of Trading FirmExcel Model of Trading Firm
Excel Model of Trading Firm
 
120981064 new-doll
120981064 new-doll120981064 new-doll
120981064 new-doll
 
Working capital management of wcl
Working capital management of wclWorking capital management of wcl
Working capital management of wcl
 
MF
MFMF
MF
 
Equity report
Equity reportEquity report
Equity report
 
Aerospace, Defense and Government Services Monthly Market Overview
Aerospace, Defense and Government Services Monthly Market OverviewAerospace, Defense and Government Services Monthly Market Overview
Aerospace, Defense and Government Services Monthly Market Overview
 
Cfa research presentation university at buffalo
Cfa research presentation university at buffalo Cfa research presentation university at buffalo
Cfa research presentation university at buffalo
 
Glaxo smithkline case study
Glaxo smithkline case studyGlaxo smithkline case study
Glaxo smithkline case study
 
Activity-Based Costing
Activity-Based CostingActivity-Based Costing
Activity-Based Costing
 
ARG Presentation
ARG PresentationARG Presentation
ARG Presentation
 
Equity Research Report 09 October 2018 Ways2Capital
Equity Research Report  09 October 2018 Ways2CapitalEquity Research Report  09 October 2018 Ways2Capital
Equity Research Report 09 October 2018 Ways2Capital
 
Under Armour_Security Analysis
Under Armour_Security AnalysisUnder Armour_Security Analysis
Under Armour_Security Analysis
 
Work Sample: BAUSCH+LOMB 2012 Sales Modeling
Work Sample: BAUSCH+LOMB 2012 Sales ModelingWork Sample: BAUSCH+LOMB 2012 Sales Modeling
Work Sample: BAUSCH+LOMB 2012 Sales Modeling
 
Financial Management
Financial ManagementFinancial Management
Financial Management
 
ACG Cup Executive Presentation
ACG Cup Executive PresentationACG Cup Executive Presentation
ACG Cup Executive Presentation
 
Financial Ratio Analysis PowerPoint Presentation Slides
Financial Ratio Analysis PowerPoint Presentation SlidesFinancial Ratio Analysis PowerPoint Presentation Slides
Financial Ratio Analysis PowerPoint Presentation Slides
 
Equity report 08 jan 2017
Equity  report 08 jan 2017Equity  report 08 jan 2017
Equity report 08 jan 2017
 
Ratio Analysis on Maruti Suzuki
Ratio Analysis on Maruti SuzukiRatio Analysis on Maruti Suzuki
Ratio Analysis on Maruti Suzuki
 
Rightside group
Rightside groupRightside group
Rightside group
 
61 it015707-mar-performance card
61 it015707-mar-performance card61 it015707-mar-performance card
61 it015707-mar-performance card
 

Viewers also liked

working capital of sandhar group
working capital of sandhar groupworking capital of sandhar group
working capital of sandhar groupSourabh Modgil
 
Relation Between Blindness and Dark in HOD (Heart of Darkness)
Relation Between Blindness and Dark in HOD (Heart of Darkness)Relation Between Blindness and Dark in HOD (Heart of Darkness)
Relation Between Blindness and Dark in HOD (Heart of Darkness)Water Birds (Ali)
 
Explain Popular Culture
Explain    Popular CultureExplain    Popular Culture
Explain Popular CulturePritiba Gohil
 
Gender Stereotypes In Sense And Sensibility
Gender Stereotypes In Sense And SensibilityGender Stereotypes In Sense And Sensibility
Gender Stereotypes In Sense And SensibilityPritiba Gohil
 
Fdi in indian banking system
Fdi in indian banking systemFdi in indian banking system
Fdi in indian banking systemSourabh Modgil
 
What is Popular Culture?
What is Popular Culture?What is Popular Culture?
What is Popular Culture?Dustin Kidd
 
Popular Culture
Popular CulturePopular Culture
Popular Culturejdodwyer
 
LIBRALISATION PRIVATISATION AND GLOBALISATION
LIBRALISATION PRIVATISATION AND GLOBALISATIONLIBRALISATION PRIVATISATION AND GLOBALISATION
LIBRALISATION PRIVATISATION AND GLOBALISATIONSourabh Modgil
 
Advertising and Sales promotion
Advertising and Sales promotionAdvertising and Sales promotion
Advertising and Sales promotionRah Mon
 
Music presentation.ppt
Music presentation.pptMusic presentation.ppt
Music presentation.pptToni
 
Demonetization of 500 and 1000
Demonetization of 500 and 1000Demonetization of 500 and 1000
Demonetization of 500 and 1000muthurajmsm
 
Presentation Topic.Music
Presentation Topic.MusicPresentation Topic.Music
Presentation Topic.MusicInder.Chahota
 
LinkedIn SlideShare: Knowledge, Well-Presented
LinkedIn SlideShare: Knowledge, Well-PresentedLinkedIn SlideShare: Knowledge, Well-Presented
LinkedIn SlideShare: Knowledge, Well-PresentedSlideShare
 

Viewers also liked (20)

Consumer learning
Consumer learningConsumer learning
Consumer learning
 
Public relations
Public relationsPublic relations
Public relations
 
working capital of sandhar group
working capital of sandhar groupworking capital of sandhar group
working capital of sandhar group
 
Sales promotion
Sales promotionSales promotion
Sales promotion
 
Relation Between Blindness and Dark in HOD (Heart of Darkness)
Relation Between Blindness and Dark in HOD (Heart of Darkness)Relation Between Blindness and Dark in HOD (Heart of Darkness)
Relation Between Blindness and Dark in HOD (Heart of Darkness)
 
Explain Popular Culture
Explain    Popular CultureExplain    Popular Culture
Explain Popular Culture
 
Project cost control
Project cost controlProject cost control
Project cost control
 
Gender Stereotypes In Sense And Sensibility
Gender Stereotypes In Sense And SensibilityGender Stereotypes In Sense And Sensibility
Gender Stereotypes In Sense And Sensibility
 
Fdi in indian banking system
Fdi in indian banking systemFdi in indian banking system
Fdi in indian banking system
 
What is Popular Culture?
What is Popular Culture?What is Popular Culture?
What is Popular Culture?
 
Demonetization
DemonetizationDemonetization
Demonetization
 
Popular Culture
Popular CulturePopular Culture
Popular Culture
 
LIBRALISATION PRIVATISATION AND GLOBALISATION
LIBRALISATION PRIVATISATION AND GLOBALISATIONLIBRALISATION PRIVATISATION AND GLOBALISATION
LIBRALISATION PRIVATISATION AND GLOBALISATION
 
Advertising and Sales promotion
Advertising and Sales promotionAdvertising and Sales promotion
Advertising and Sales promotion
 
Music presentation.ppt
Music presentation.pptMusic presentation.ppt
Music presentation.ppt
 
BALANCE OF PAYMENT
BALANCE OF PAYMENTBALANCE OF PAYMENT
BALANCE OF PAYMENT
 
Demonetization
DemonetizationDemonetization
Demonetization
 
Demonetization of 500 and 1000
Demonetization of 500 and 1000Demonetization of 500 and 1000
Demonetization of 500 and 1000
 
Presentation Topic.Music
Presentation Topic.MusicPresentation Topic.Music
Presentation Topic.Music
 
LinkedIn SlideShare: Knowledge, Well-Presented
LinkedIn SlideShare: Knowledge, Well-PresentedLinkedIn SlideShare: Knowledge, Well-Presented
LinkedIn SlideShare: Knowledge, Well-Presented
 

Similar to A presentation on the topic

FINACIAL ANALYSIS OF INDUS MOTORS
FINACIAL ANALYSIS OF INDUS MOTORSFINACIAL ANALYSIS OF INDUS MOTORS
FINACIAL ANALYSIS OF INDUS MOTORSWaris Khan
 
Financial analysis of Nestle group from 2007 to 2016
Financial analysis of Nestle group from 2007 to 2016Financial analysis of Nestle group from 2007 to 2016
Financial analysis of Nestle group from 2007 to 2016Nisha Tejashwani
 
10 yrs competitive analysis of lg balakrishnan
10 yrs competitive analysis of lg balakrishnan10 yrs competitive analysis of lg balakrishnan
10 yrs competitive analysis of lg balakrishnanKarmveer Singh
 
A study on analysis of financial performance on the basis of financial ratio’...
A study on analysis of financial performance on the basis of financial ratio’...A study on analysis of financial performance on the basis of financial ratio’...
A study on analysis of financial performance on the basis of financial ratio’...Babasab Patil
 
ratio analysis of samsung and htc
ratio analysis of samsung and htcratio analysis of samsung and htc
ratio analysis of samsung and htcsanobersheir
 
Ratio analysis of shoe industry
Ratio analysis of shoe industryRatio analysis of shoe industry
Ratio analysis of shoe industrysanobersheir
 
RATIO ANALYSIS PROJECT PPT OF SHSSKL NIPANI MBA FINANCE
RATIO  ANALYSIS PROJECT PPT OF SHSSKL NIPANI MBA FINANCERATIO  ANALYSIS PROJECT PPT OF SHSSKL NIPANI MBA FINANCE
RATIO ANALYSIS PROJECT PPT OF SHSSKL NIPANI MBA FINANCEBabasab Patil
 
KCB Bank Presentation by Starehe - Valuraha Investment Club
KCB Bank Presentation by Starehe - Valuraha Investment ClubKCB Bank Presentation by Starehe - Valuraha Investment Club
KCB Bank Presentation by Starehe - Valuraha Investment ClubWangechi Mwangi
 
Financial analysis of DLF
Financial analysis of DLFFinancial analysis of DLF
Financial analysis of DLFDivyaKapoor57
 
ATA INVEST- TR BANKS- 1Q15 Earnings Preview
ATA INVEST- TR BANKS- 1Q15 Earnings PreviewATA INVEST- TR BANKS- 1Q15 Earnings Preview
ATA INVEST- TR BANKS- 1Q15 Earnings PreviewDerya Guzel
 
Presentation Accounting.pptx
Presentation Accounting.pptxPresentation Accounting.pptx
Presentation Accounting.pptxConsentQUEEN
 
Financial Analysis 3.pptx
Financial Analysis 3.pptxFinancial Analysis 3.pptx
Financial Analysis 3.pptxNadeemSRimawi
 
Working capital management,and financial analysis of Tamil Nadu Newsprint and...
Working capital management,and financial analysis of Tamil Nadu Newsprint and...Working capital management,and financial analysis of Tamil Nadu Newsprint and...
Working capital management,and financial analysis of Tamil Nadu Newsprint and...Chitta Manoj Venkata Saikumar
 

Similar to A presentation on the topic (20)

Ioc
IocIoc
Ioc
 
Chapter 4
Chapter 4Chapter 4
Chapter 4
 
RJ
RJRJ
RJ
 
FINACIAL ANALYSIS OF INDUS MOTORS
FINACIAL ANALYSIS OF INDUS MOTORSFINACIAL ANALYSIS OF INDUS MOTORS
FINACIAL ANALYSIS OF INDUS MOTORS
 
Financial analysis of Nestle group from 2007 to 2016
Financial analysis of Nestle group from 2007 to 2016Financial analysis of Nestle group from 2007 to 2016
Financial analysis of Nestle group from 2007 to 2016
 
10 yrs competitive analysis of lg balakrishnan
10 yrs competitive analysis of lg balakrishnan10 yrs competitive analysis of lg balakrishnan
10 yrs competitive analysis of lg balakrishnan
 
engro foods
engro foodsengro foods
engro foods
 
Aftab auto
Aftab autoAftab auto
Aftab auto
 
Results Tracker 24.07.2012,
Results Tracker 24.07.2012,Results Tracker 24.07.2012,
Results Tracker 24.07.2012,
 
A study on analysis of financial performance on the basis of financial ratio’...
A study on analysis of financial performance on the basis of financial ratio’...A study on analysis of financial performance on the basis of financial ratio’...
A study on analysis of financial performance on the basis of financial ratio’...
 
ratio analysis of samsung and htc
ratio analysis of samsung and htcratio analysis of samsung and htc
ratio analysis of samsung and htc
 
Ratio analysis of shoe industry
Ratio analysis of shoe industryRatio analysis of shoe industry
Ratio analysis of shoe industry
 
RATIO ANALYSIS PROJECT PPT OF SHSSKL NIPANI MBA FINANCE
RATIO  ANALYSIS PROJECT PPT OF SHSSKL NIPANI MBA FINANCERATIO  ANALYSIS PROJECT PPT OF SHSSKL NIPANI MBA FINANCE
RATIO ANALYSIS PROJECT PPT OF SHSSKL NIPANI MBA FINANCE
 
KCB Bank Presentation by Starehe - Valuraha Investment Club
KCB Bank Presentation by Starehe - Valuraha Investment ClubKCB Bank Presentation by Starehe - Valuraha Investment Club
KCB Bank Presentation by Starehe - Valuraha Investment Club
 
Financial analysis of DLF
Financial analysis of DLFFinancial analysis of DLF
Financial analysis of DLF
 
ATA INVEST- TR BANKS- 1Q15 Earnings Preview
ATA INVEST- TR BANKS- 1Q15 Earnings PreviewATA INVEST- TR BANKS- 1Q15 Earnings Preview
ATA INVEST- TR BANKS- 1Q15 Earnings Preview
 
Presentation Accounting.pptx
Presentation Accounting.pptxPresentation Accounting.pptx
Presentation Accounting.pptx
 
Financial Analysis 3.pptx
Financial Analysis 3.pptxFinancial Analysis 3.pptx
Financial Analysis 3.pptx
 
Working capital management,and financial analysis of Tamil Nadu Newsprint and...
Working capital management,and financial analysis of Tamil Nadu Newsprint and...Working capital management,and financial analysis of Tamil Nadu Newsprint and...
Working capital management,and financial analysis of Tamil Nadu Newsprint and...
 
Hp company
Hp companyHp company
Hp company
 

More from Sourabh Modgil

More from Sourabh Modgil (8)

Tax deductable at source
Tax deductable at sourceTax deductable at source
Tax deductable at source
 
Sampling design
Sampling designSampling design
Sampling design
 
Tradeunion
TradeunionTradeunion
Tradeunion
 
Data collection methods
Data collection methodsData collection methods
Data collection methods
 
Journey ordinary to marvelous
Journey ordinary to marvelousJourney ordinary to marvelous
Journey ordinary to marvelous
 
Qatar
QatarQatar
Qatar
 
By sourabh modgil
By sourabh modgilBy sourabh modgil
By sourabh modgil
 
Fundamental duties
Fundamental dutiesFundamental duties
Fundamental duties
 

A presentation on the topic

  • 1. A PRESENTATION ON THE TOPIC : RATIO ANALYSIS FOR THE TRAINING UNDER GONE AT: PRESENTED BY: SOURABH MODGIL 5TH SEMESTER ROLL NO. - 44
  • 2. COMPANY PROFILE  Liberty group started operation in 1954 and comprises of five firms namely:  Liberty footwear company  Liberty enterprise  Liberty leathers  Liberty group marketing division  Liberty shoes limitted
  • 3. The company was started by three dreamers in a small town- MR.DP GUPTA,MR.PD GUPTA AND MR.R BANSAL.  Liberty Shoes have been fashioning footwear, for well over 50 years now Currently with an annual turnover exceeding INR.600 crore (U.S. $150 million), we figure amongst the top 5 manufacturers of leather footwear of the world producing more than 50,000 pairs a day.  Liberty has quality-seeking customers in more than 25 countries.
  • 5. OBJECTIVES OF THE STUDY:  The basic objective of studying the ratios of the company is to know the financial position of the company.  To study the profit of the business and net sales of the business and to know stock reserves for the sales of the business.  To spot out the strength and weakness of the business.
  • 6.
  • 7. CURRENT ASSETS = CURRENT ASSETS/CURRENT LIABILITIES YEAR CURRENT ASSETS CURRENT RATIO LIABILITIES 2005-06 938896527 653083419 1.4376 2006-07 1216862601 733828909 1.6582 2007-08 2007940647 673965547 2.98 2008-09 2544279053 1201432362 2.1177 2009-10 3015416632 1147817477 2.6271
  • 8. current ratio 3.5 3 2.5 2 current ratio 1.5 1 0.5 0 2005-06 2006-07 2007-08 2008-09 2009-10 INTERPRETATION: IT INDICATES THAT THE LIQUIDITY POSITION OF THE COMPANY IS NOT SOUND IN THE YEAR 2005-06 AS IT IS LESS THEN 2:1.SIMILARLY IS IN 2006-07 .BUT IN 2007-08,08-09 AND IN 2009-2010 THE CURRENT RATIO EXCEEDS. THIS IS A POSITIVE SIGN.
  • 9. QUICK/LIQUID RATIO = CASH +MARKETABLE SECURITIES+ ACCOUNTS RECEIVABLE/ CURRENT LIABLITIES YEAR LIQUID ASSETS CURRENT RATIO LIABILITIES 2005-06 174140837 653083419 0.2666 2006-07 164562907 733828909 0.2242 2007-08 112633117 637965547 0.1671 2008-09 196033579 1201432362 0.1632 2009-10 273411559 1147817477 0.2382
  • 10. Quick/Liquid ratio 0.3 0.25 0.2 0.15 Quick/Liquid ratio 0.1 0.05 0 2005-06 2006-07 2007-08 2008-09 2009-10 INTERPRETATION: AS AN IDEAL QUICK RATIO SHOULD BE1:1, IT INDICATES THAT THE COMPANY ABILITY TO USE ITS NEAR CASH OR QUICK ASSETS TO RETIRE ITS CL IS NOT SOUND IN ALL THOSE YEARS.
  • 11. DEBT EQUITY RATIO = TOTAL LIABILITIES/SHAREHOLDERS EQUITY YEAR TOTAL SHARHOLDERS’ RATIO LIABILITIES S EQUITY 2005-06 4182856914 2148508410 2.0561 2006-07 4465142153 1942541010 2.2986 2007-08 5755393303 2153921231 2.6721 2008-09 7705393303 1984602576 3.8825 2009-10 9236673519 1878040034 4.9183
  • 12. Debt-equity ratio 6 5 4 3 Debt-equity ratio 2 1 0 2005-06 2006-07 2007-08 2008-09 2009-10 INTERPRETATION: IF THE DEBT EQUITY RATIO IS MORE THAN 1,THIS MEANS THE DEBT IS MAINLY USED FINANCING ITS OPERATIONS. IT INDICATES THAT THE BUSINESS HAS LOT OF RISK BECAUSE IT MUST MEET PRINCIPAL AND INTEREST ON ITS OBLIGATIONS.
  • 13. PROPRITORY RATIO = SHAREHOLDERS FUND/TOTAL ASSETS YEAR SHAREHOLDERS TOTAL ASSETS RATIO ’S FUND 2005-06 1730508410 4182856914 0.4137 2006-07 1942541010 4465142153 0.4350 2007-08 2153921231 5755393303 0.3742 2008-09 1948602576 7705316033 0.2528 2009-10 1878040034 9236673519 0.2033
  • 14. Proprietary ratio 0.5 0.45 0.4 0.35 0.3 0.25 Proprietary ratio 0.2 0.15 0.1 0.05 0 2005-06 2006-07 2007-08 2008-09 2009-10 INTERPRETATION: THE RATIO CAN BE INTERPRETED AS GOOD IF IT IS HIGH BECAUSE A HIGHER PROPRIETARY RATIO WOULD IMPLY THAT COMPANY HAS ENOUGH CAPITAL TO REPAY ITS CREDITORS, WHENEVER ANY SUCH DEMAND IS MADE BY THE CREDITORS.
  • 15. FIXED ASSETS TURNOVER RATIO = NET SALES/FIXED ASSETS YAER SALES FIXED ASSETS RATIO 2005-06 3662420296 2932295556 1.2489 2006-07 4182472441 3049535389 1.3715 2007-08 5012789202 3569472285 1.4043 2008-09 8026752955 4971279443 1.6146 2009-10 10466193853 5864295515 1.7846
  • 16. Fixed assets turnover ratio 2 1.8 1.6 1.4 1.2 Fixed assets turnover 1 ratio 0.8 0.6 0.4 0.2 0 2005-06 2006-07 2007-08 2008-09 2009-10 INTERPRETATION: HIGHER THE FIXED ASSETS TURNOVER RATIO, THE BETTER IT IS FOR THE COMPANY BECAUSE A HIGH RATIO INDICATES THE BUSINESS HAS LESS MONEY TIED UP IN THE FIXED ASSETS FOR EACH UNIT OF CURRENCY OF SALES REVENUE.
  • 17. INVENTORY TURNOVER RATIO =NET SALES/INVENTORY YEAR SALES INVENTORY RATIO 2005-06 3662420296 279046650 13.1247 2006-07 4182472441 366045505 11.4261 2007-08 5012789202 557230198 8.9959 2008-09 8026752955 947127445 8.4748 2009-10 10466193853 1219791118 8.5803
  • 18. inventory turnover ratio 14 12 10 inventory turnover ratio 8 6 4 2 0 2005-06 2006-07 2007-08 2008-09 2009-10 INTERPRETATION: A HIGH INVENTORY TURNOVER RATIO MEANS THE COMPANY IS EFFICIENTLY MANAGING AND SELLING ITS INVENTORY AND INDICATE BETTER LIQUIDITY, BUT IT CAN ALSO INDICATE A SHORTAGE OR INADEQUATE INVENTORY LEVELS WHICH MAY CAUSE LOSE IN BUSINESS.
  • 19. DEBTORS TURNOVER RATIO = TOTAL SALES / DEBTORS YAER SALES DEBTORS RATIO 2005-06 3662420296 314675202 11.6987 2006-07 4182472441 420749095 9.9405 2007-08 5012789202 1036080367 4.3832 2008-09 8026752955 643062814 12.4832 2009-10 10466193853 833322981 12.5596
  • 20. Debtors turnover ratio 14 12 10 8 Debtors turnover ratio 6 4 2 0 2005-06 2006-07 2007-08 2008-09 2009-10 INTERPRETATION: THE HIGHER THE VALUE OF DEBTORS TURNOVER RATIO ,THE MORE EFFICIENT IS THE MANAGEMENT OF DEBTORS OR MORE LIQUID THE DEBTOR’S ARE. HIGHER TURNOVER SIGNIFIES SPEEDY AND EFFECTIVE COLLECTION.
  • 21. WORKING CAPITAL TURNOVER RATIO= COST OF SALES/NET WORKING CAPITAL YEAR COST OF SALES NET WORKING RATIO CAPITAL 2005-06 3120167111 285813108 10.917 2006-07 3425500099 485813108 7.0916 2007-08 4326627922 1333975100 3.2434 2008-09 7444286989 1342846691 5.5437 2009-10 9424223978 1867599155 5.0461
  • 22. Working capital turnover ratio 12 10 8 Working capital turnover ratio 6 4 2 0 2005-06 2006-07 2007-08 2008-09 2009-10 INTERPRETATION: POSITIVE SIGN SHOWING THE A HIGH RATIO IS COMPANY IS ABLE TO GENRATE SALES FROM AND INDICATES EFFICENT UTILISATION OF WORKING CAPITAL.
  • 23. TOTAL ASSETS TURNOVER RATIO= TOTAL ASSETS/NET SALES YEAR TOTAL ASSETS NET SALES RATIO 2005-06 4182856914 3662420296 1.142 2006-07 4465142153 4182472441 1.068 2007-08 5755393303 5012789202 1.148 2008-09 7705316033 8026752955 0.959 2009-10 9236673519 10466193853 0.882
  • 24. Total assets turnover ratio 1.4 1.2 1 0.8 Total assets turnover ratio 0.6 0.4 0.2 0 2005-06 2006-07 2007-08 2008-09 2009-10 INTERPRETATION: HIGHER THE COMPANY ASSETS TURNOVER RATIO ,THE LOWER THE PROFIT MARGINES SINCE THE COMPANY IS ABLE TO SALE MORE PRODUCTS AT A CHEPER RATE.
  • 25. NET PROFIT RATIO= NET PROFIT/SALES*100 YEAR NET PROFIT SALES % 2005-06 845169350 3662420296 23.076 2006-07 1057201950 4182472441 25.276 2007-08 1266429294 5012789202 25.264 2008-09 1057292022 8026752955 13.172 2009-10 992700974 10466193853 9.485
  • 26. net profit ratio 30 25 20 15 net profit ratio 10 5 0 2005-06 2006-07 2007-08 2008-09 2009-10 INTERPRETATION: IT’S A NOT GOOD SIGN FOR THE COMPANY AS HIGHER THE NET PROFIT RATIO WILL HELP THE FIRM SERVICE IN THE FALL OF INCOME FROM THE SERVICE S,RISE IN COST OF PRODUCTION OR DECLINING DEMAND.
  • 27. GROSS PROFIT RATIO= GROSS PROFIT/NET SALES*100 YEAR GROSS PROFIT SALES % 2005-06 1399308423 3662420296 43.71 2006-07 1513523474 4182472441 41.45 2007-08 1787683614 5012789202 39.93 2008-09 2410931568 8026752955 23.31 2009-10 4333815676 10466193853 41.41
  • 28. Gross profit ratio 50 45 40 35 30 25 Gross profit ratio 20 15 10 5 0 2005-06 2006-07 2007-08 2008-09 2009-10 INTERPRETATION: THE PROFIT MARGIN IS GOOD WHICH IS A POSITIVE SIGN FOR THE COMPANY.
  • 29. RETURN ON CAPITAL EMPLOYED= PROFIT BEFORE TAX AND INTEREST/CAPITAL EMPLOYED*100 YEAR 2005-06 2006-07 2007-08 2008-09 2009-10 ROCE% 5.3 8.9 6.6 5.2 4.5
  • 30. RETURNE ON CAPITAL EMPLOYED 10 9 8 7 6 5 Column1 4 3 2 1 0 2005-06 2006-07 2007-08 2008-09 2009-10 INTERPRITATION : THE LOW PERCENTAGE IS INDICATING THAT THE MANAGEMENT HAS NOT EFFICENTLY USED THE INVESTMENTS MADE BY THE OWNERS AND CREDITORS INTO THE BUSINESS.
  • 31. EARNING PER SHARE= PAT/NO. OF SHARES YEAR 2005-06 2006-07 2007-08 2008-09 2009-10 EPS 17.65 26.48 27.33 27.75 31.02
  • 32. EARNING PER SHARE 35 30 25 20 EARNING PER SHARE 15 10 5 0 2006-07 2007-08 2008-09 2009-10 INTERPRETSTION: THE HIGHER THE RATIO ,THE BETTER IT IS BECAUSE THE VALUE OF THE SHARE WILL INCREASE.
  • 33. RECOMMENDATIONS AND SUGGESTIONS :  Either the company should decrease the prices or the shoes of less price range should also be there so that need of every kind of customers could be fulfilled.  The dealer should regularly visit the retailers and listen to there complaints .  Stock should be verified more frequently to avoid difference between book figures and actual figures .  Funds should be available in smooth and steady flow so that the construction at the site is not affected.