Download to read offline


![BBM – Accounting for Managers
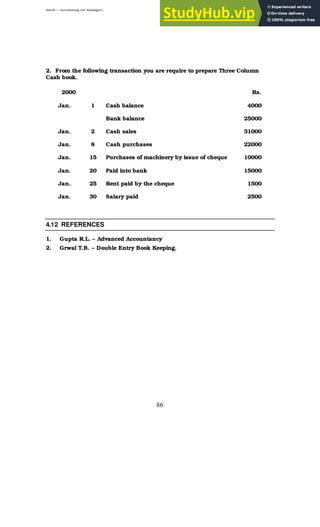
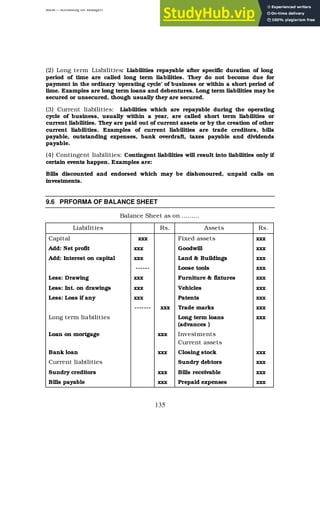
91
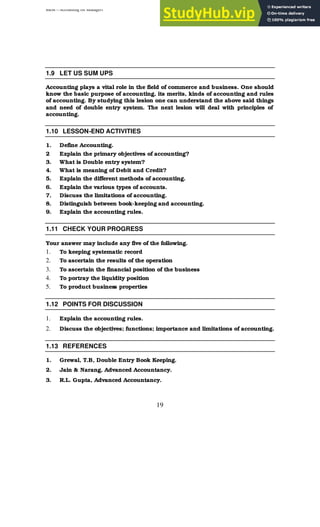
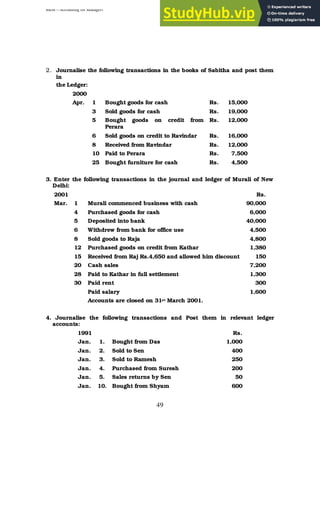
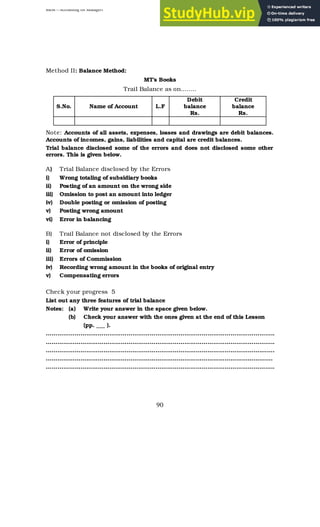
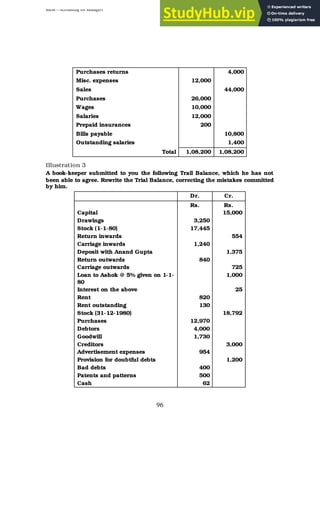
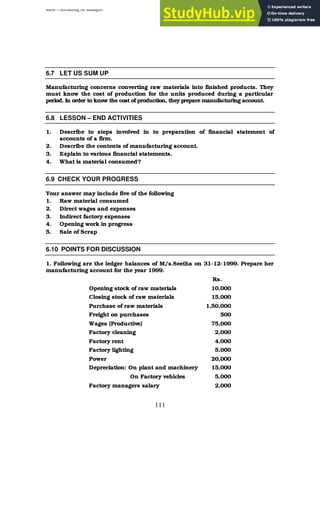
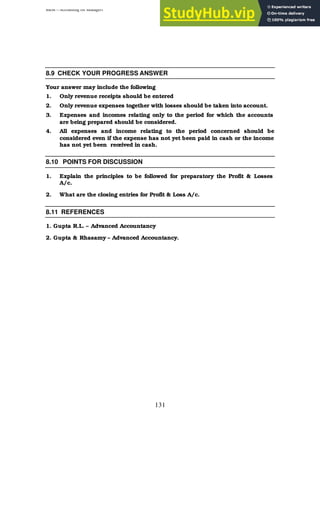
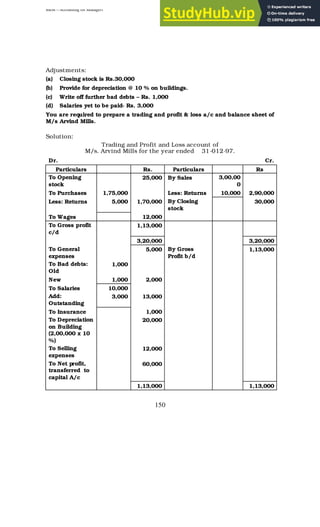
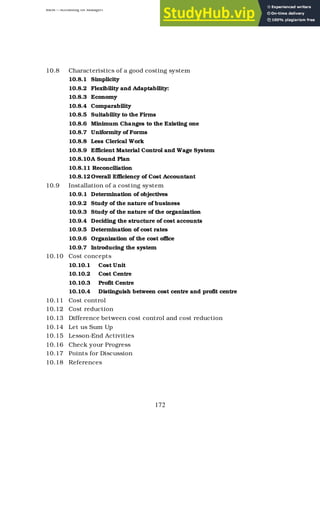
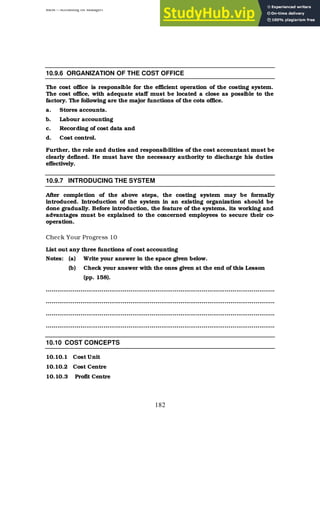
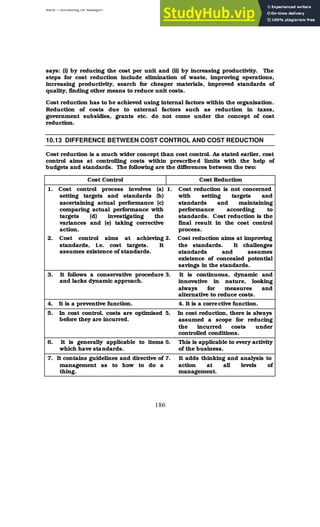
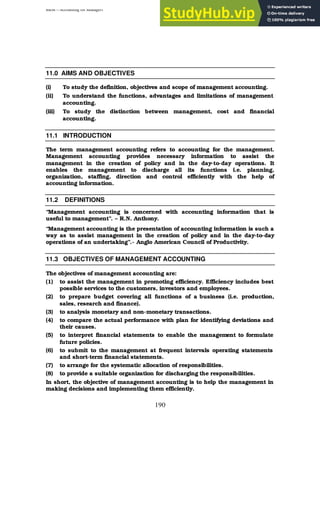
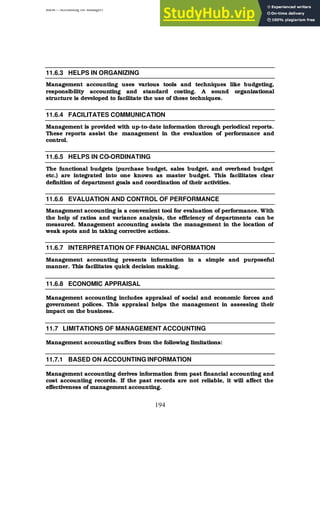
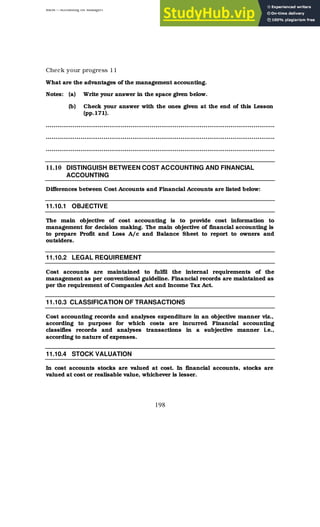
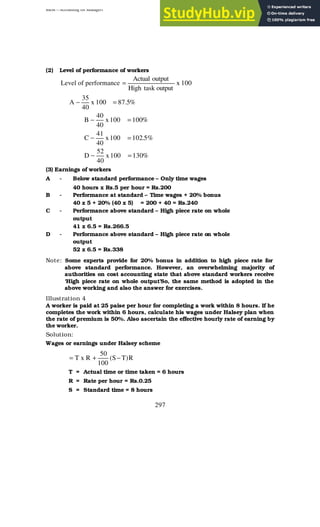
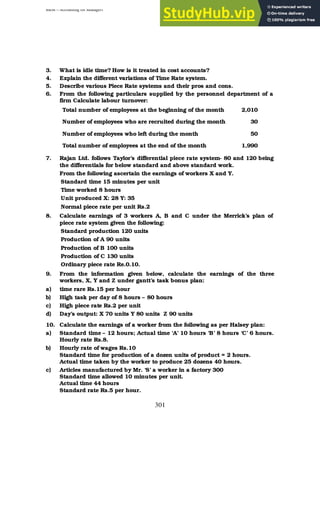
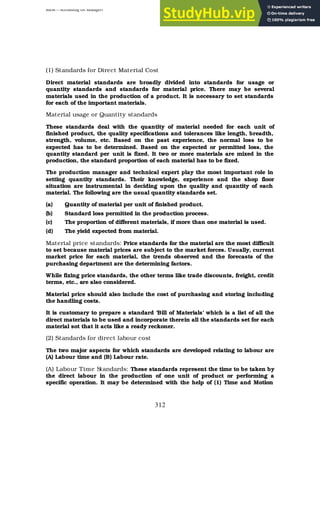
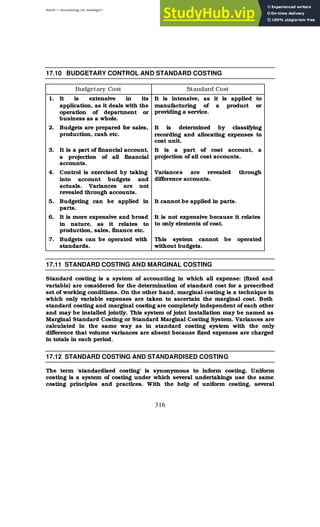
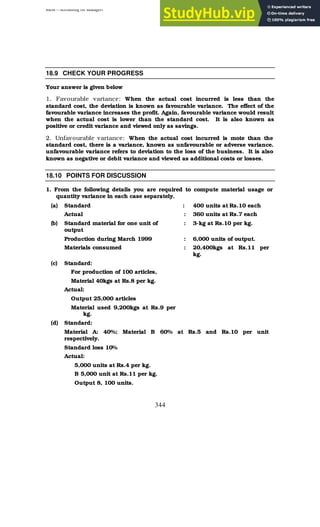
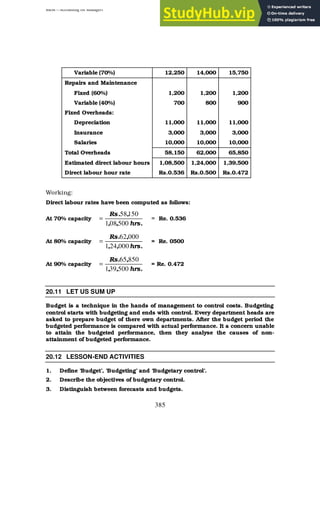
5.7 ILLUSTRATIONS
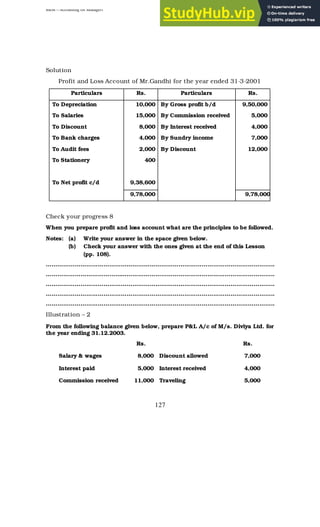
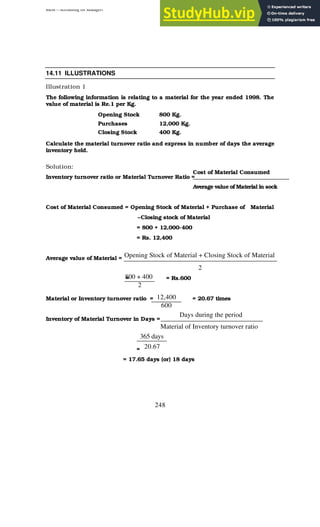
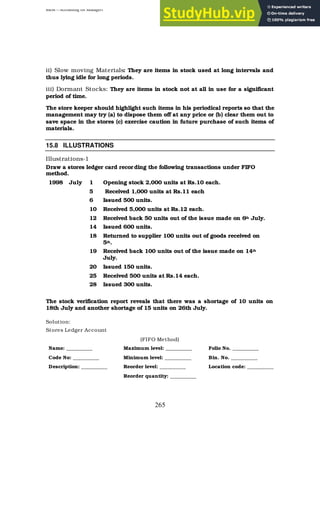
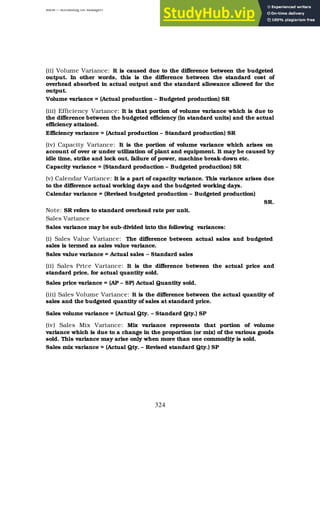
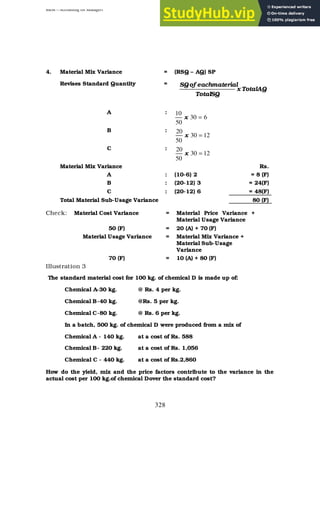
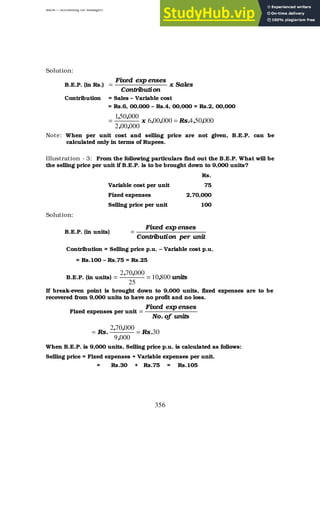
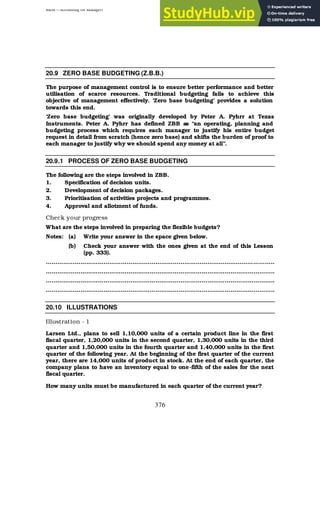
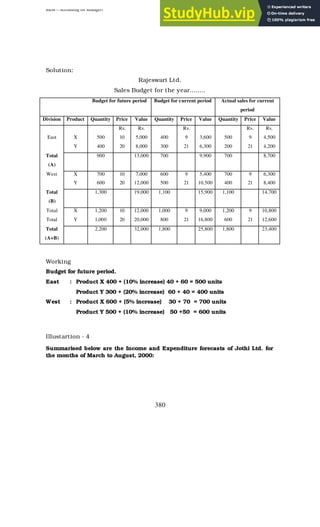
Illustration 1
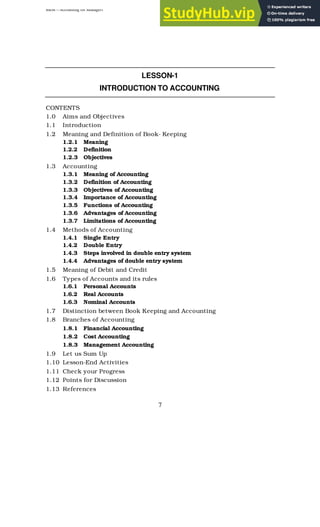
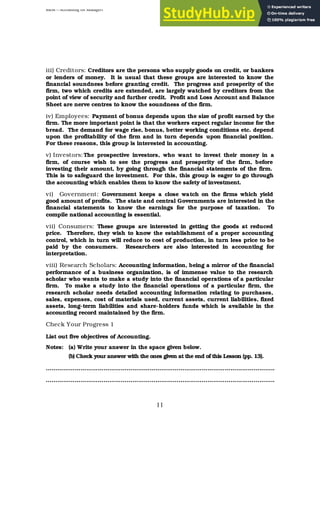
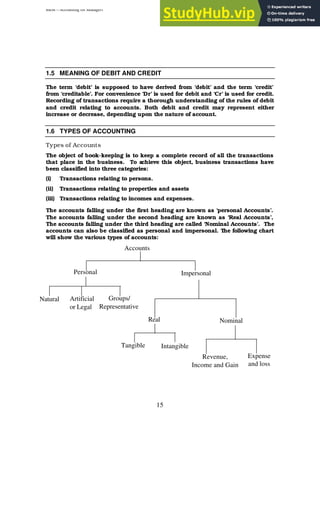
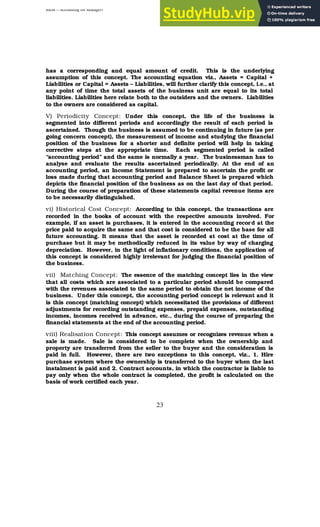
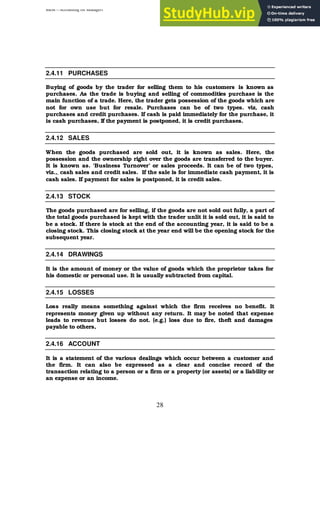
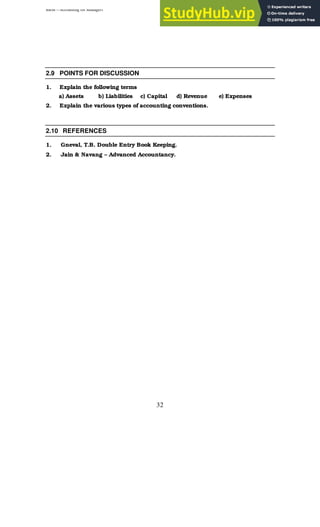
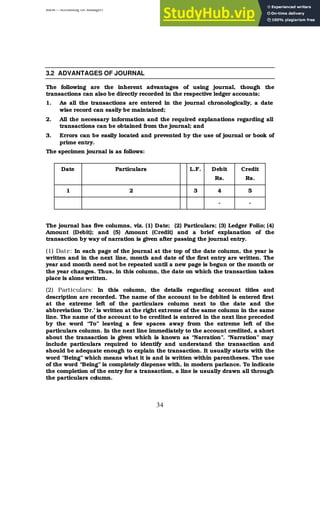
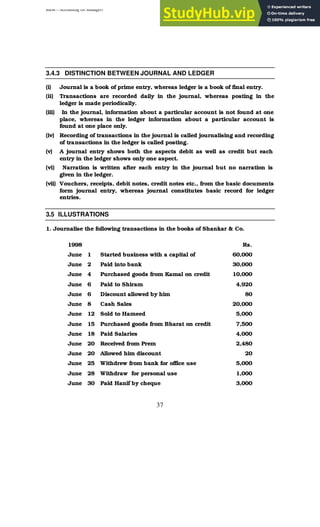
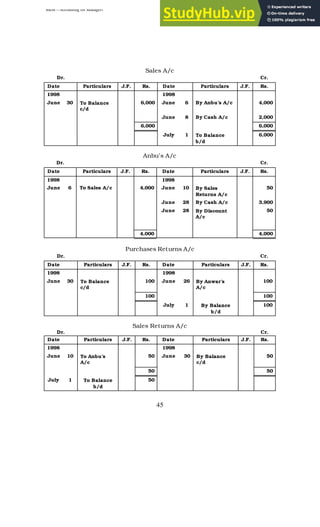
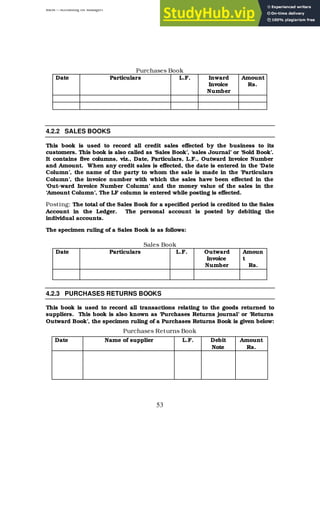
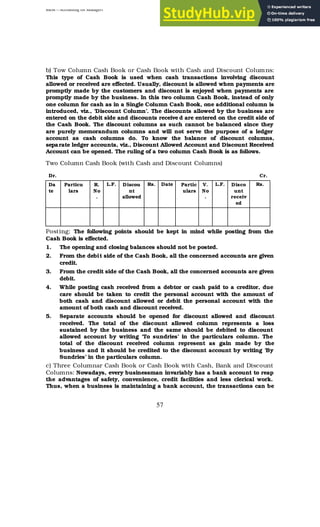
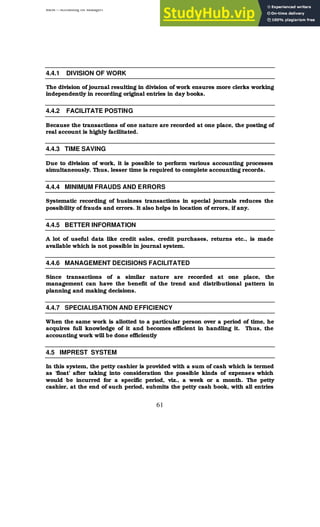
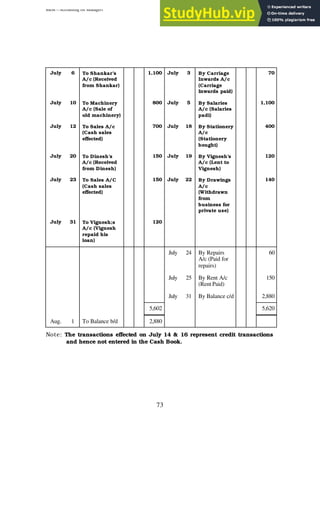
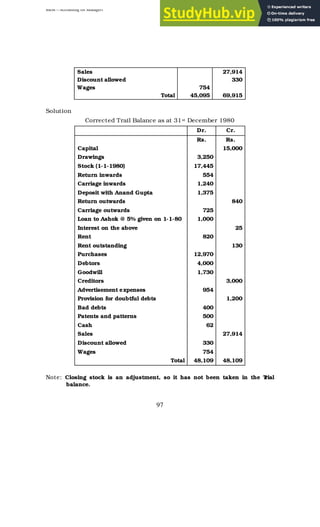
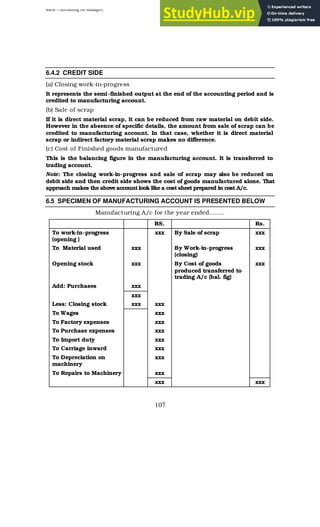
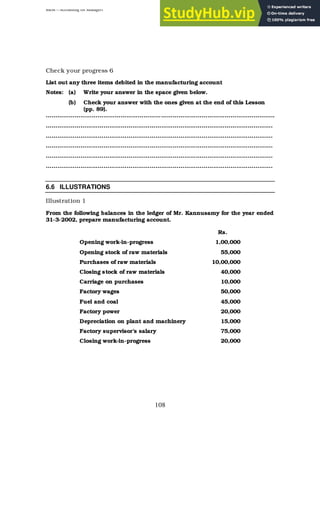
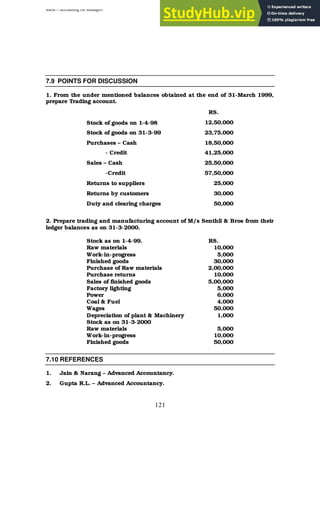
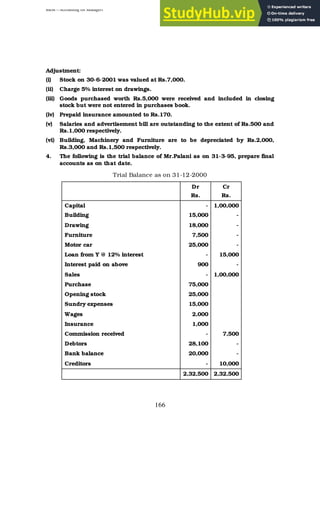
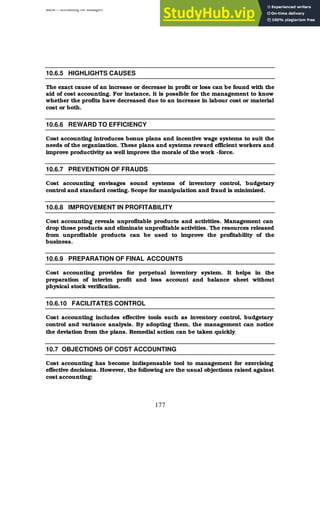
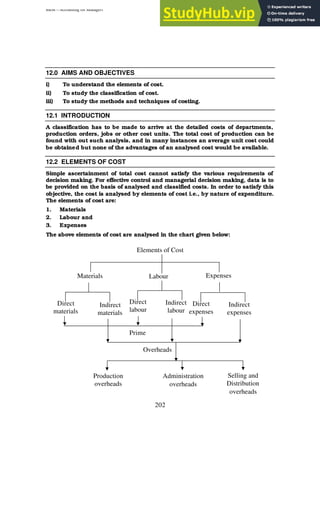
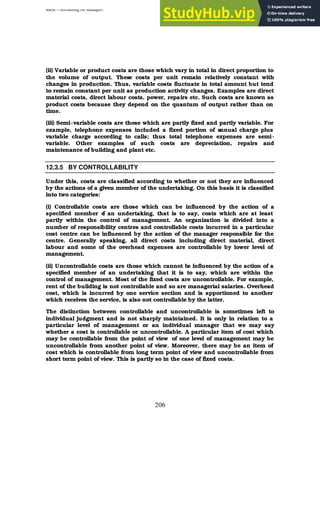
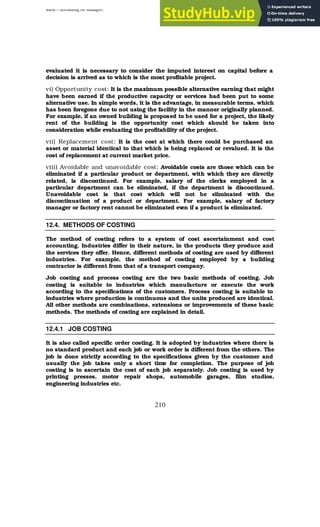
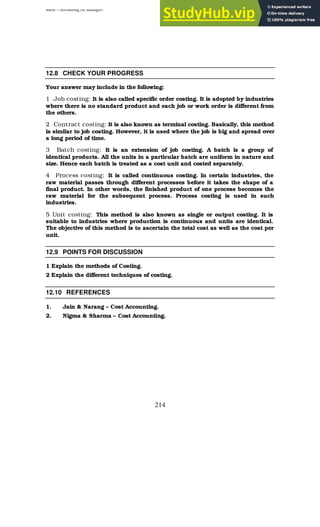
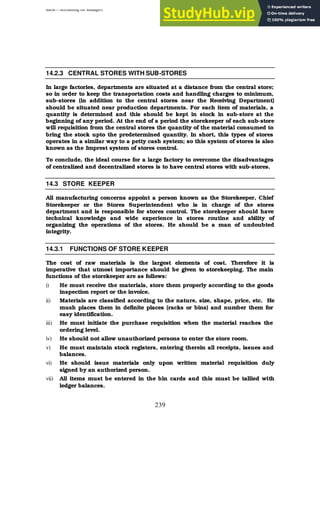
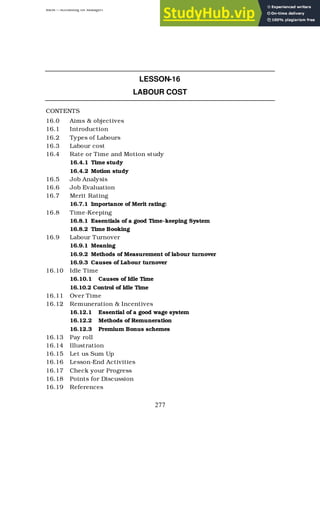
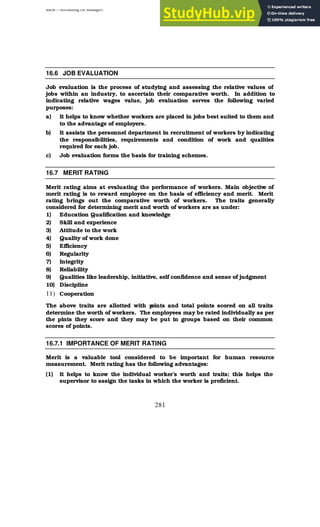
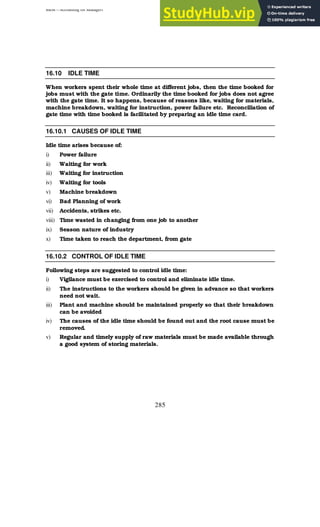
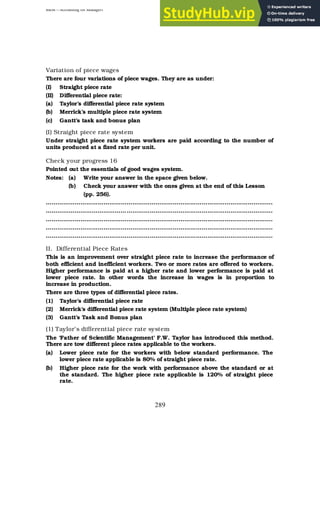
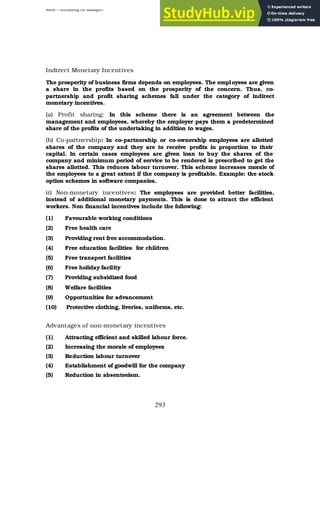
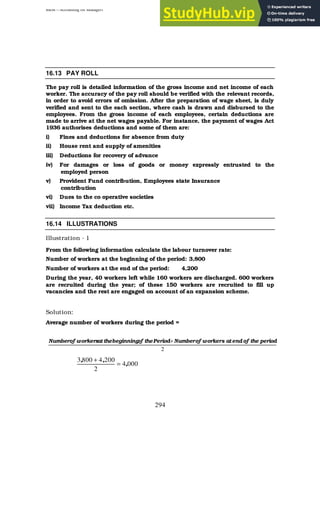
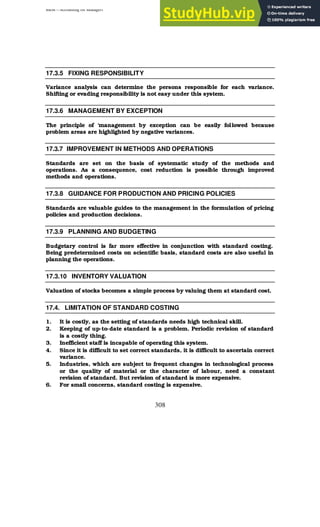
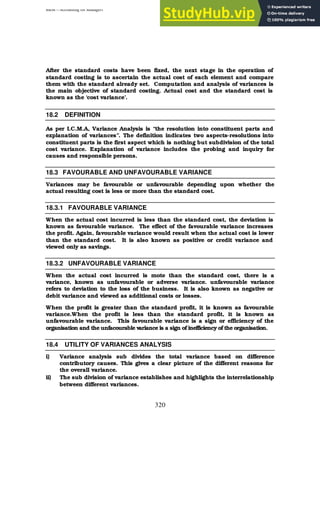
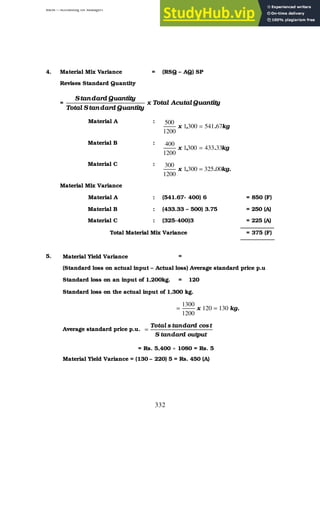
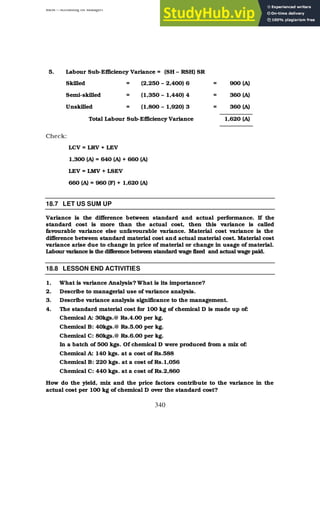
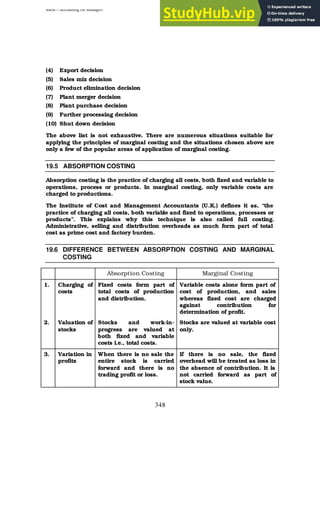
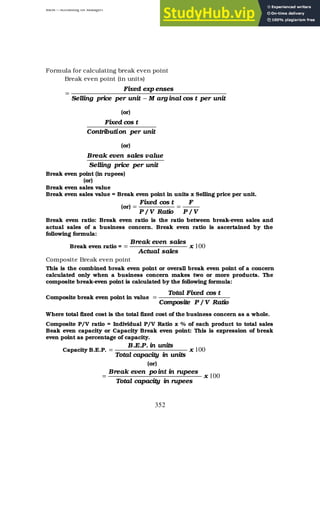
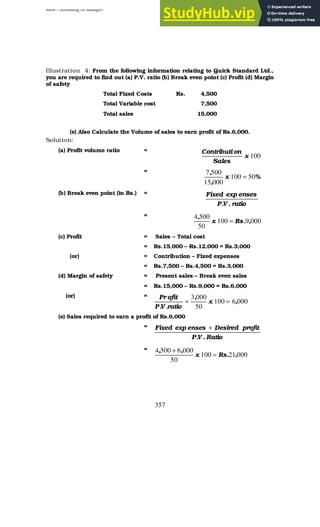
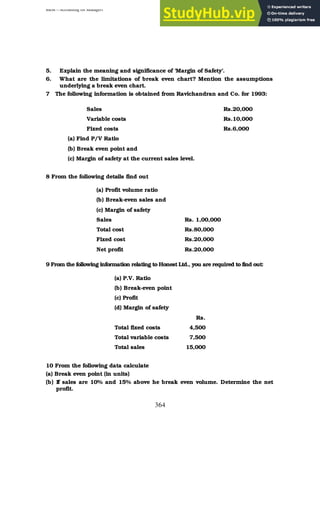
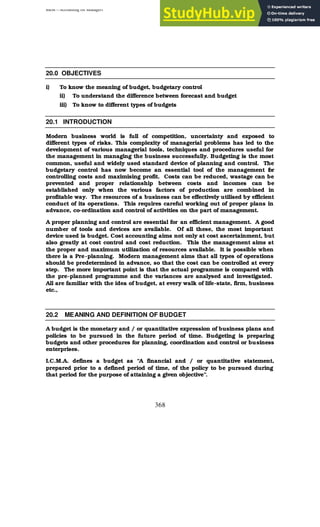
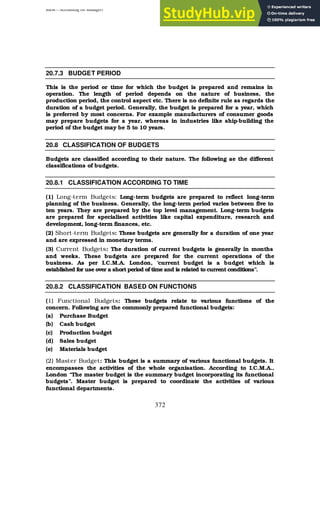
From the following transactions, pass journal entries, prepare ledger accounts
and also prepare Trial Balance under (i) Balance method (ii) Total method.
Rs.
1. Anil started business with 8,000
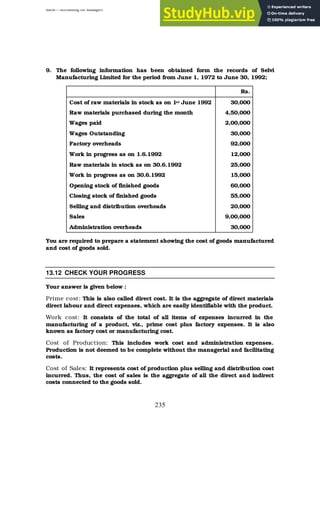
2. Purchased furniture 1,000
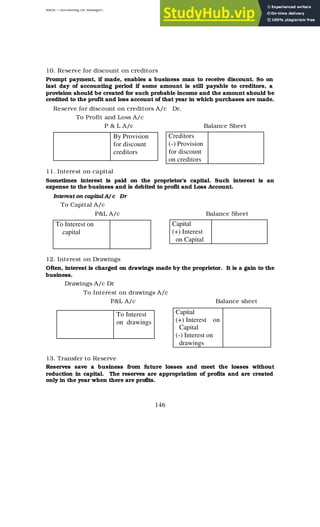
3. Purchased goods 6,000
4. Sold goods 7,000
5. Purchased from Raja 4,000
6. Sold to Somu 5,000
7. Paid to Raja 2,500
8. Received from Somu 3,000
9. Paid rent 200
10. Received commission 100
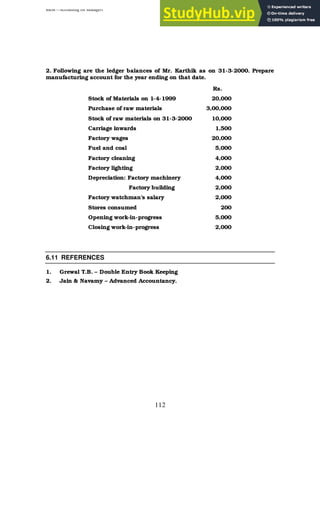
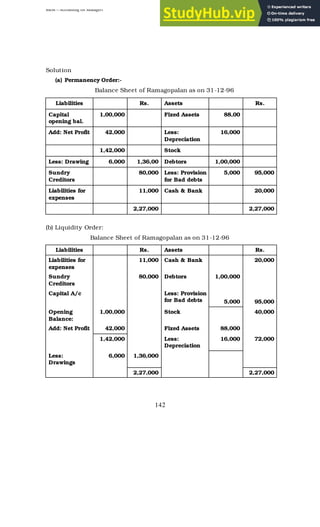
Solution
Journal Entries
Particulars L.F Dr. Cr.
Cash A/c
To Capital A/c
[Started business]
Dr. 8,000 8,000
Furniture A/c
To Cash A/c
[Purchased furniture]
Dr. 1,000
1,000
Purchases A/c
To Cash A/c
[Purchased goods]
Dr. 6,000
6,000
Cash A/c
To Sales A/c
[Sold goods for cash]
Dr. 7,000
7,000
Purchases A/c
To Raja A/c
[Purchased goods]
Dr. 4,000
4,000](https://image.slidesharecdn.com/accountingformanagers-230807160536-33b54065/85/Accounting-for-Managers-pdf-91-320.jpg)
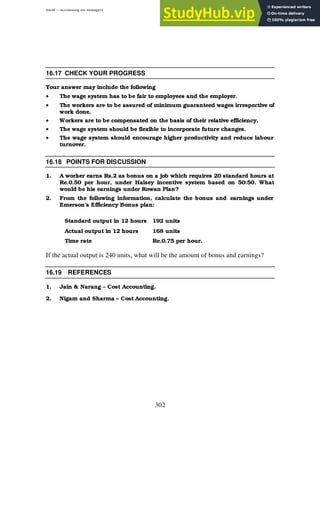
![BBM – Accounting for Managers
92
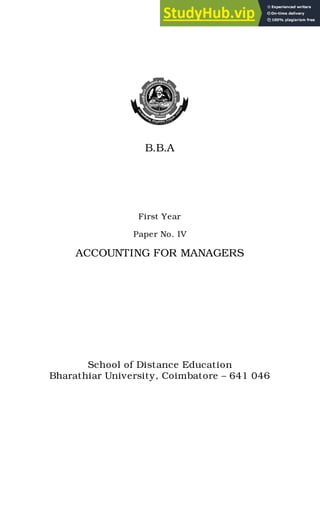
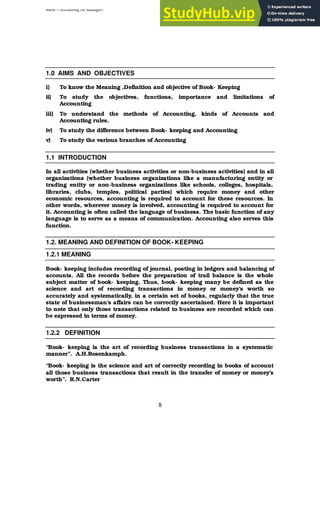
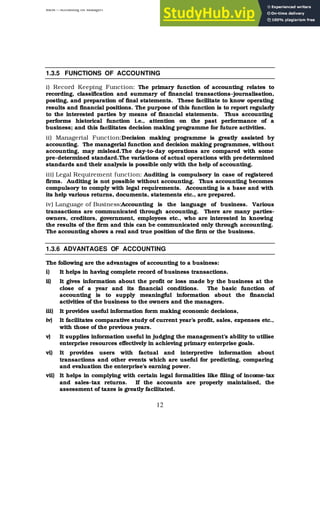
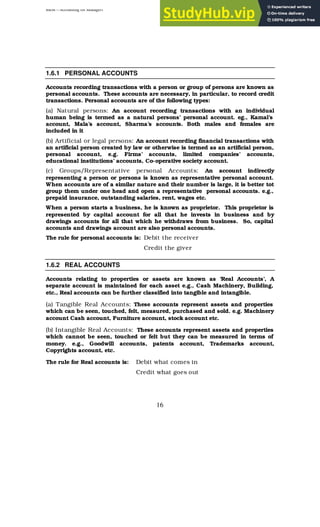
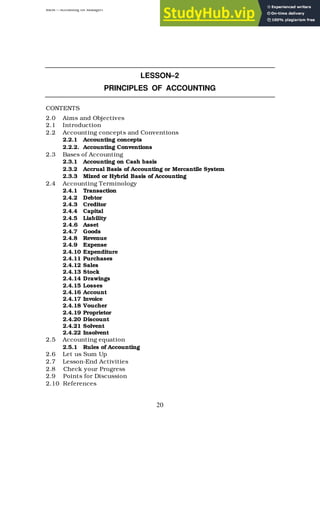
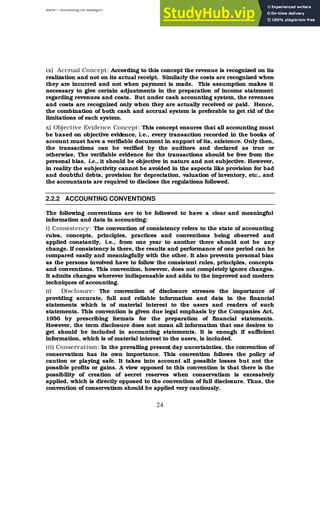
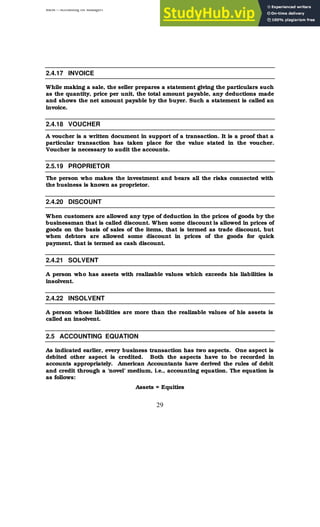
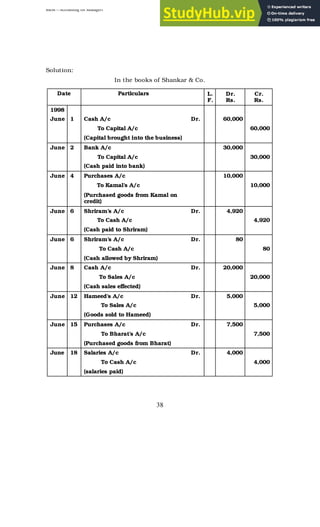
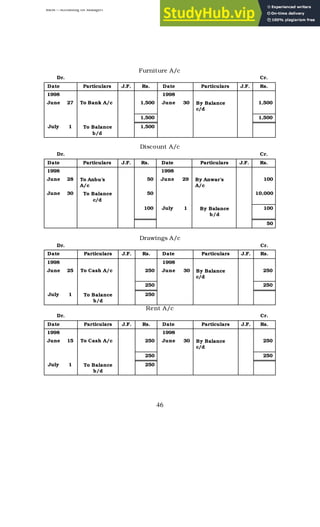
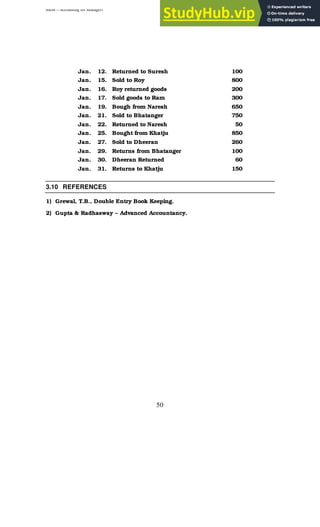
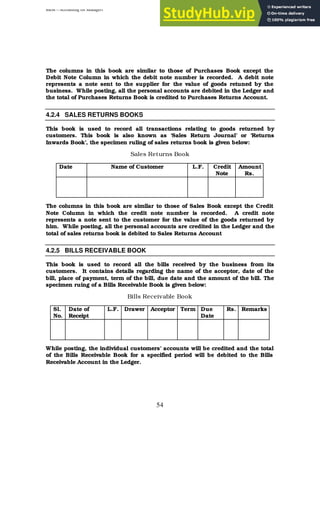
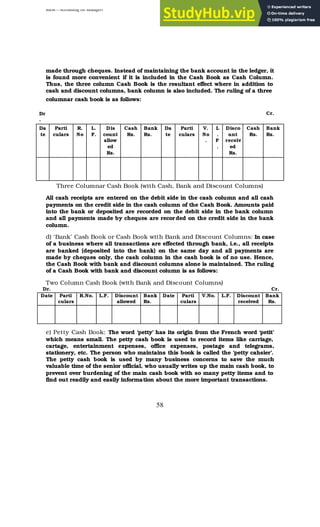
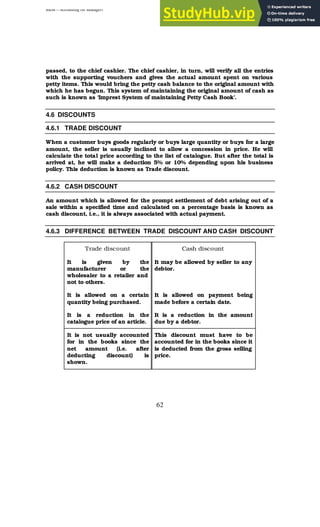
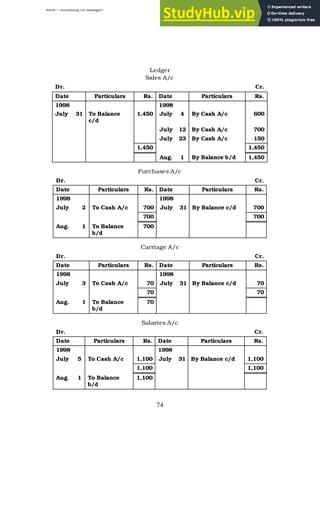
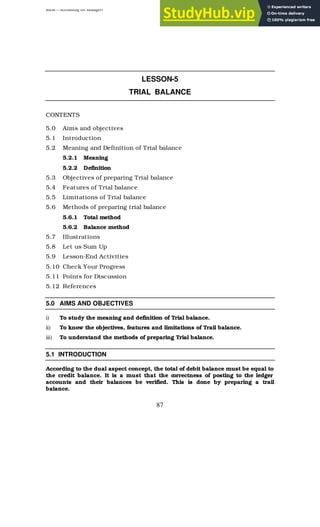
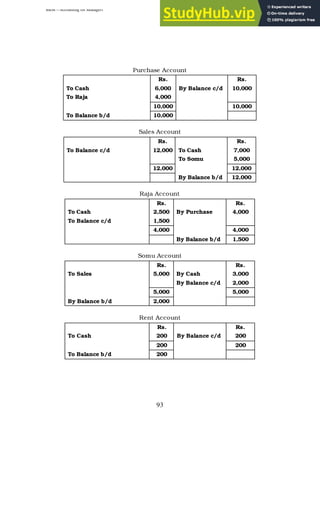
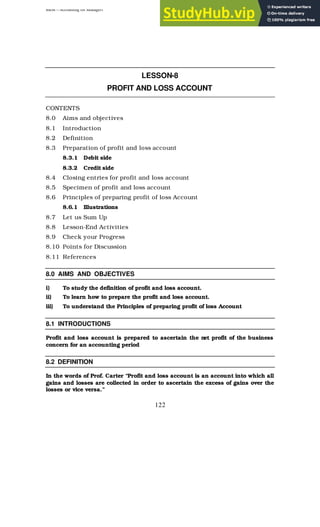
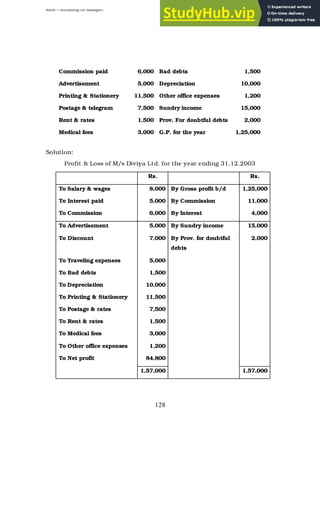
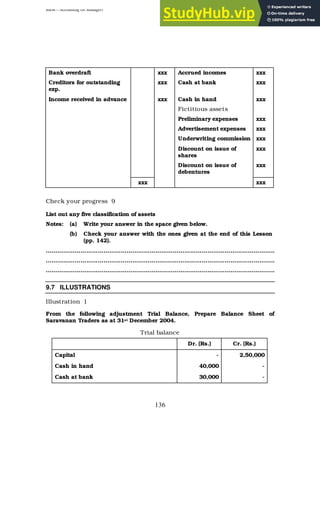
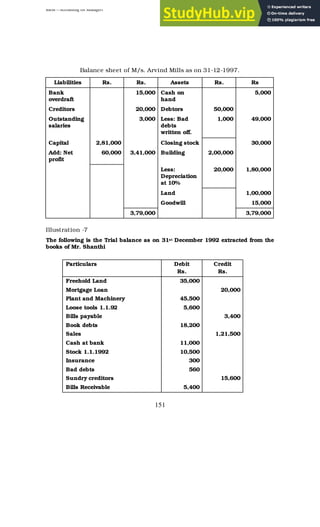
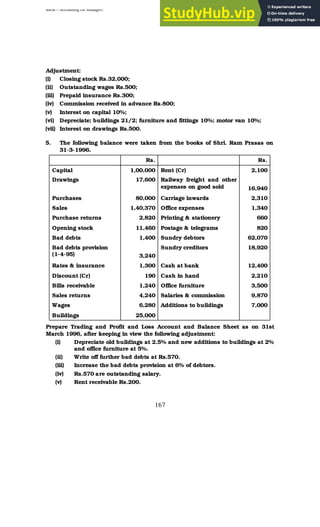
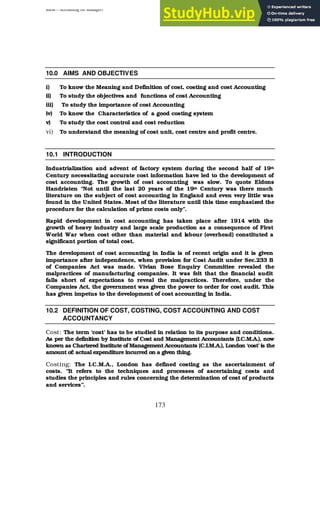
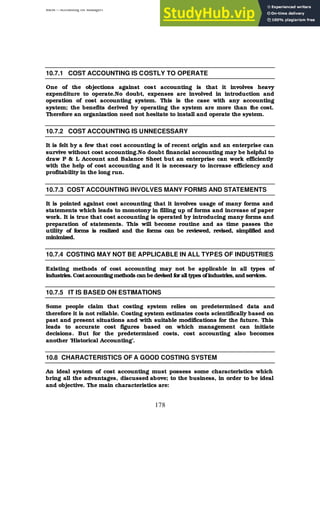
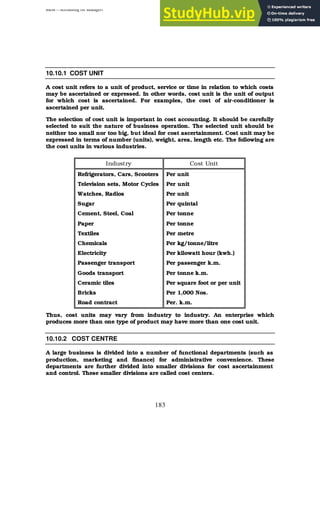
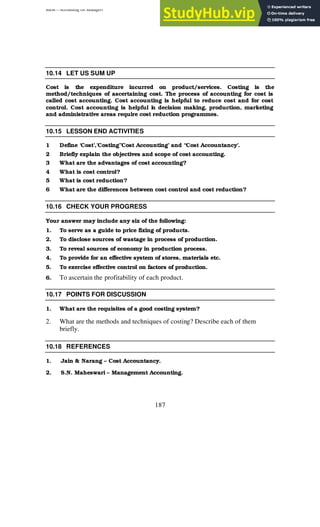
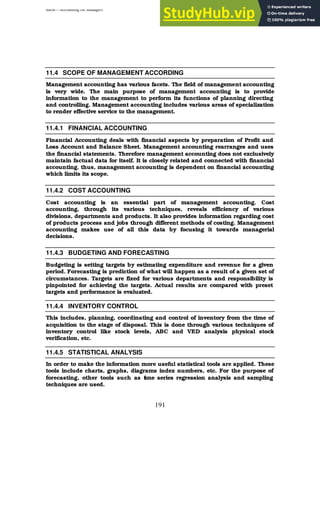
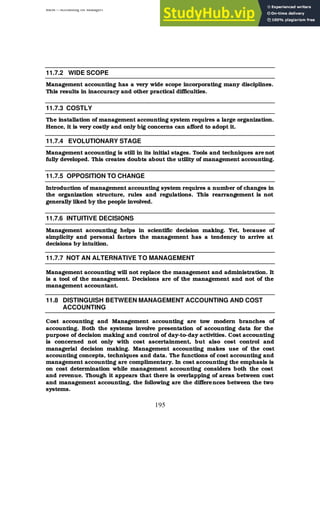
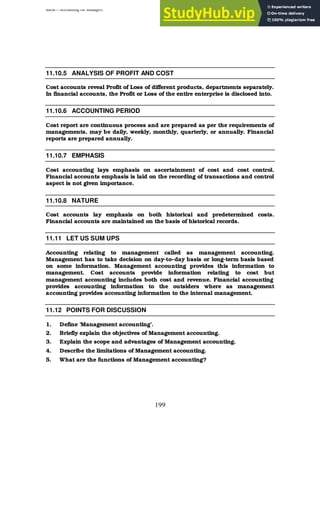
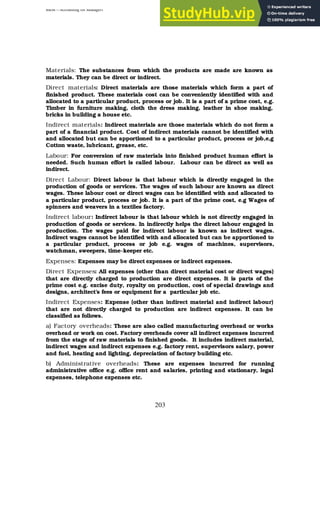
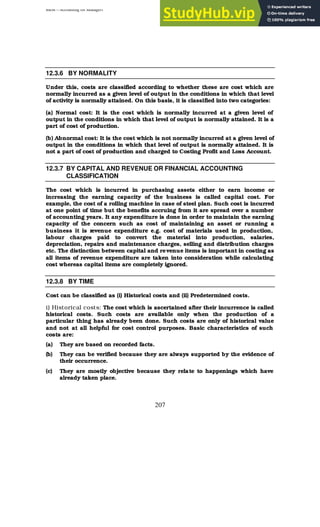
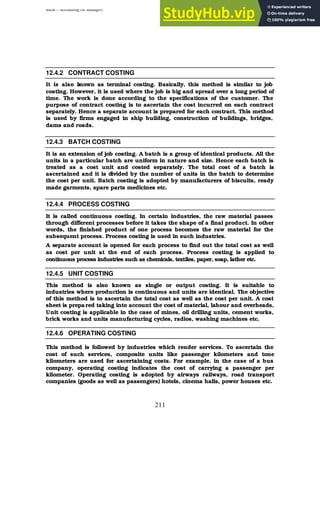
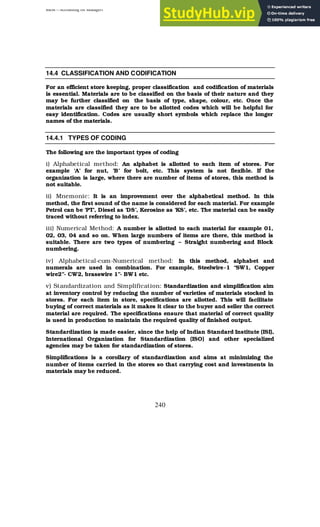
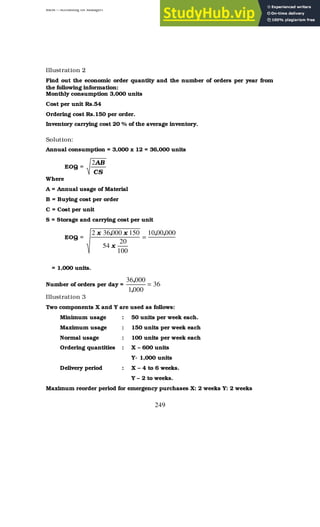
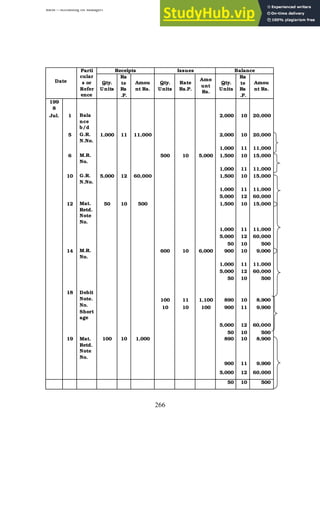
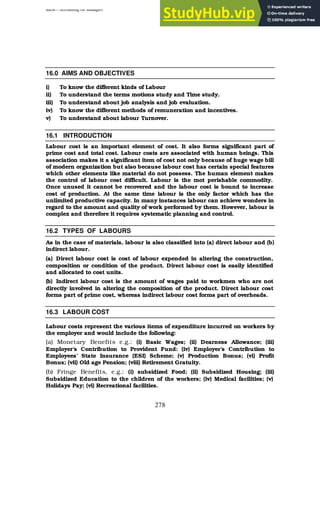
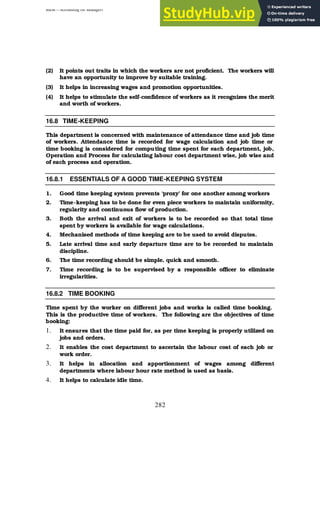
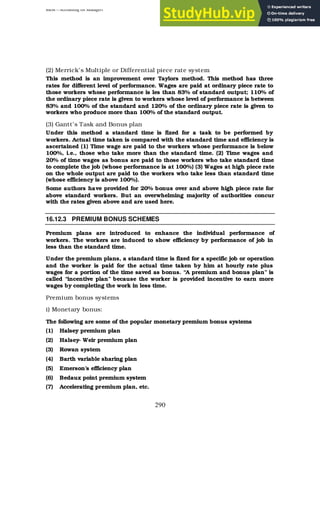
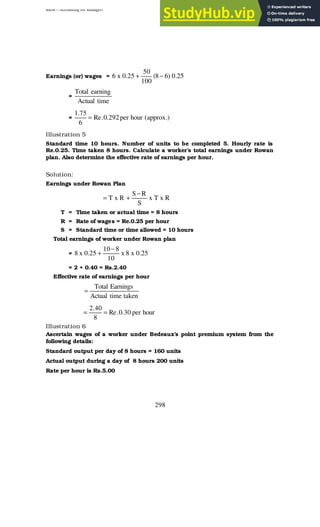
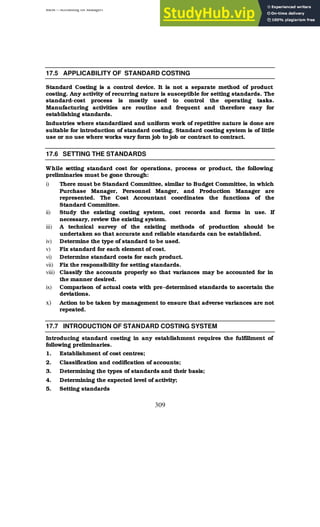
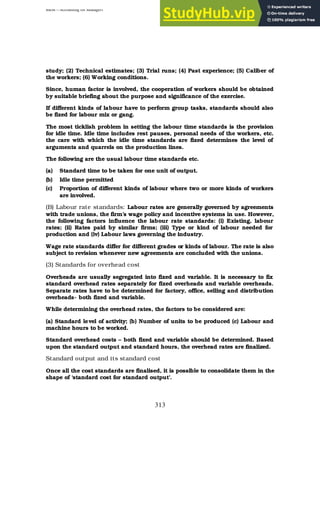
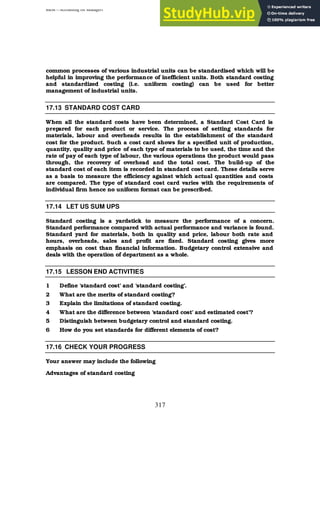
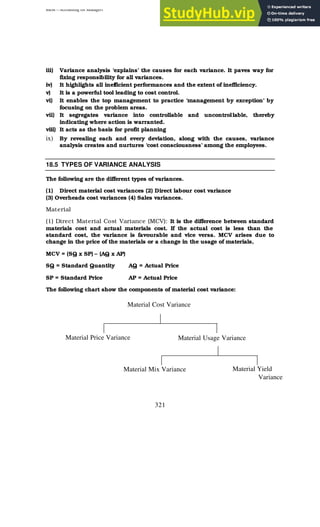
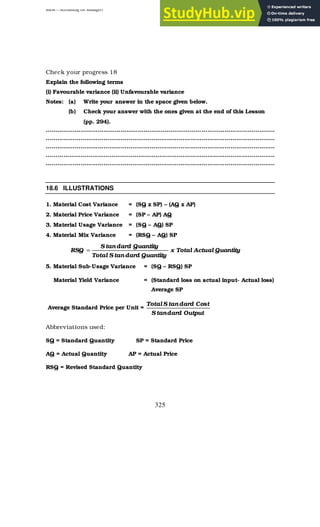
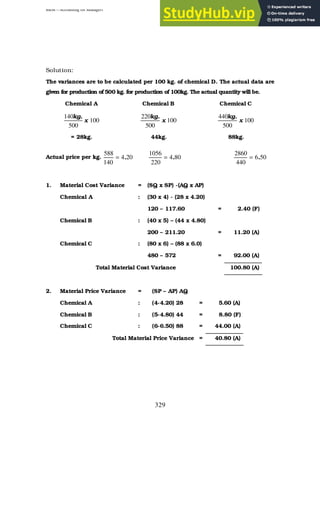
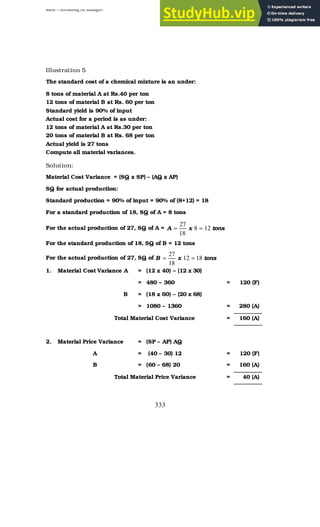
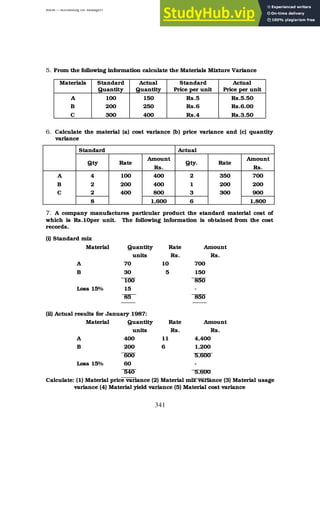
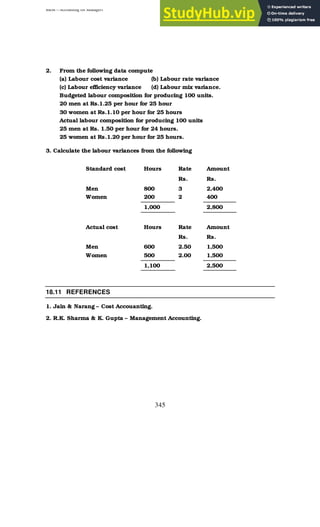
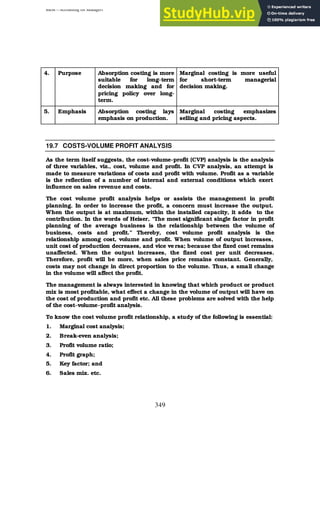
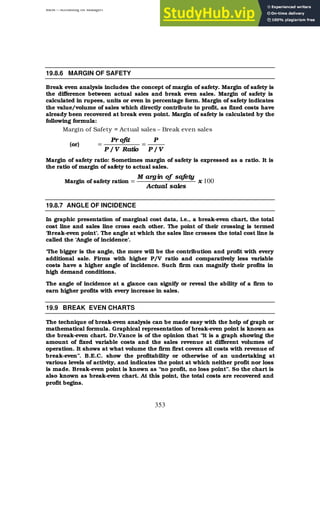
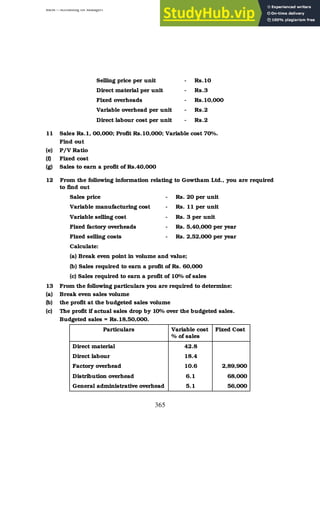
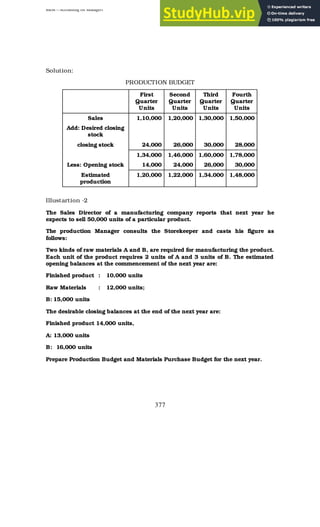
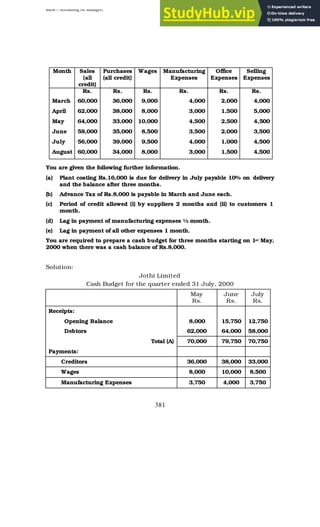
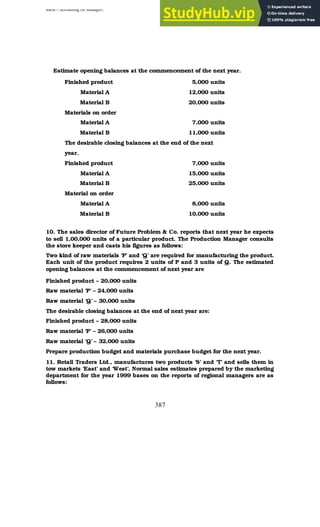
Somu A/c
To Sales A/c
[Sold goods on credit]
Dr. 5,000
5,000
Raja A/c
To Cash A/c
[Paid cash]
Dr. 2,500
2,500
Cash A/c
To Somu A/c
[Received from Somu]
Dr. 3,000
3,000
Rent A/c
To Cash A/c
[Paid rent]
Dr. 200
200
Cash A/c
To Commission received A/c
[Received commission]
Dr. 100
100
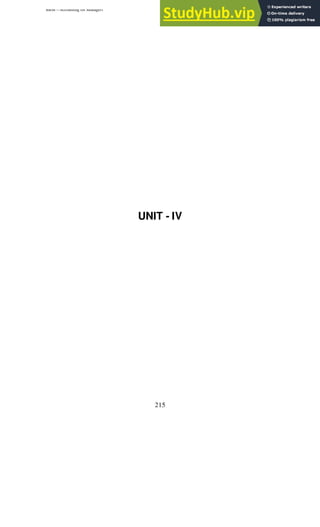
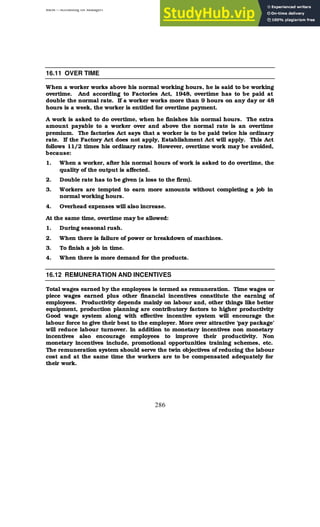
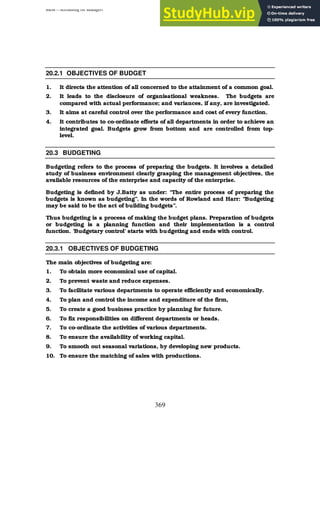
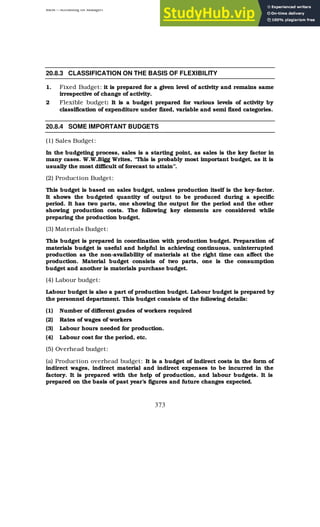
Cash Account
Rs. Rs.
To Capital 8,000 By Furniture 1,000
To Sales 7,000 By Purchases 6,000
To Somu 3,000 By Raja 2,500
To Commission 100 By Rent 200
By Balance c/d 8,400
18,100 18,100
To Balance b/d 8,400
Capital Account
Rs. Rs.
To Balance c/d 8,000 By Cash 8,000
8,000 8,000
By Balance b/d 8,000
Furniture Account
Rs. Rs.
To Cash 1,000 By Balance c/d 1,000
1,000 1,000
By Balance b/d 1,000](https://image.slidesharecdn.com/accountingformanagers-230807160536-33b54065/85/Accounting-for-Managers-pdf-92-320.jpg)


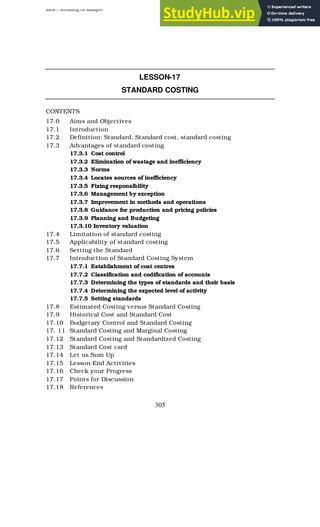
![BBM – Accounting for Managers
115
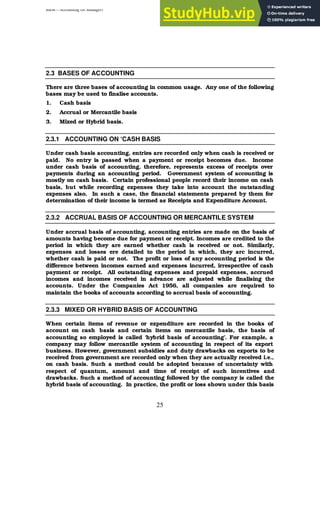
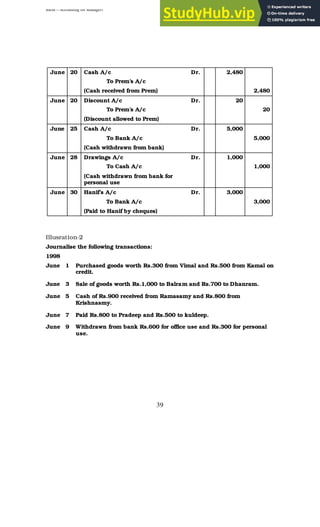
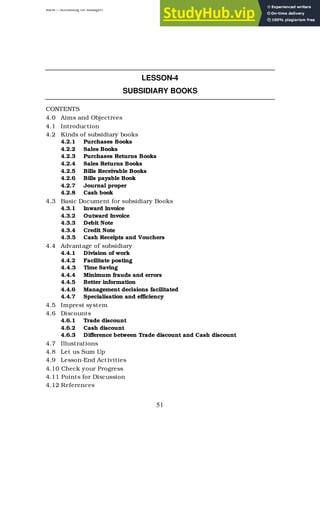
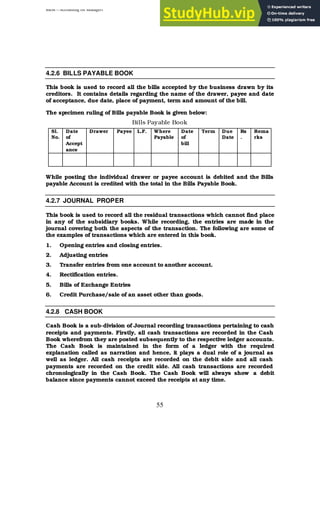
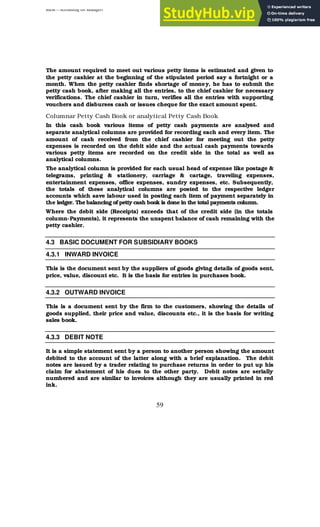
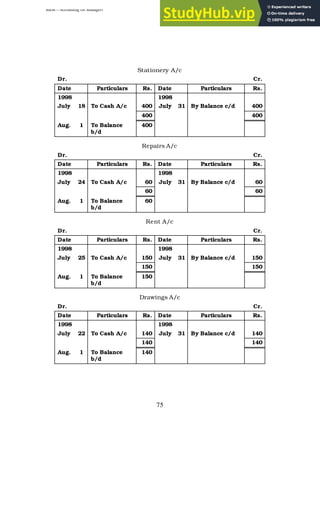
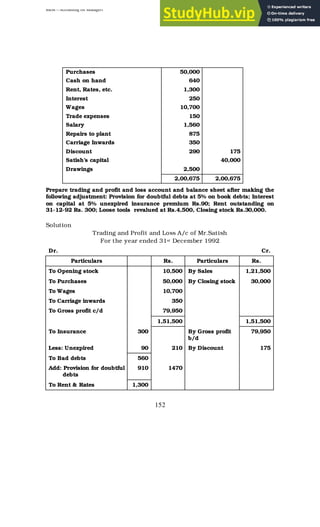
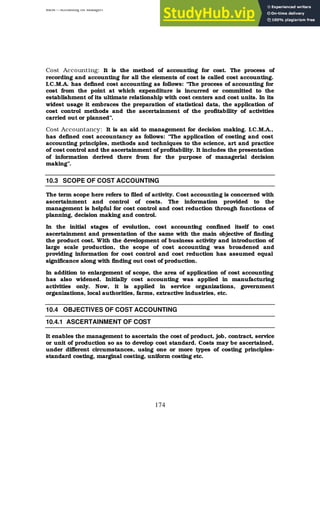
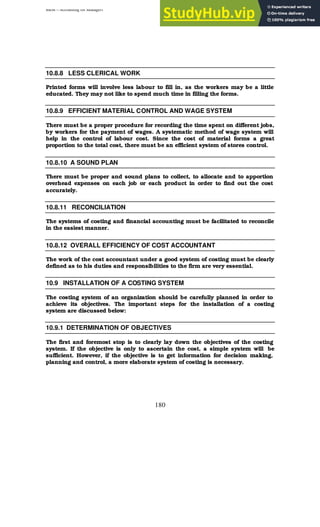
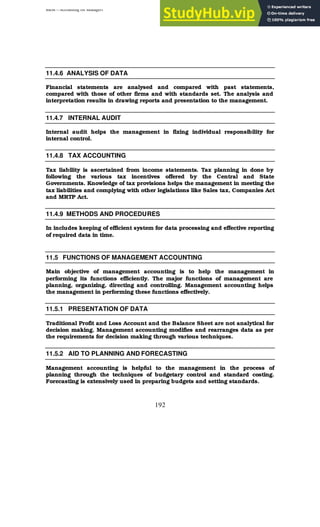
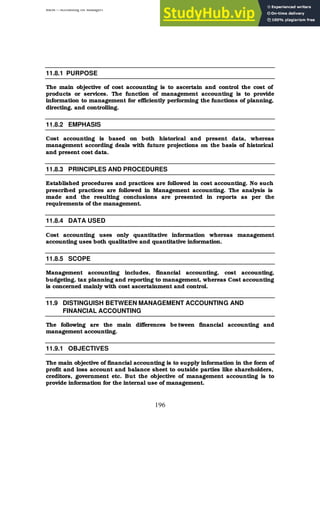
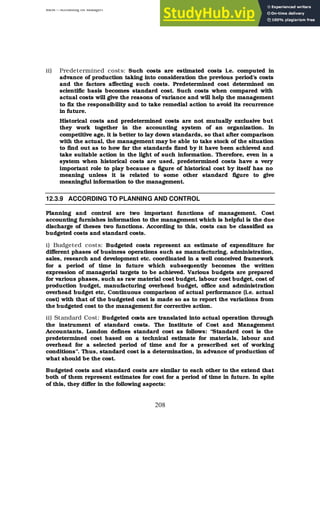
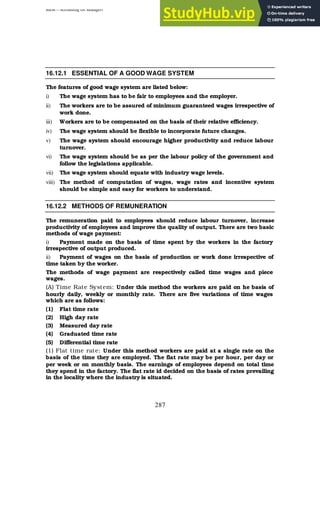
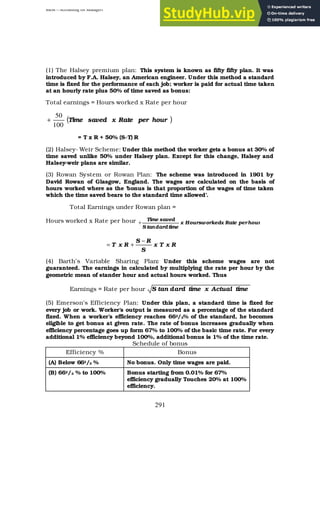
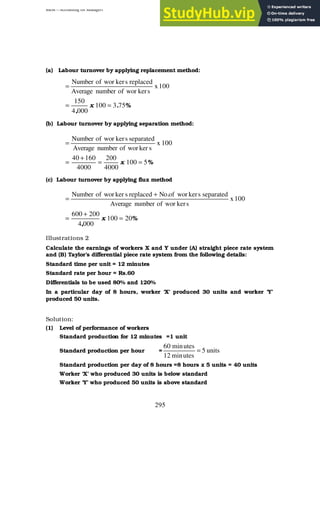
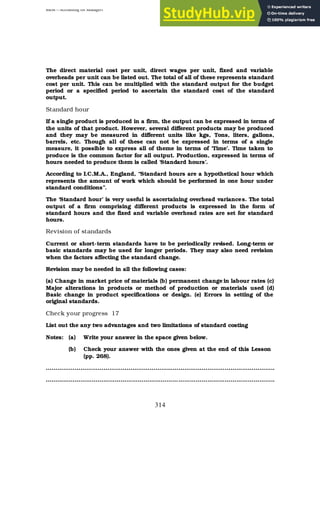
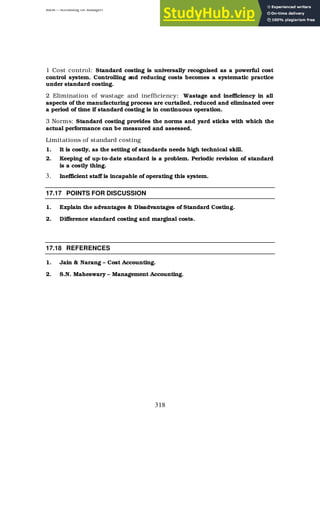
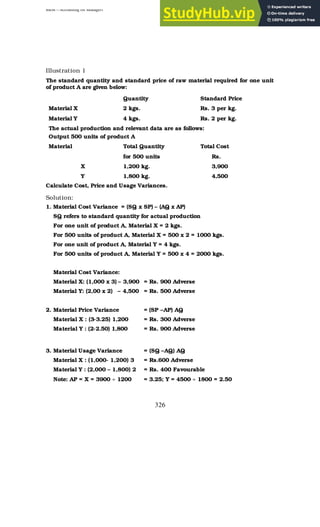
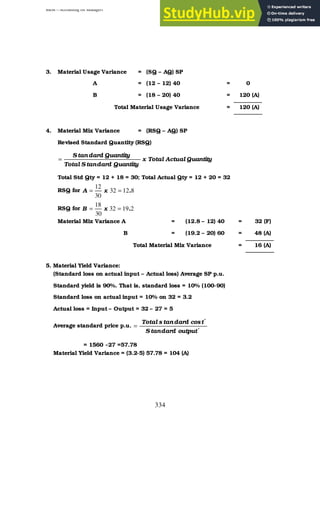
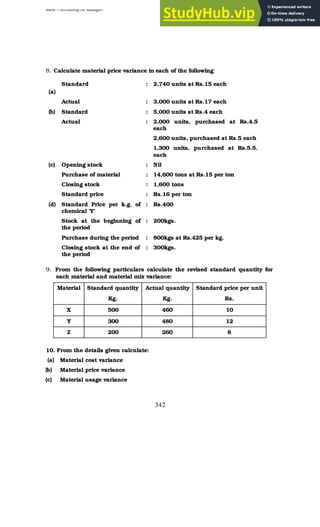
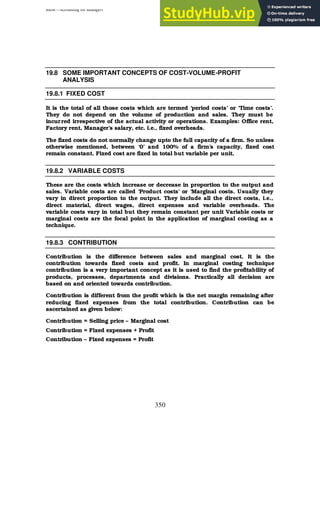
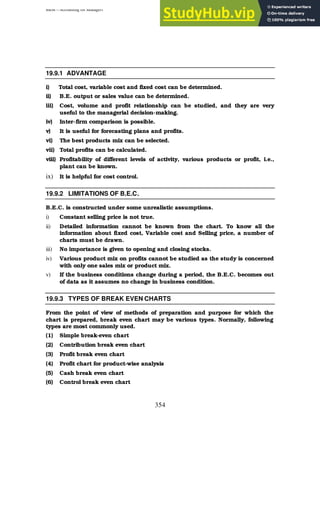
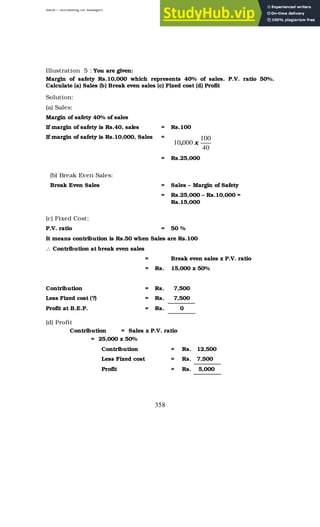
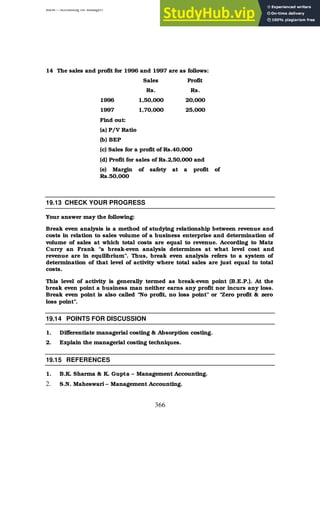
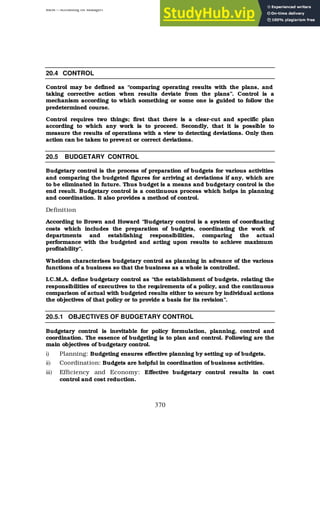
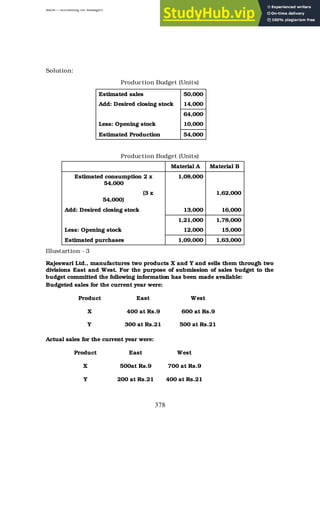
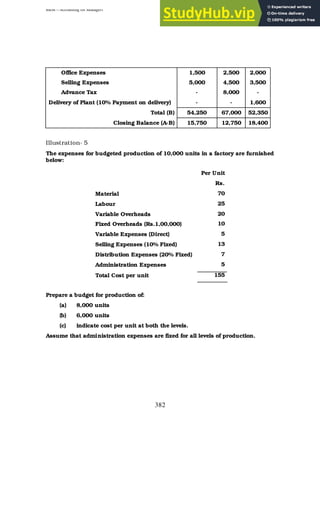
Trading A/c Dr xxx
To Opening Stock A/c xxx
To Purchases (Net) A/c xxx
To Direct expenses A/c xxx
[Being transfer of trading a/c debit side
items]
(ii) For transfer of sales (after reducing sales returns)
Sales (net) A/c Dr xxx
To Trading A/c xxx
[Being transfer of sales to Trading A/c]
(iii) For transferring gross profit
Trading A/c Dr xxx
To Profit & Loss A/c xxx
[Being transfer of gross profit to P&L A/c]
(iv) For Gross Loss
Profit & Loss A/c Dr xxx
To Trading A/c xxx
[Being transfer of gross loss to P&L A/c]
Note: Closing stock is taken into account by an adjustment journal entry along
with other adjustments.
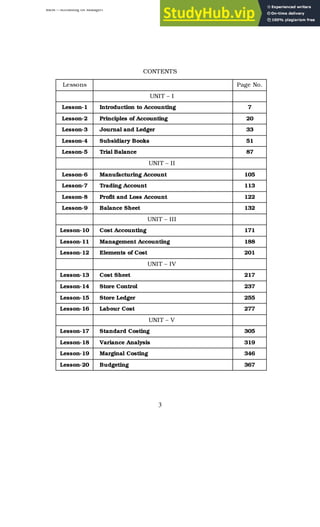
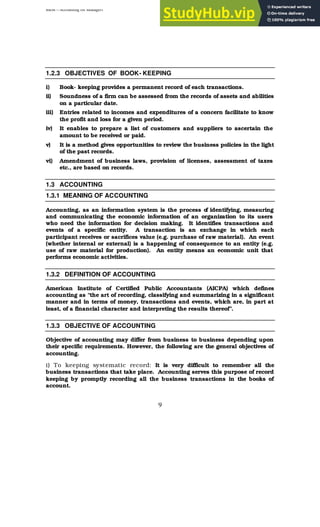
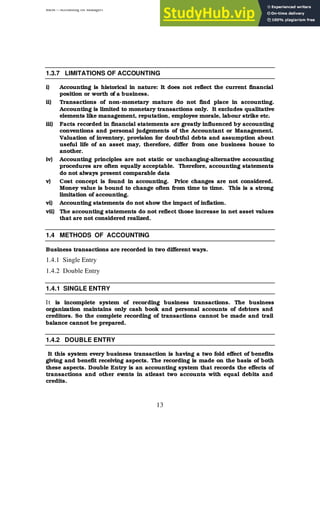
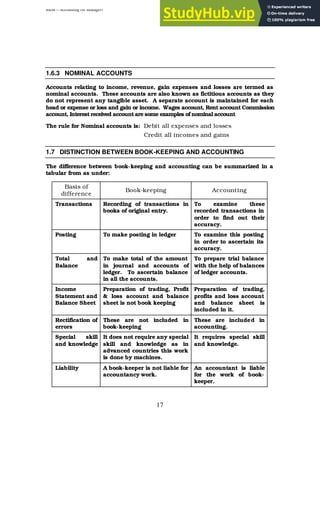
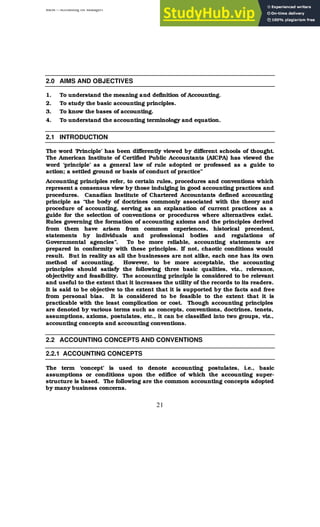
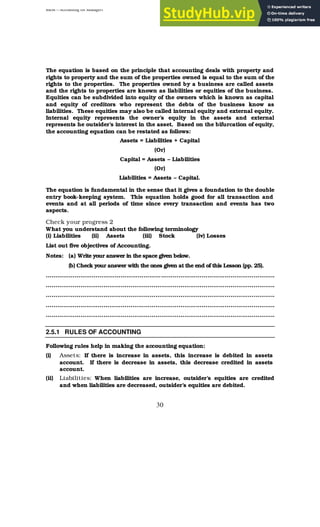
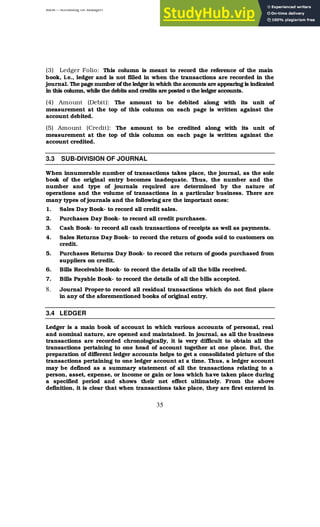
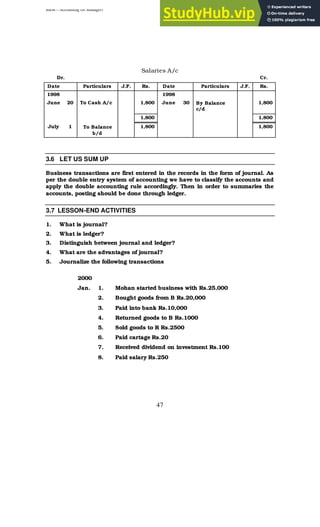
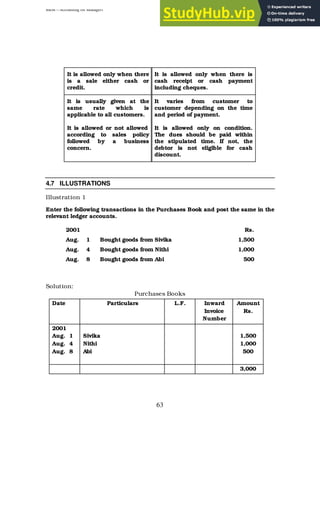
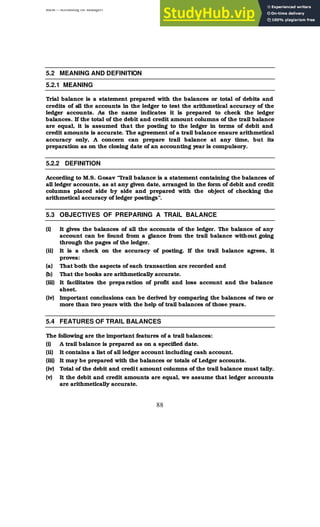
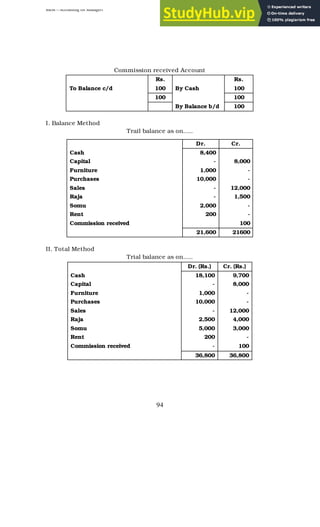
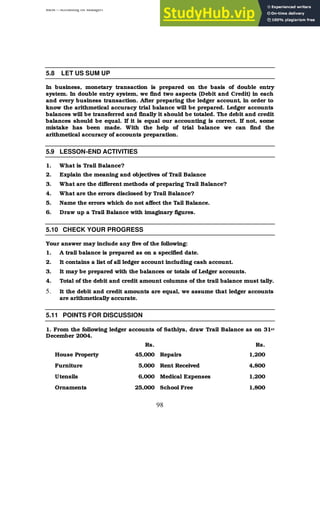
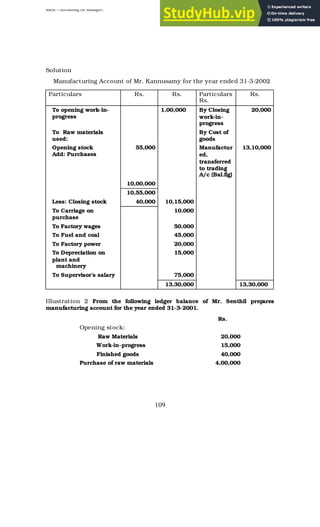
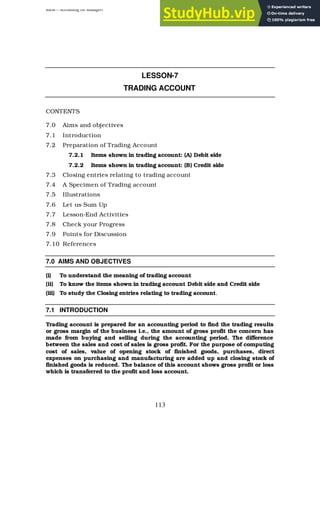
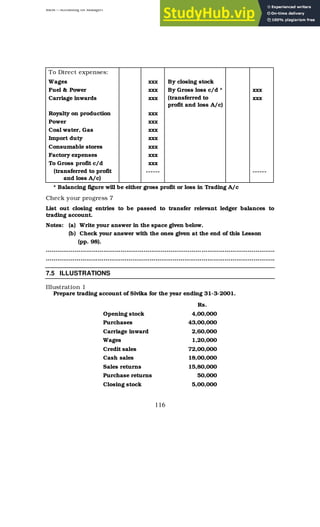
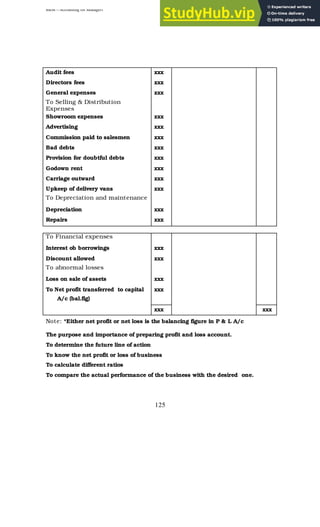
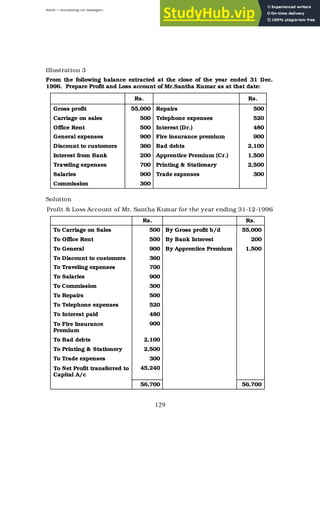
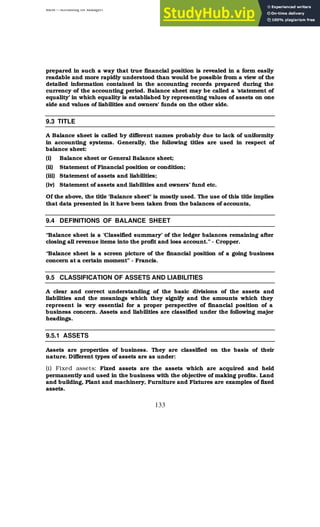
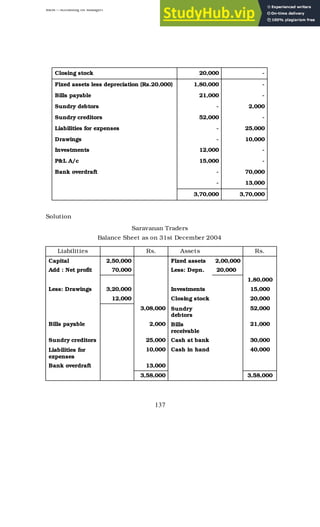
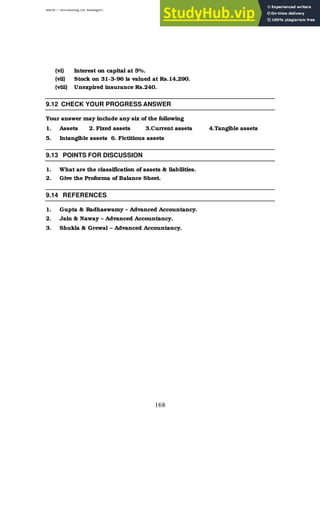
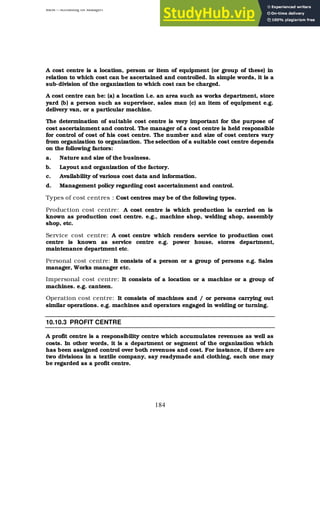
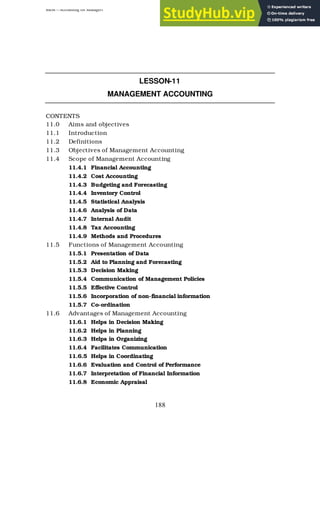
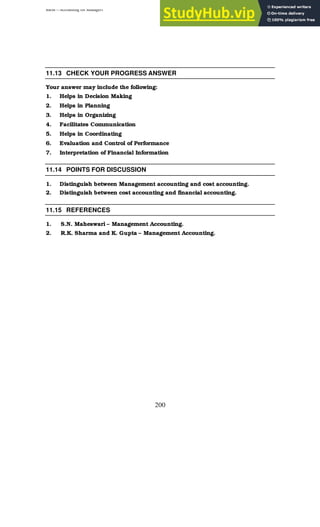
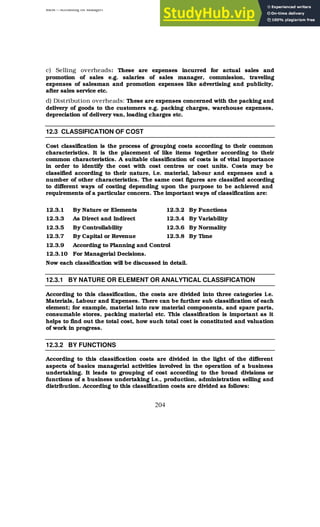
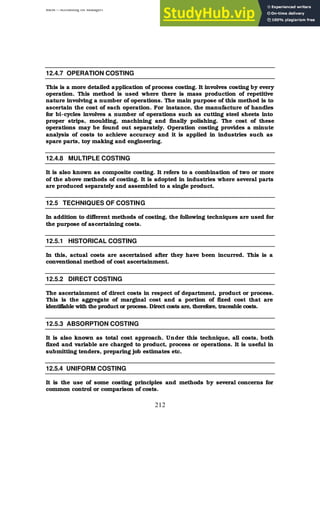
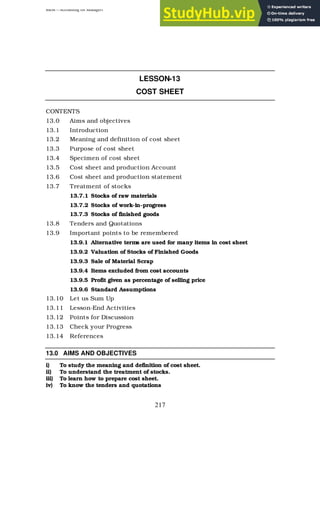
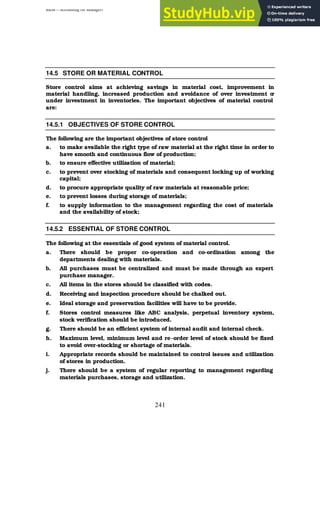
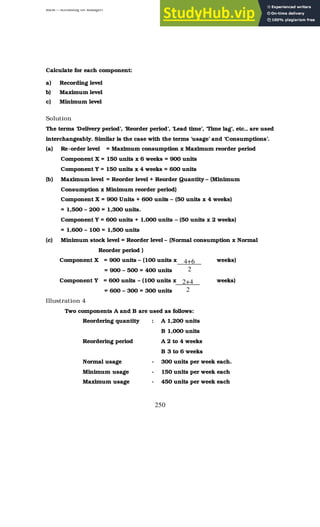
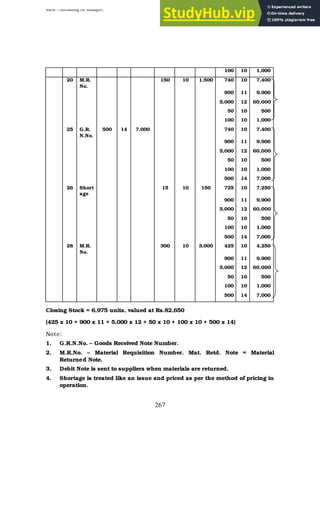
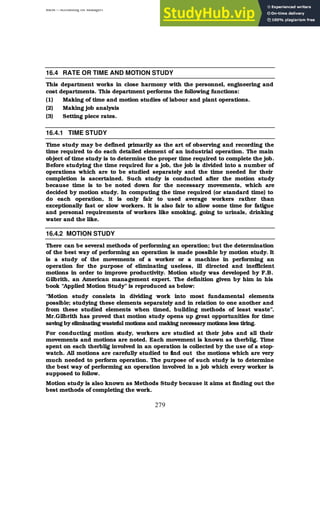
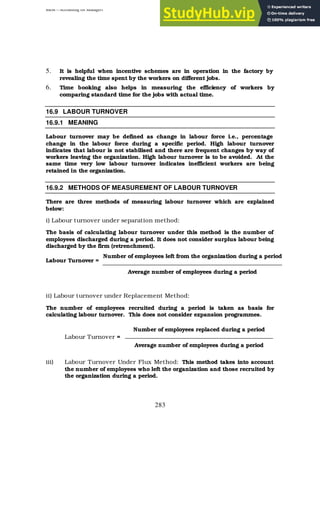
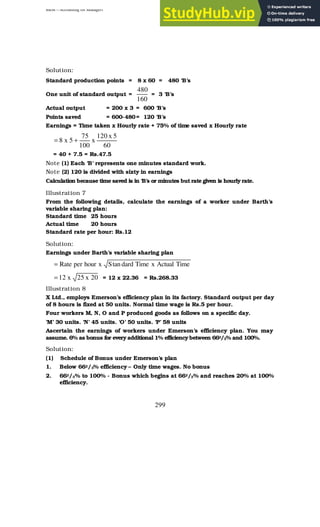
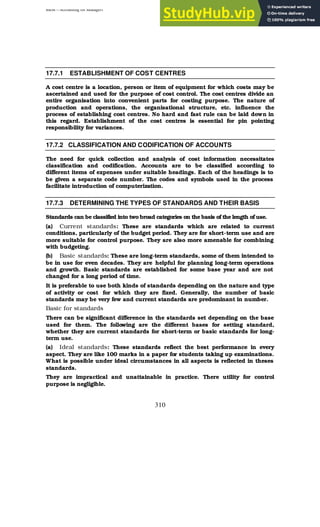
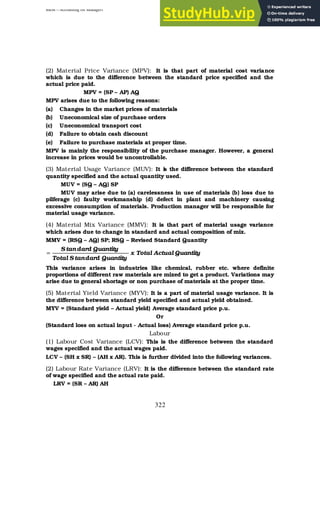
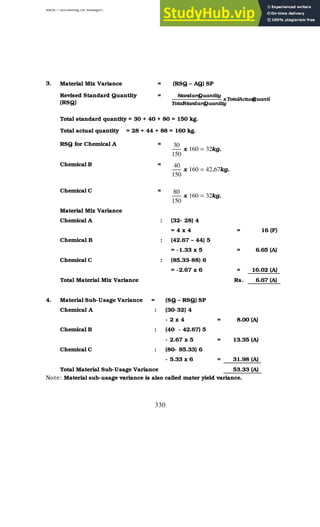
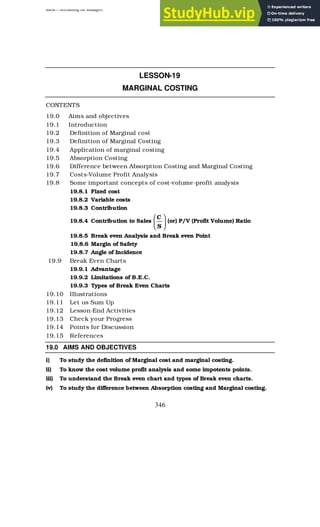
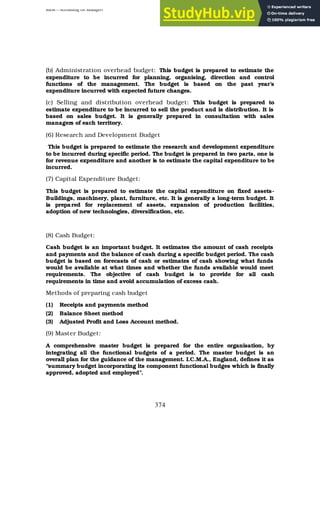
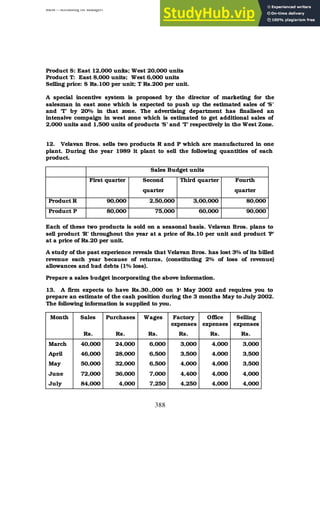
7.4 A SPECIMEN OF TRADING ACCOUNT IS SHOWN BELOW
Trading account for the year ended ……………
Particulars Rs. Rs. Particulars Rs. Rs.
To Opening stock xxx By Sales Xxx
To purchases xxx Less: Returns
inwards
(or)
Sales Returns
xxx
Less: purchase returns xxx xxx ----- xxx](https://image.slidesharecdn.com/accountingformanagers-230807160536-33b54065/85/Accounting-for-Managers-pdf-115-320.jpg)
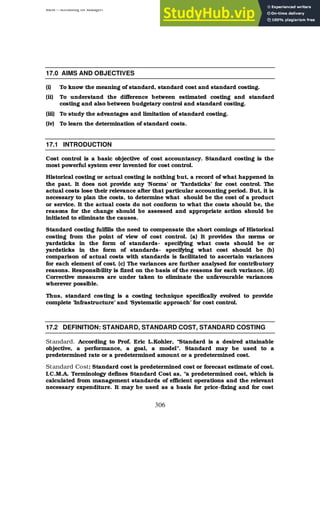
![BBM – Accounting for Managers
120
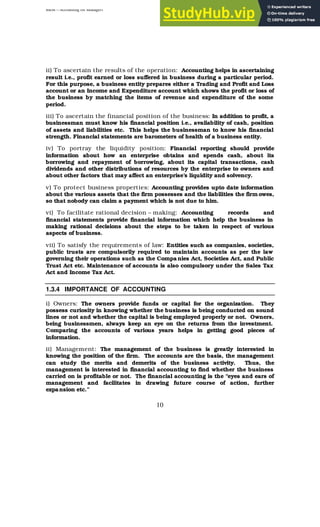
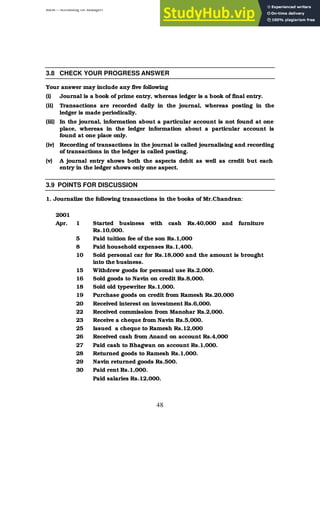
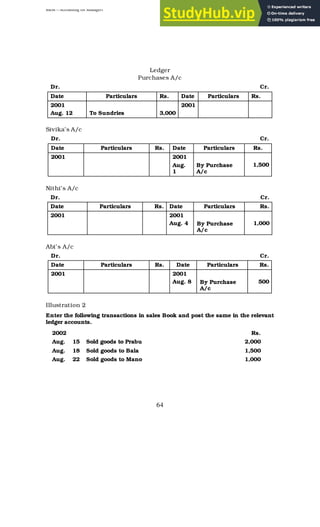
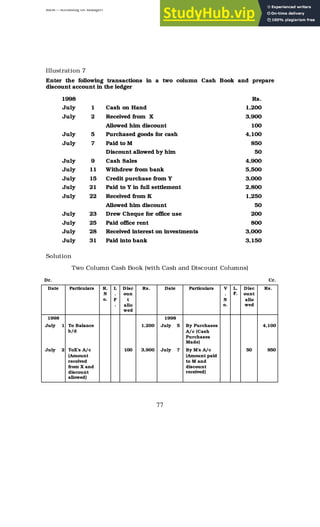
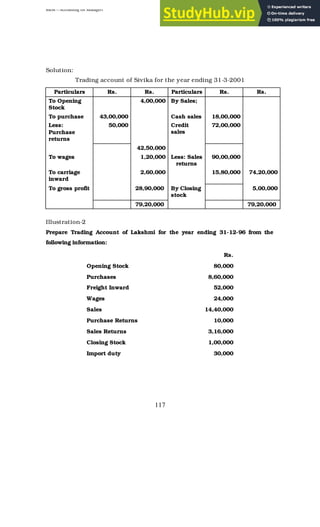
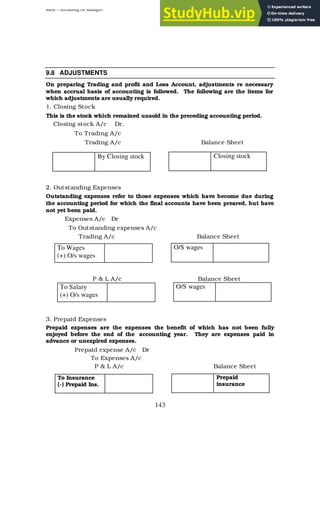
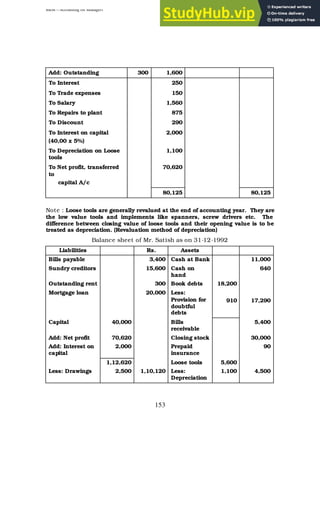
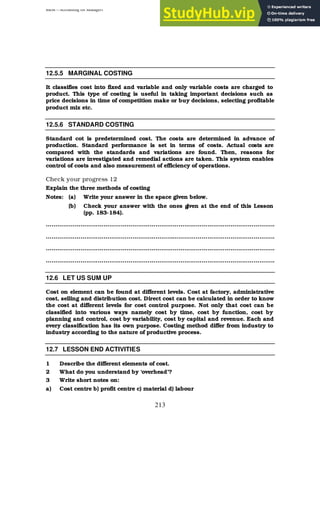
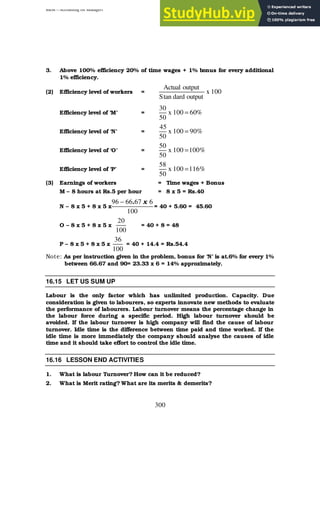
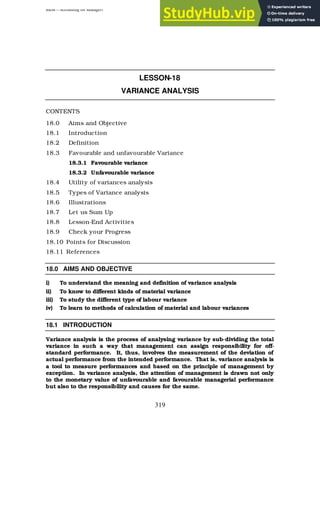
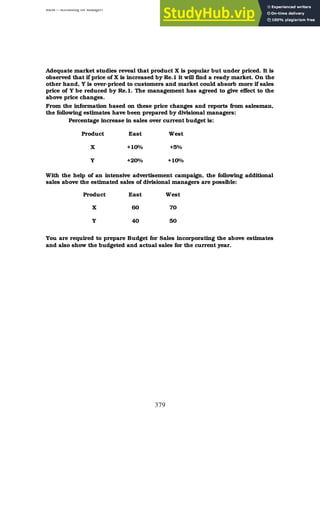
7.6 LET US SUM UP
At the end of the year, trading account is prepared to know the trading results.
Trade expenses like wages, carriage inward are considered. Cost of goods sold is
compared with sales in order to know gross profit / gross loss.
7.7 LESSON – END ACTIVITIES
1. What is trading account? Why it is prepared?
2. Distinguish between trading and manufacturing account?
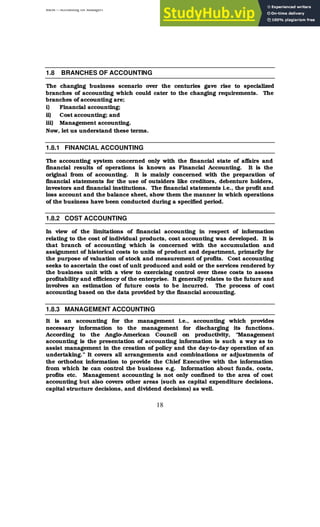
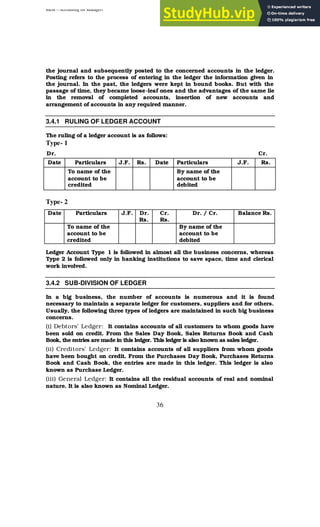
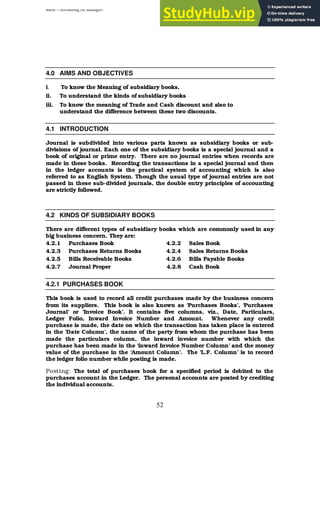
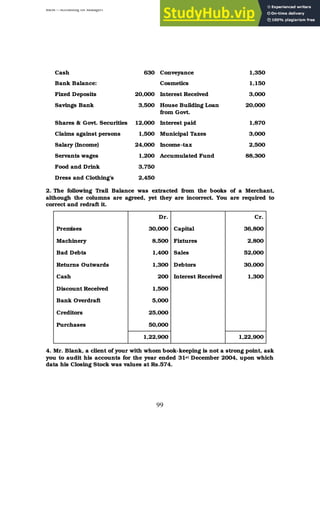
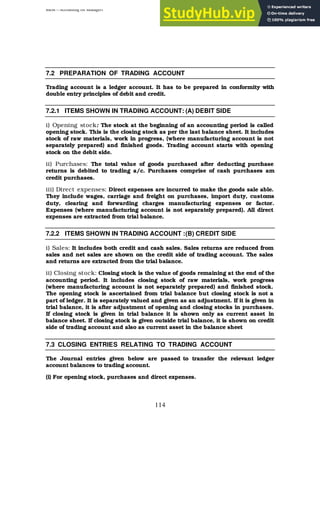
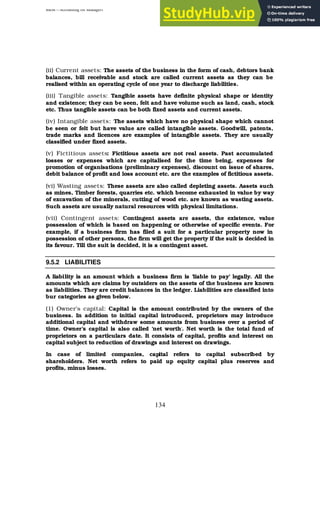
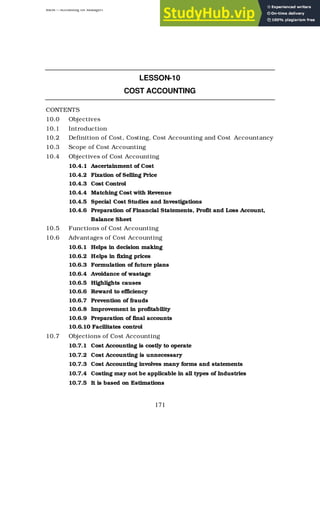
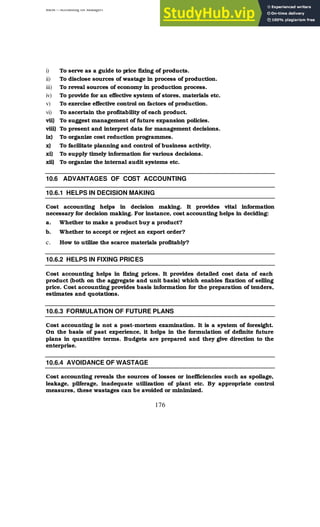
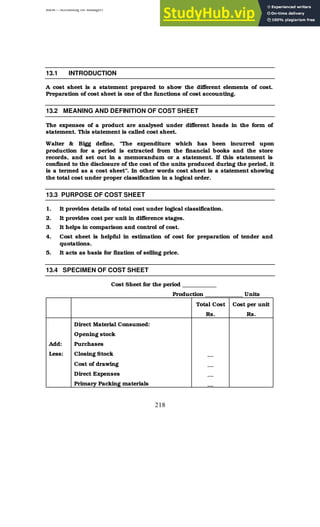
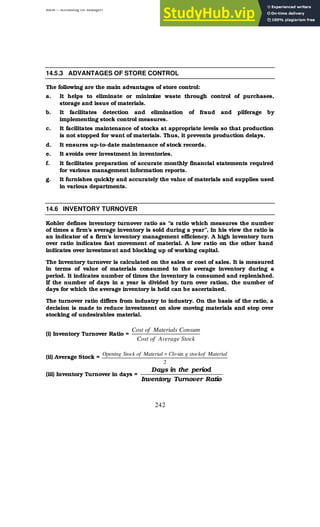
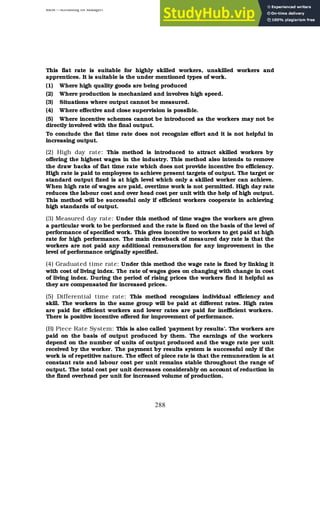
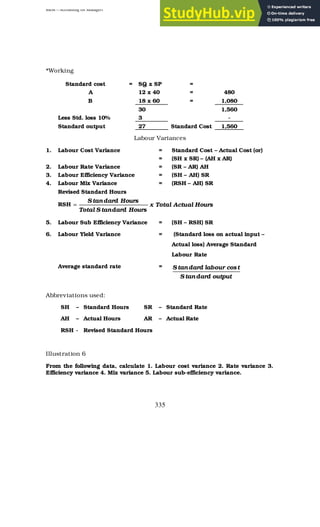
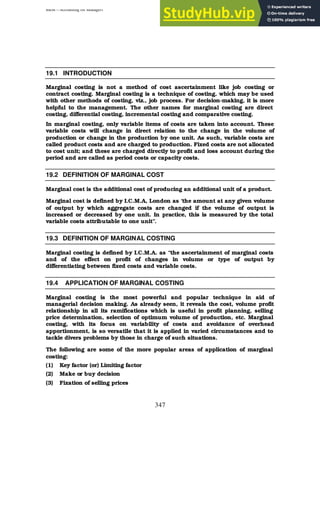
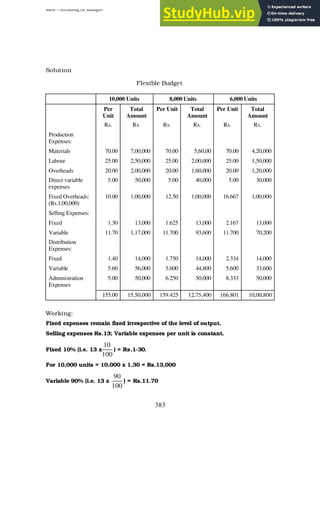
7.8 CHECK YOUR PROGRESS ANSWER
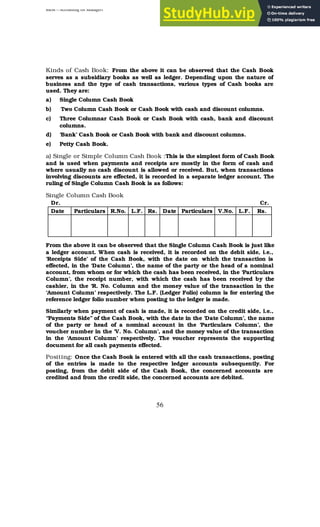
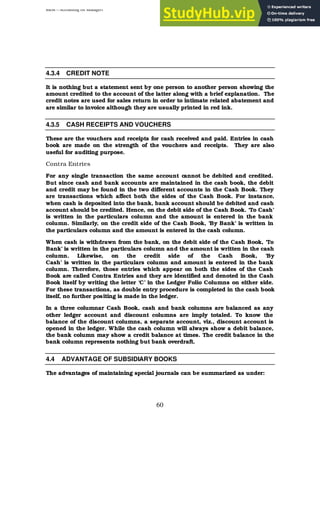
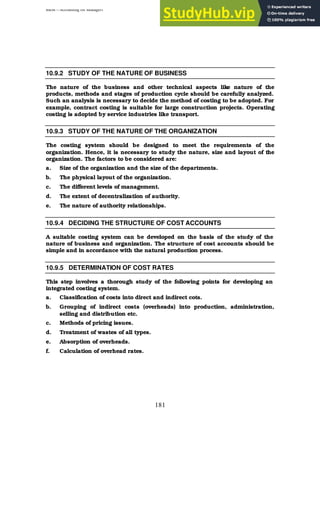
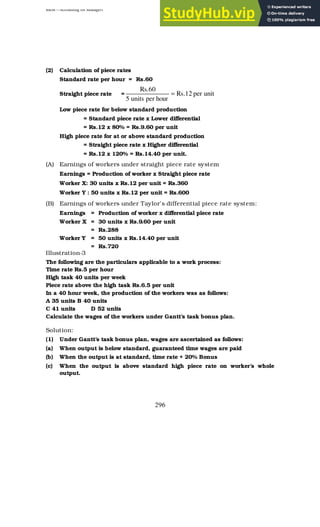
Your answer may include the following :
(i) For opening stock, purchases and direct expenses.
Trading A/c Dr xxx
To Opening Stock A/c xxx
To Purchases (Net) A/c xxx
To Direct expenses A/c xxx
[Being transfer of trading a/c debit
side items]
(ii) For transfer of sales (after reducing sales returns)
Sales (net) A/c Dr xxx
To Trading A/c xxx
[Being transfer of sales to Trading A/c]
(iii) For transferring gross profit
Trading A/c Dr xxx
To Profit & Loss A/c xxx
[Being transfer of gross profit to P&L A/c]
(iv) For Gross Loss
Profit & Loss A/c Dr xxx
To Trading A/c xxx
[Being transfer of gross loss to P&L A/c]](https://image.slidesharecdn.com/accountingformanagers-230807160536-33b54065/85/Accounting-for-Managers-pdf-120-320.jpg)
![BBM – Accounting for Managers
123
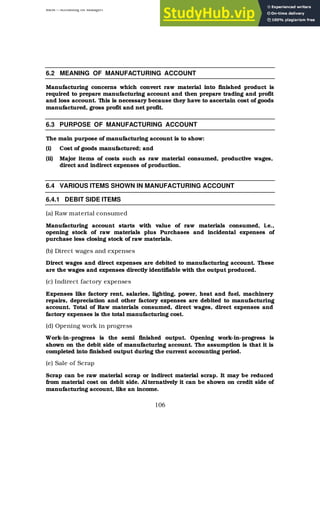
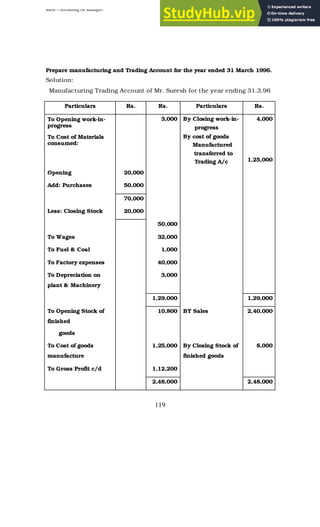
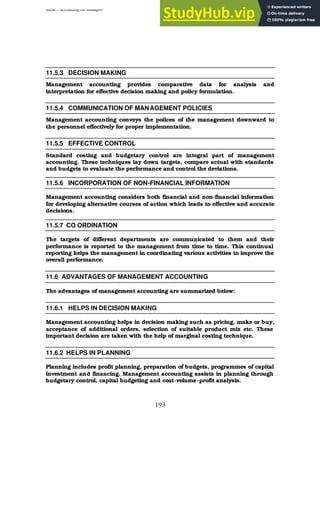
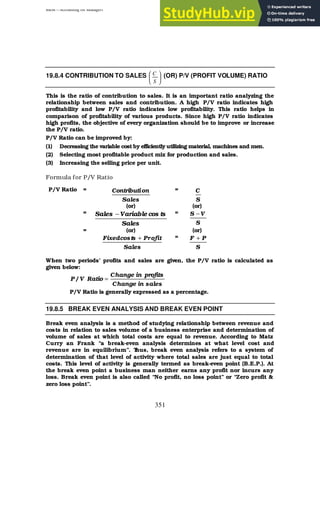
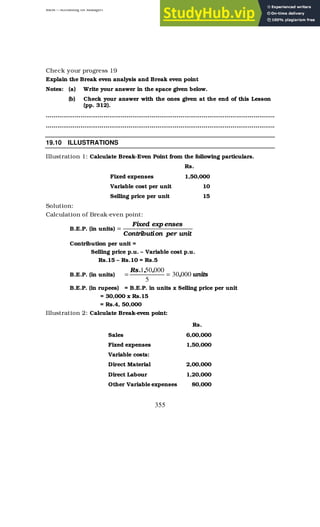
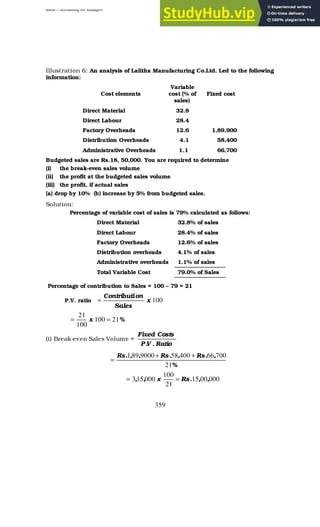
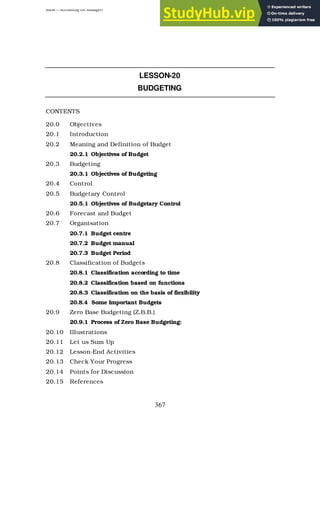
8.3 PREPARATION OF PROFIT AND LOSS ACCOUNT
Profit and loss account starts with gross profit brought down from trading
account on the credit side. (If gross loss, on the debit side). All the indirect
expenses are debited and all the revenue incomes are credited to the profit and
loss account and then net profit or loss is calculated. If incomes or credit is
more, than the expenses or debit, the difference is net profit. On the other hand
if the expenses or debit side is more, the difference is net loss.
8.3.1 DEBIT SIDE
Expenses shown on the debit side of profit and loss account are classified into
two categories
1. Operating expenses and 2. Non operating expenses
(1) Operating expenses: These expenses are incurred to operate the business
efficiently. They are incurred in running the organisation. Operating expenses
include administration, selling, distribution, finance, depreciation and
maintenance expenses.
(2) Non operating expenses: These expenses are not directly associate with day
today operations of the business concern. They include loss on sale of assets,
extraordinary losses, etc.
8.3.2 CREDIT SIDE
Gross profit is the first item appearing on the credit side of profit and loss
account. Other revenue incomes also appear on the credit side of profit and to
account. The other incomes are classified as operating incomes and non
operating incomes.
(1) Operating incomes: These incomes are incidental to business and earned
from usual business carried on by the concern. Examples: discount received,
commission earned, interest received etc.
(2) Non operating incomes: These incomes are not related to the business
carried on by the firm. Examples are profit on sale of fixed assets, refund of tax etc.
8.4 CLOSING ENTRIES FOR PROFIT AND LOSS ACCOUNT
1. For transferring expenses to profit and loss account:
Profit and Loss A/c Dr xxx
To expenses A/c xxx
[Being transfer of all P&L A/c debit
side items]](https://image.slidesharecdn.com/accountingformanagers-230807160536-33b54065/85/Accounting-for-Managers-pdf-123-320.jpg)
![BBM – Accounting for Managers
124
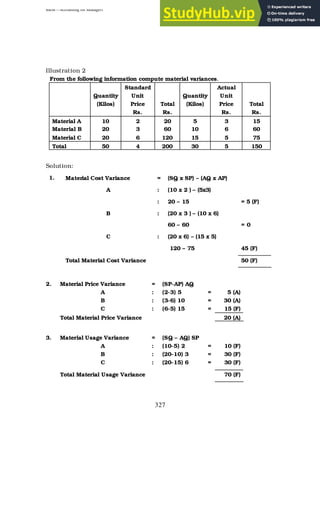
2. For transfer of incomes to profit and loss account
Incomes A/c Dr xxx
To Profit and Loss A/c xxx
[Being transfer of Incomes to P&L A/c]
3. For net profit:
P&L A/c Dr xxx
To Capital A/ xxx
[Being net profit credited to capital]
4. For transfer of Net Loss
Capital A/c Dr xxx
To P&L A/c xxx
[Being net loss transferred to capital]
Note: In case of partnership, the profit or loss is divided between partners in
their profit sharing ratio and credited or debited to the individual partners. In
case of limited companies, Net profit or loss is transferred to the P&L
Appropriation A/c for disposal.
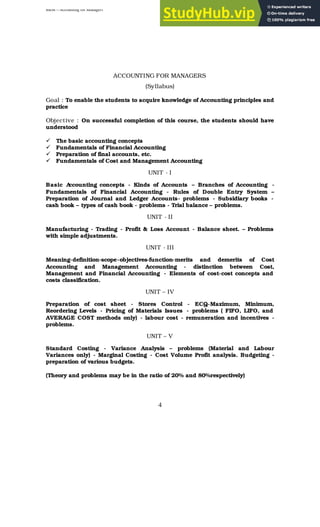
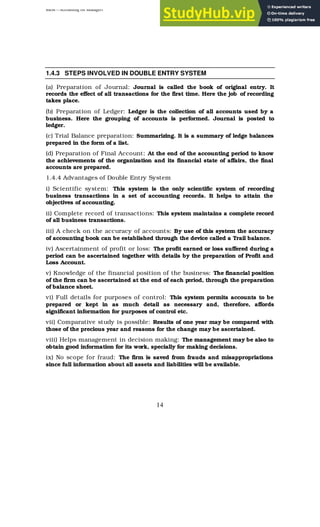
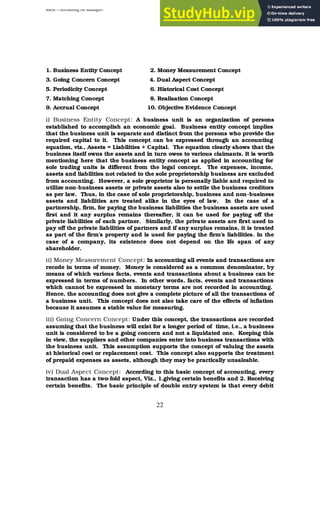
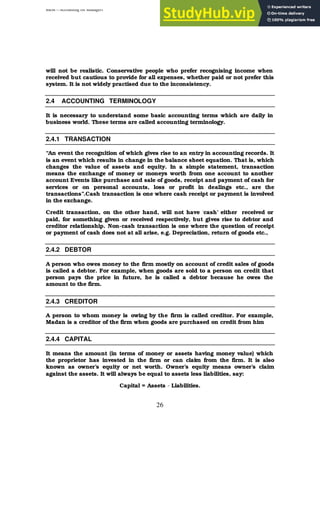
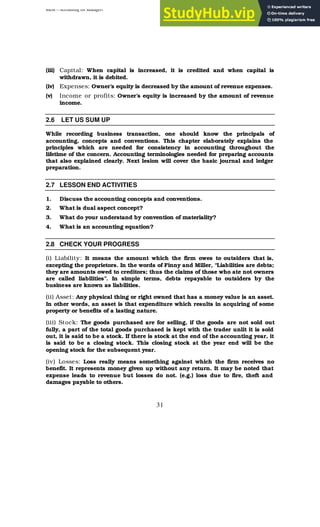
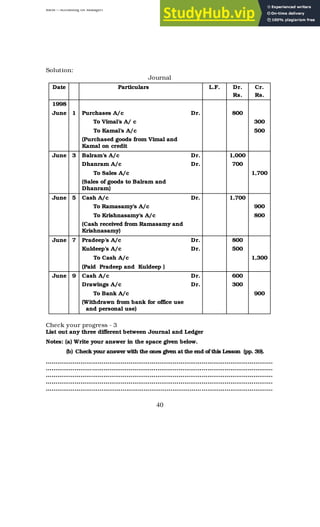
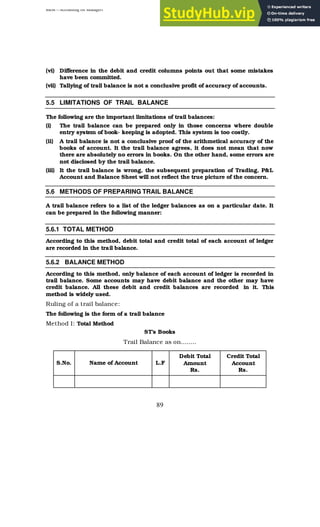
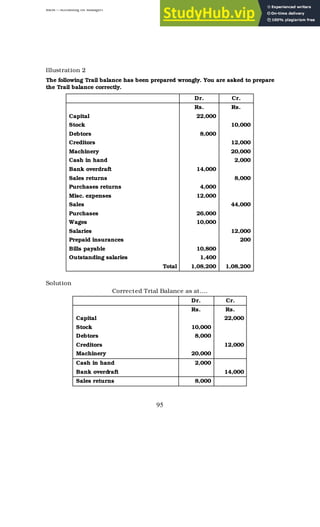
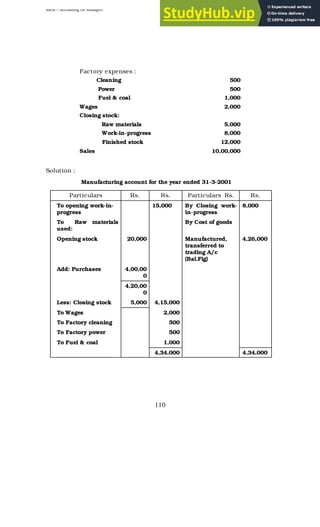
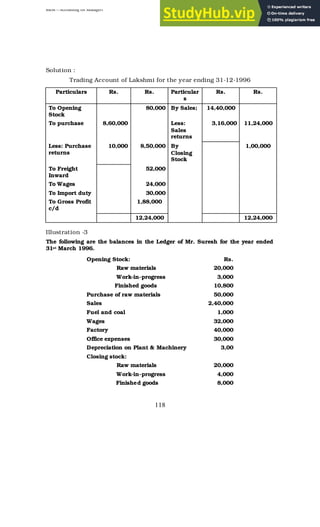
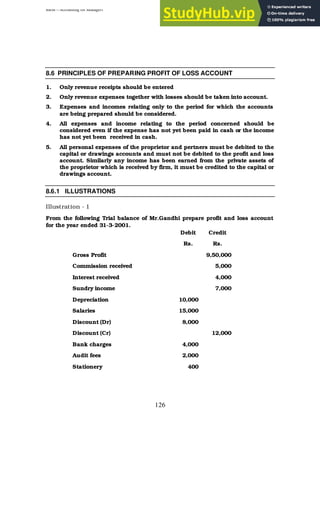
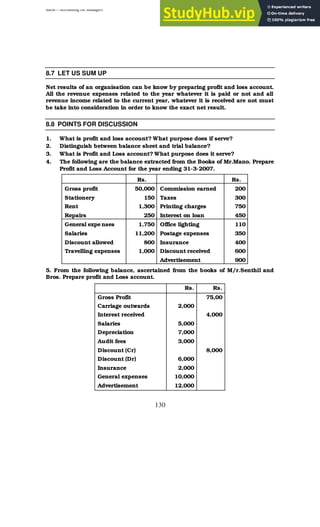
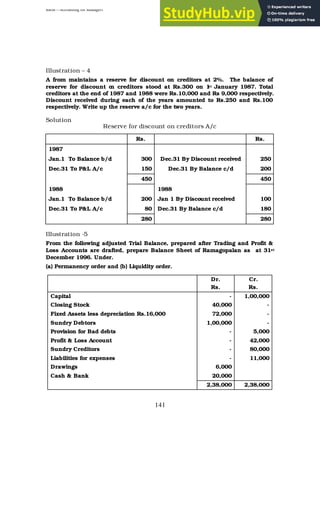
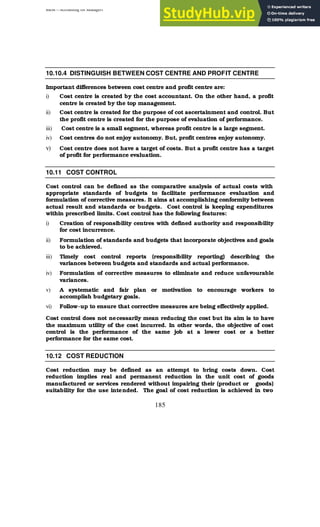
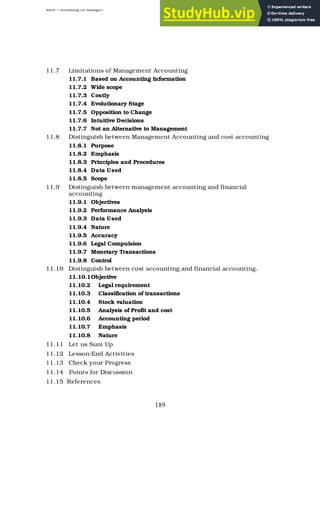
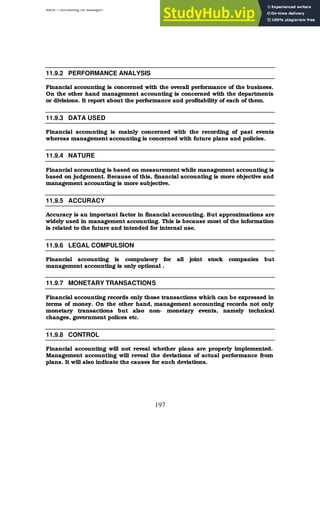
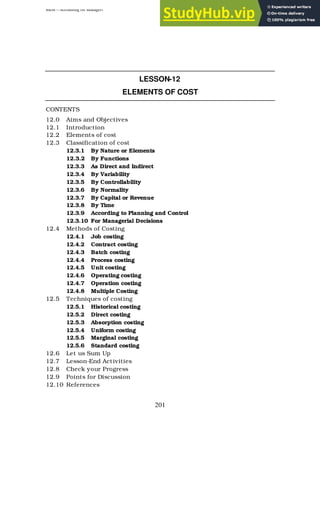
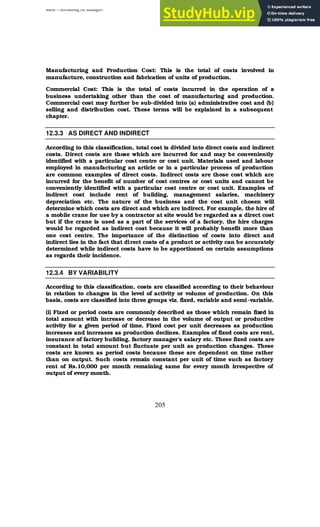
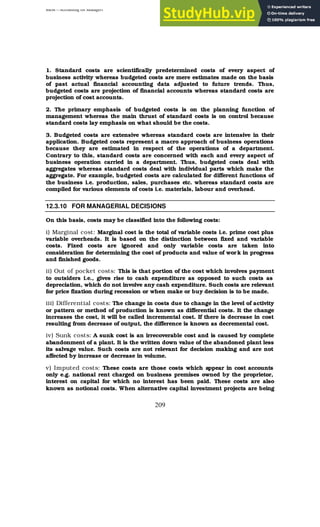
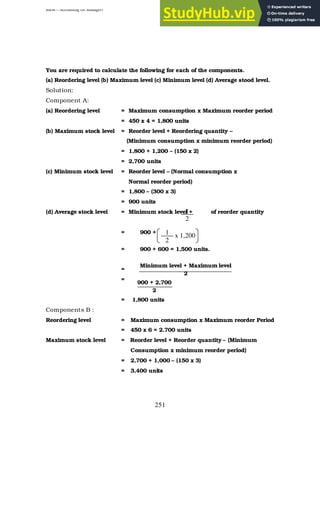
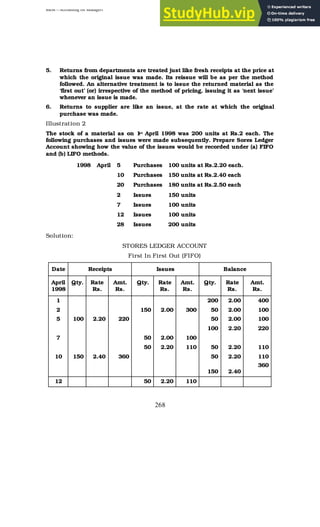
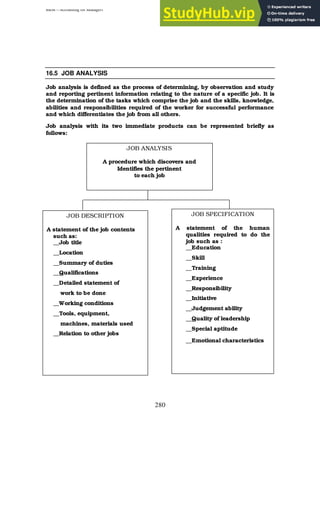
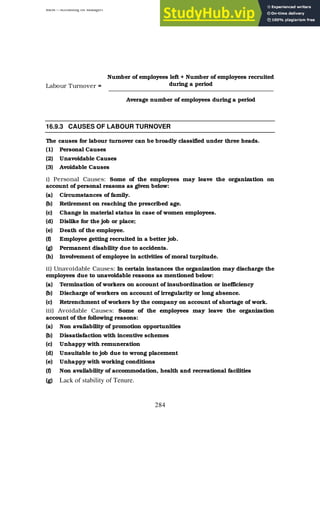
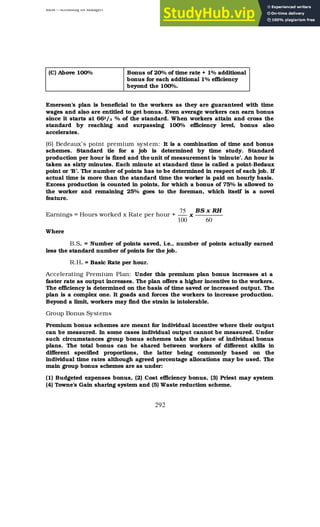
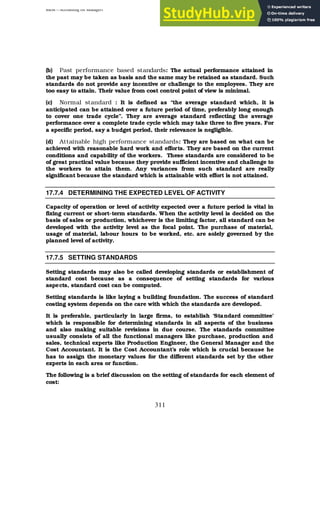
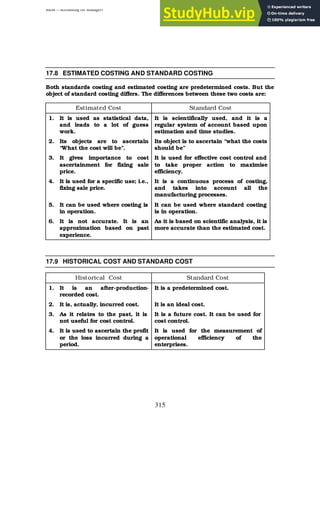
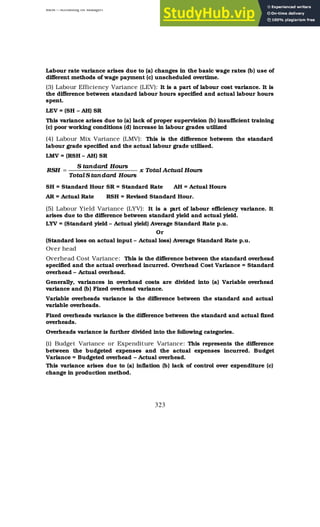
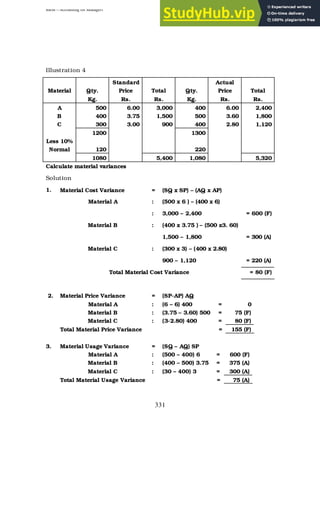
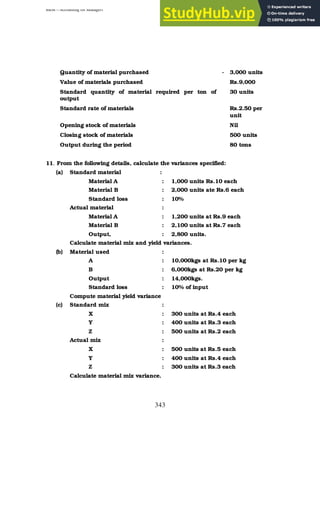
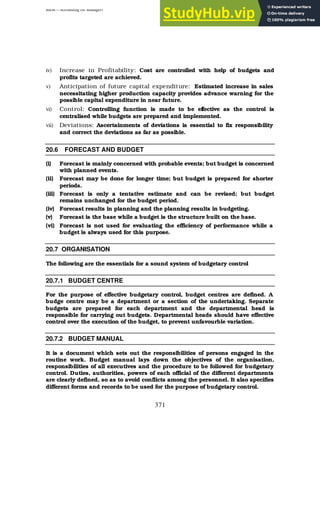
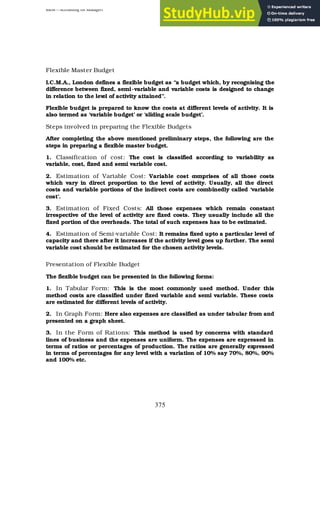
8.5 THE SPECIMEN OF PROFIT AND LOSS ACCOUNT IS SHOWN BELOW
Profit and Loss Account
For the year ended 31st March 2001
Particulars Rs. Particulars Rs.
To Gross loss b/d xxx By Gross profit b/d xxx
To Administration expenses By Dividends received xxx
Salaries xxx By Interest received xxx
Rent rates & taxes xxx By Discount received xxx
Printing & Stationery xxx By commission received xxx
Postage and Telegrams xxx By Rent received xxx
Telephone expenses xxx By Profit on sale of assets xxx
Legal charges xxx By Sundry revenue receipts xxx
Insurance xxx By Net loss transferred to
capital A/c (Bal. Fig)*
xxx](https://image.slidesharecdn.com/accountingformanagers-230807160536-33b54065/85/Accounting-for-Managers-pdf-124-320.jpg)
![BBM – Accounting for Managers
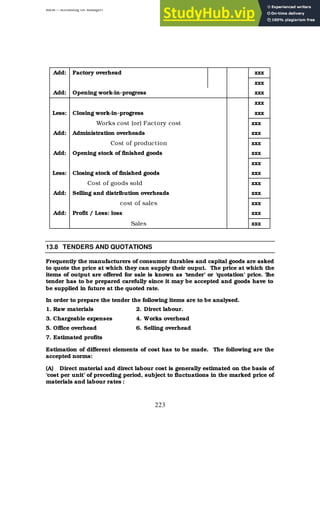
138
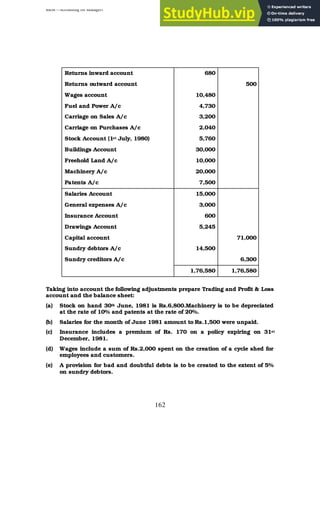
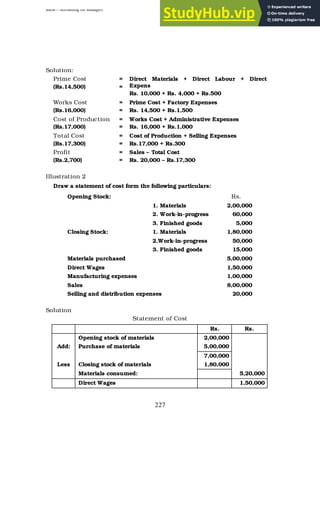
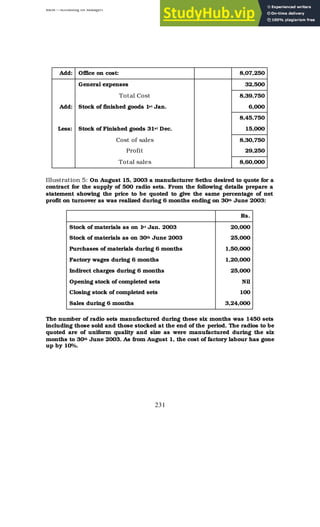
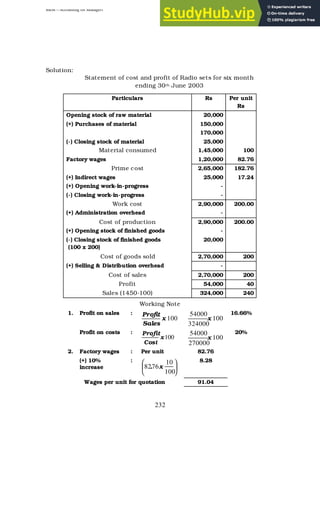
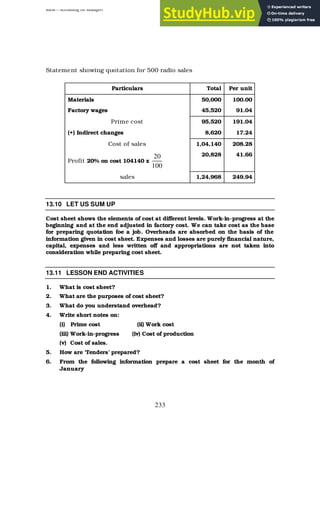
Illustrations 2
The reserve for doubtful debts account showed a credit balance of Rs.1,500 on
1.1.90. During 1990, bad debts amounted to Rs.1,100. The debtors on 31.12.90
owed Rs.40,000. Maintain a 5% reserve for doubtful debts. During 1991, bad
debts came to Rs.800. On 31.12.91 the debtors owed Rs.44,000. The bad debts
in 1992 amounted to Rs.400. On 31.12.92, the debtors owed Rs.32,000. The
same 5% reserve for doubtful debts is maintained in all the years. Pass
necessary journals and ledger accounts.
Solution
Journal Entries
Date Particulars Rs. Rs.
1990 Bad debts A/c Dr. 1,100
Dec.31 To Sundry debtors A/c 1,100
[Being bad debts written off]
” Prov. For doubtful debts A/c Dr. 1,100
To Bad debts A/c 1,100
[Being bad debts transferred]
” Profit & Loss A/c Dr. 1,600
To Provision for doubtful debts A/c 1,600
[Being amount transferred to P&L A/c
1991 Bad debts A/c Dr. 800
Dec.31 To Sundry debtors A/c 800
[Being bad debts written off]
” Prov. for doubtful debts A/c Dr. 800
To Bad debts A/c 800
[Being bad debts transferred]
” Profit & Loss A/c Dr. 1,000
To Provision for doubtful debts A/c 1,000
[Being amount transferred to P & L A/c
1992 Bad debts A/c Dr. 400
Dec.31 To Sundry debtors A/c 400
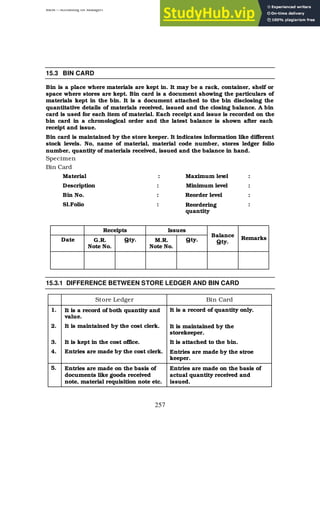
[Being bad debts written off]
” Prov. for doubtful debts A/c Dr. 400
To Bad debts A/c 400
[Being bad debts A/c]
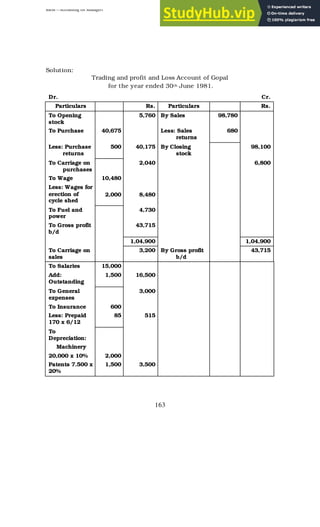
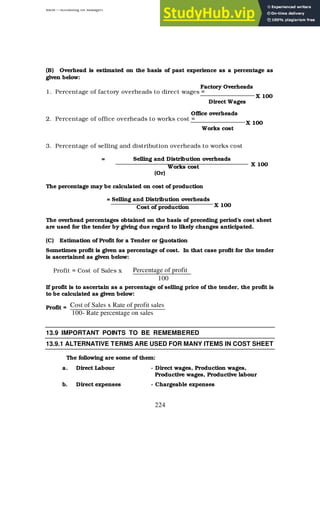
” Prov. for doubtful debts A/c Dr. 300](https://image.slidesharecdn.com/accountingformanagers-230807160536-33b54065/85/Accounting-for-Managers-pdf-138-320.jpg)
![BBM – Accounting for Managers
139
To Profit & Loss A/c 300
[Being excess reserve credited to P&L A/c]
Bad debts A/c
Rs. Rs.
1990 1990
Dec.31 To Sundry Debtors 1,100 Dec.31 By Prov. for
doubtful
debts
1,100
1991 1991
Dec.31 To Sundry Debtors 800 Dec.31 By Prov. for
doubtful
debts
800
1992 1992
Dec.31 To Sundry Debtors 400 Jan 1 Balance b/d 400
Provision for doubtful debts A/c
Rs. Rs.
1990 To Bad debts 1,100 1990 By Balance b/d 1,500
Dec.31 To Balance c/d 2,000 Dec.31 By P&L A/c 1,600
3,100 3,100
1991 1991
Dec.31 To Bad debts
To Balance c/d
800
2,200
Jan.31 By Balance b/d
By P&L A/c
2,000
1,000
3,000 3,000
1992 1992
Dec.31 To Bad debts
To P&L A/c
To Balance c/d
400
300
1,500
Jan 1 Balance b/d 2,200
2,200 2,200
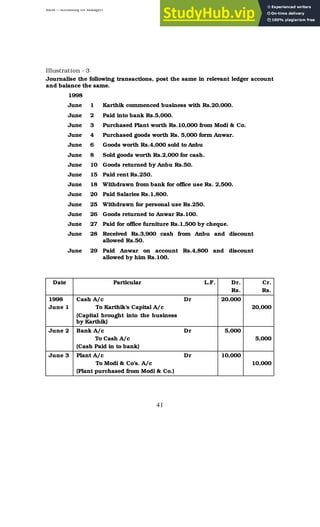
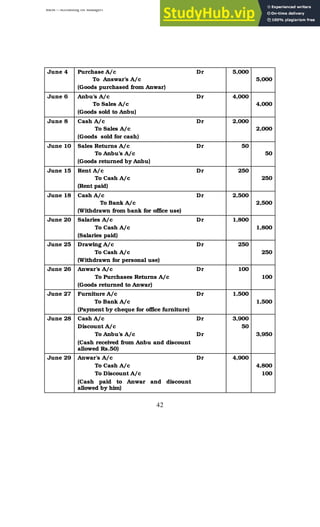
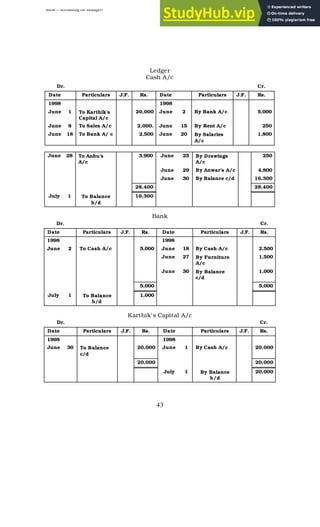
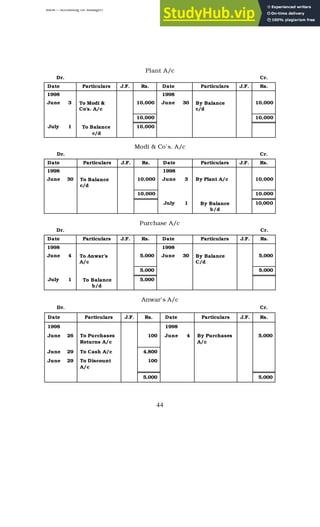
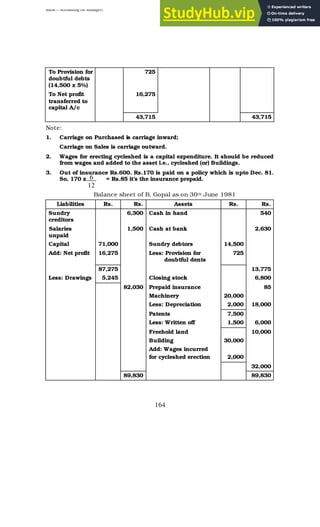
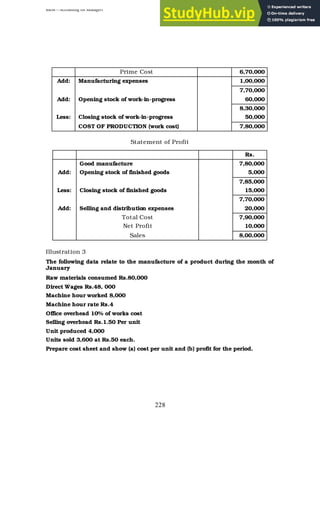
Illustration -3
The sundry debtors of a firm on 1
st December 1987 were Rs.40,000. On that
date it was decided to create a provision for discount at 2% on debtors . During
1988 the actual amount of discount allowed was Rs.400. The debtors on 31st
December 1988 were Rs30,000 and it is again decided to create a provision for](https://image.slidesharecdn.com/accountingformanagers-230807160536-33b54065/85/Accounting-for-Managers-pdf-139-320.jpg)
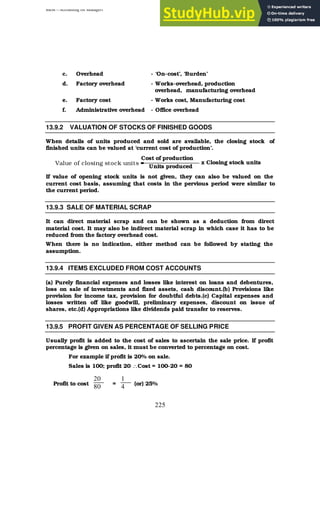
![BBM – Accounting for Managers
140
discount on debtors at 2%. Show the journal entries, discount A/c and provision
for discount A/c for both the year.
Solution
Journal Entries
Date Particulars Rs. Rs.
1987 Profit & loss Dr. 800
Dec.31 To Res. For discount on debtors A/c 800
[Being 2% reserve created on Rs.40,000]
1988 Discount A/c Dr. 400
Dec.31 To Sundry debtors A/c 400
[Being the discount allowed to debtors]
” Reserve for discount on debtors A/c Dr. 400
To Discount A/c 400
[Being the transfer made]
” Profit & Loss A/c Dr. 200
To Res. For discount on debtors A/c 200
[Being the provision created]
Reserve for discount on debtors A/c
Rs. Rs.
1987 1987
Dec. 31 To Balance c/d 800 Dec.31 By P&L A/c 800
800 800
1998 1988
Dec.31 To Discount 400 Jan 1 By Balance b/d 800
” To Balance c/d 600 Dec.31 By P&L A/c 200
1,000 1,000
Discount A/c
Rs. Rs.
1998 1988
Dec.31 To Sundry Debtors 400 Dec.31 By Res. For doubtful
debts
400
400 400](https://image.slidesharecdn.com/accountingformanagers-230807160536-33b54065/85/Accounting-for-Managers-pdf-140-320.jpg)


![BBM – Accounting for Managers
247
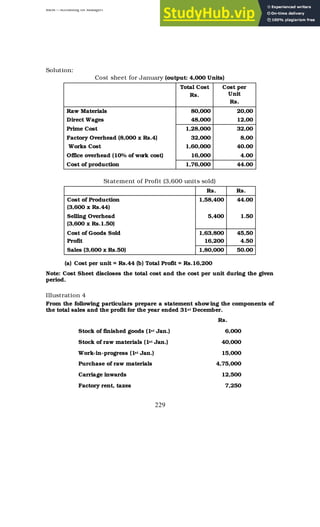
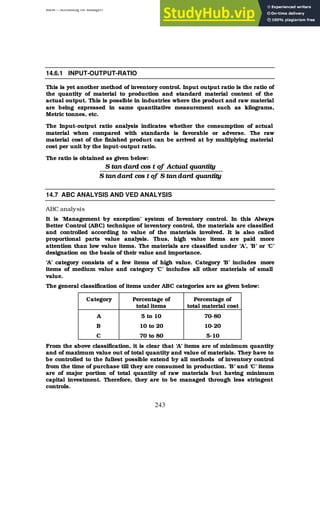
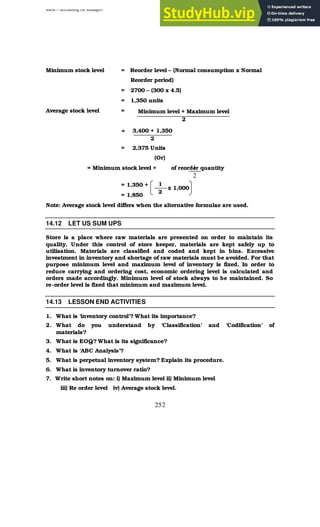
14.9.4 AVERAGE STOCK LEVEL
This stock level shows the average quantity of materials kept in the store. This is
regarded as the average of maximum and minimum stock levels.
Formula:
Average stock level =
2
level
Minimum
level
Maximum +
If maximum stock level is not available.
Average stock level = Minimum level + ½ Reorder quantity
14.10 ECONOMIC ORDER QUANTITY [EOQ]
Economic ordering quantity depends on many factors like cost of purchasing
and receiving, normal consumption, interest on capital, availability of storage
accommodation, ordering and carrying costs. Economic ordering quantity is the
reorder quantity, which is the quantity to be purchased each time an order is
placed.
When the purchase price remains constants, the economic ordering quantity will
be determined based on the following formula:
EOQ =
CS
AB
2
Where
EOQ = Economic Ordering Quantity
A = Annual consumption or usage of material in units.
B = Buying cost per order.
C = Cost per unit.
S = Storage and carrying cost per annum.
Check your progress 14
What you understand about ABC analysis
Notes: (a) Write your answer in the space given below.
(b) Check your answer with the ones given at the end of this Lesson
(pp. 215).
……………………………………………………………………………………………………….
……………………………………………………………………………………………………….
………………………………………………………………………………………………………..
………………………………………………………………………………………………………..
………………………………………………………………………………………………………..](https://image.slidesharecdn.com/accountingformanagers-230807160536-33b54065/85/Accounting-for-Managers-pdf-247-320.jpg)
![BBM – Accounting for Managers
255
LESSON-15
STORES LEDGER
CONTENTS
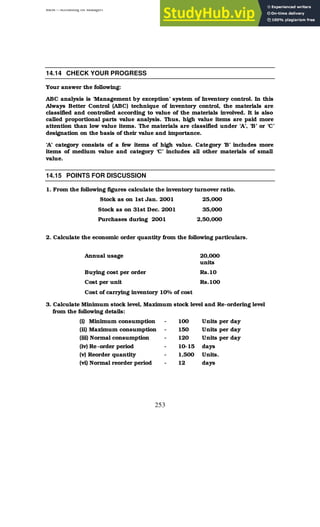
15.0 Aims and objectives
15.1 Introduction
15.2 Store ledger Specimen
15.3 BIN card
15.3.1 Difference between store ledger and Bin card
15.4 Issue of material
15.4.1 Material requisition
15.4.2 Bill of material
15.5 Treatment of surplus material
15.5.1 Return of surplus Material
15.5.2 Transfer of surplus Material
15.6 Methods of pricing of material
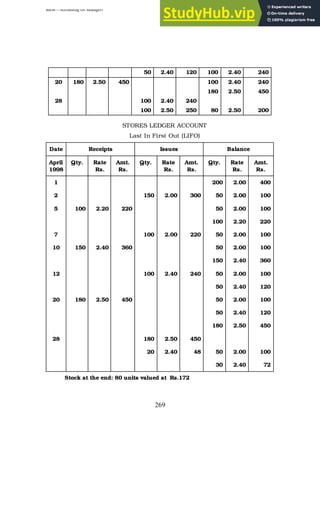
15.6.1 First in First out method [FIFO]
15.6.2 Last in First out method [LIFO]
15.6.3 Simple Average method
15.6.4 Weighted Average method
15.7 Material losses and Types
15.7.1 Waste
15.7.2 Scrap
15.7.3 Spoilage
15.7.4 Defectives
15.7.5 Obsolete, Slow moving and Dormant Stocks
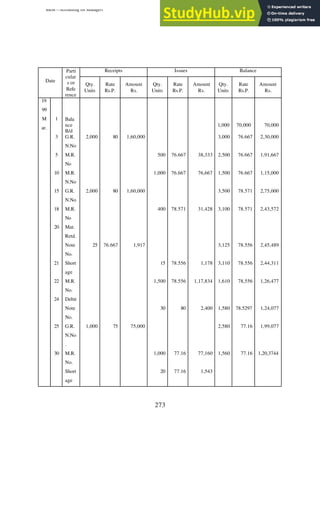
15.8 Illustration
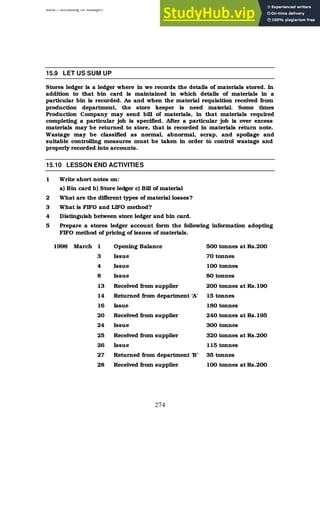
15.9 Let us Sum Up
15.10 Lesson-End Activities
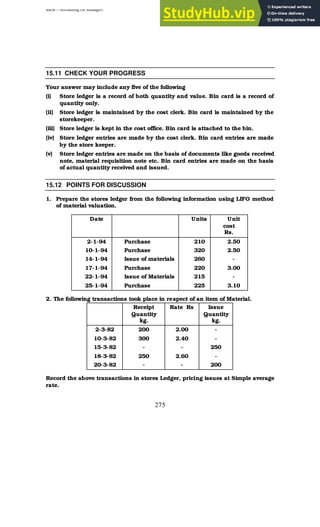
15.11 Check your Progress
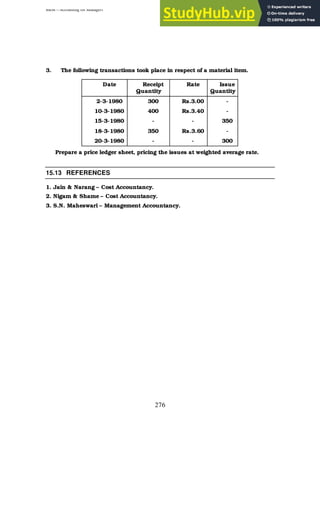
15.12 Points for Discussion
15.13 References](https://image.slidesharecdn.com/accountingformanagers-230807160536-33b54065/85/Accounting-for-Managers-pdf-255-320.jpg)


![BBM – Accounting for Managers
386
4. What are the essential requisites for successful implementation of a
budgetary control system?
5. Briefly explain the different classifications of budgets.
6. What is Z.B.B? Describe the process of preparing Z.B.B.
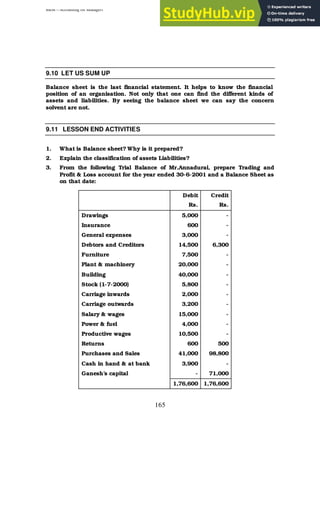
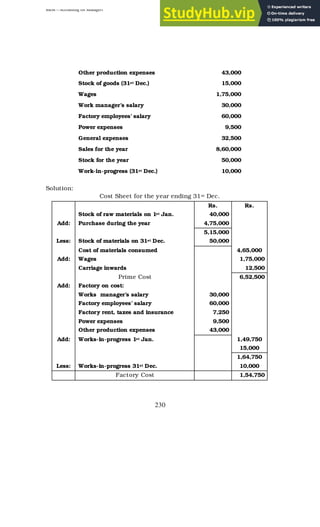
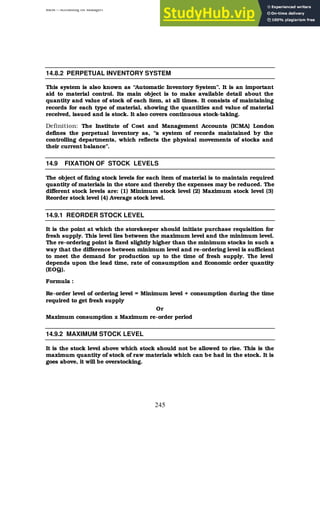
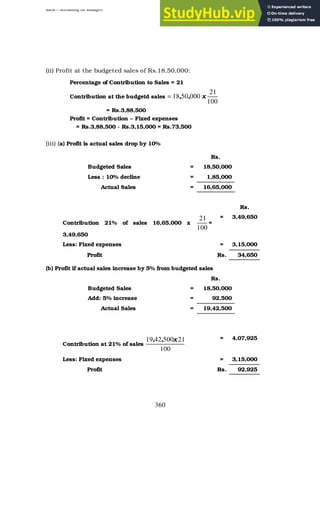
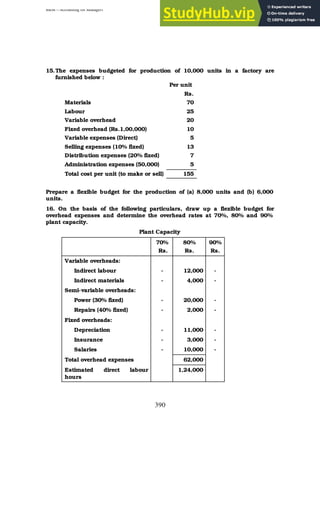
7 The following figures relating to product ‘Duper’ for the quarter ending
31.3.2001 are available:
Budgeted sales : January 3,00,000 units
February 2,40,000 units
March 3,60,000 units
Stock position : 1-1-2001 – 50% of January’s budgeted sales.
31.3.2001 – 80,000 units
31.1.2001 – 40% of February’s budgeted sales
28-2-2001 – 60% of March’s budgeted sales.
Your are required to prepare a production budget for the quarter ending
31.3.2001.
7. Prabu Engg. Co. Ltd. Manufactures 2 product X and Y. An estimate of the
number of units to be sold in the first 7 months of 2002 are given below:
Month X Y
Jan. 5,000 14,000
Feb. 6,000 14,000
Mar. 8,000 12,000
Apr. 10,000 10,000
May 12,000 8,000
June 12,000 8,000
July 10,000 9,000
It is anticipated that there will be no work-in-progress at the end of any month
and finished units are equal to half the anticipated sales for the next month will
be in stock at the end of each month (including Dec.2001). Your are required to
prepare a production budget showing the number of units to be manufactured
each month.
8. Draw a material procurement budget [quantitative] from the following
information Estimated sales of a product 40,000 units. Each unit of the
product requires 3 units of material A and 5 units of material B.](https://image.slidesharecdn.com/accountingformanagers-230807160536-33b54065/85/Accounting-for-Managers-pdf-386-320.jpg)

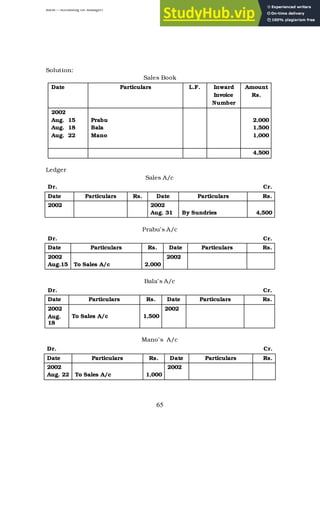
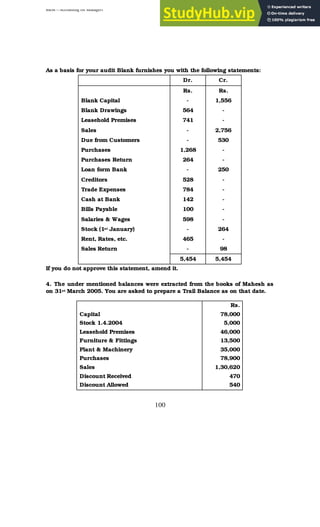
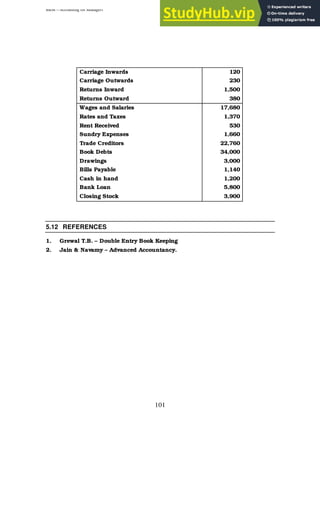
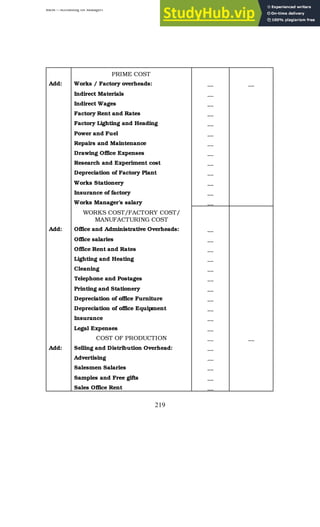
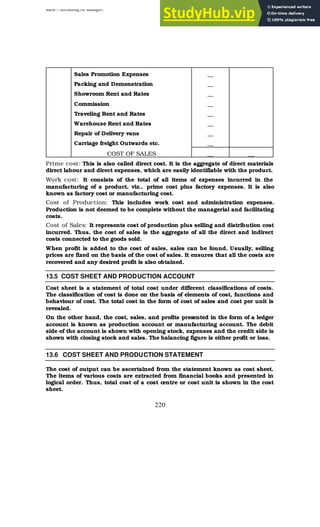
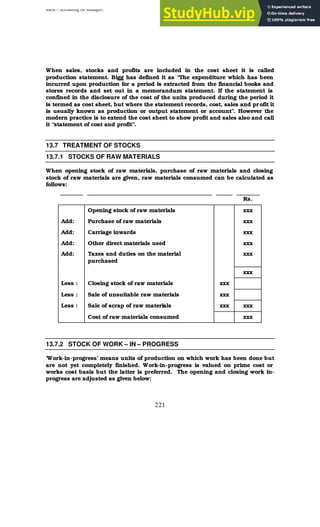
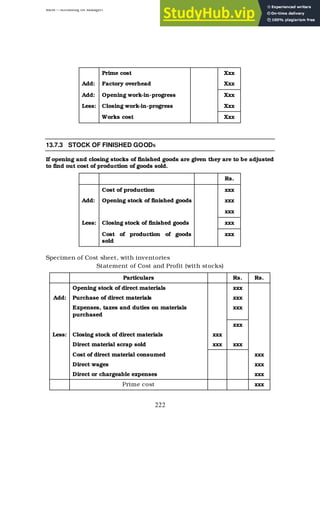
This document provides an overview of accounting concepts including: 1. The objectives of accounting are to keep systematic records, ascertain results of operations, and ascertain the financial position of a business. 2. Accounting functions include record keeping, assisting management decision making, and complying with legal requirements. 3. There are two main methods of accounting - single entry and double entry systems. Double entry allows for the preparation of trial balances and financial statements.