Downloaded 60 times

![This watermark does not appear in the registered version - http://www.clicktoconvert.com
68
Check your progress 5
List out any three features of trial balance
Notes: (a) Write your answer in the space given below.
(b) Check your answer with the ones given at the end of this Lesson
(pp. ___ ).
…………………………………………………………………………
…………………………………………………………………………
…………………………………………………………………………
…………………………………………………………………………
…………………………………………………………………………
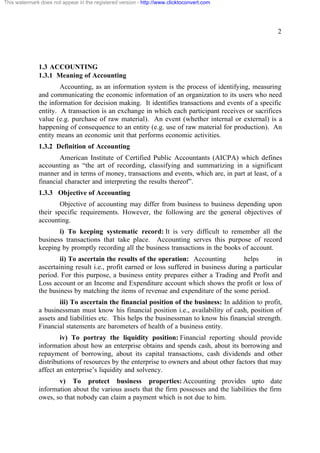
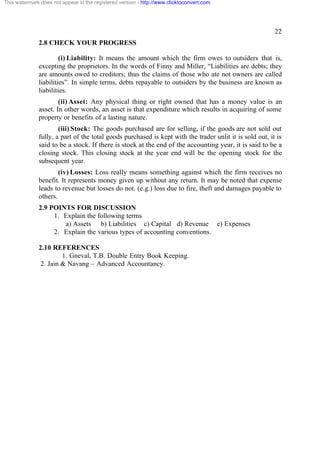
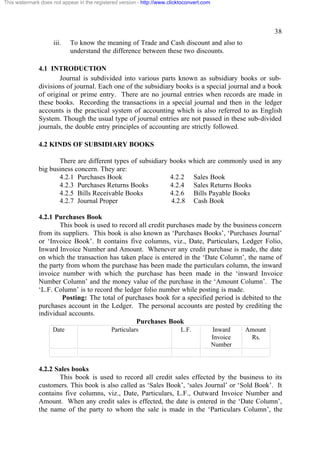
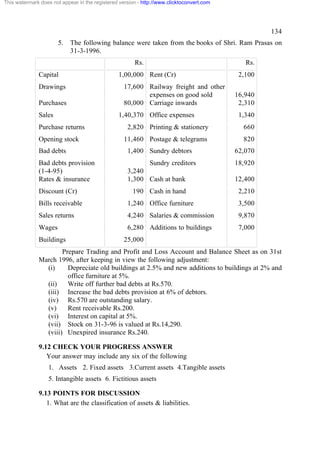
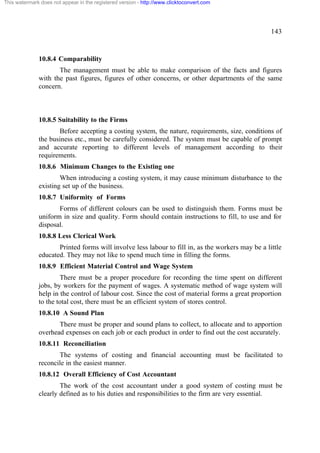
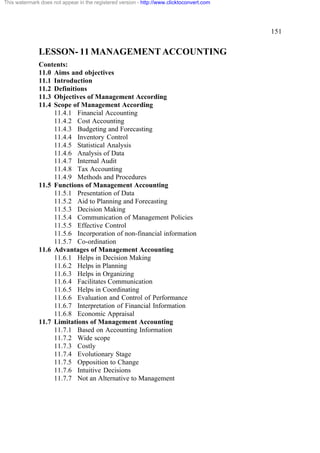
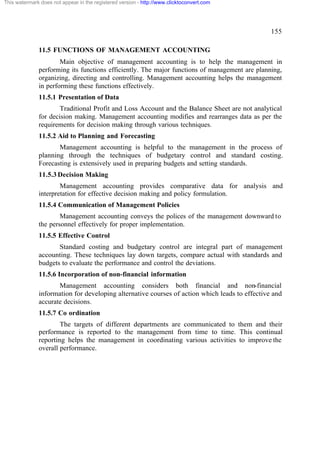
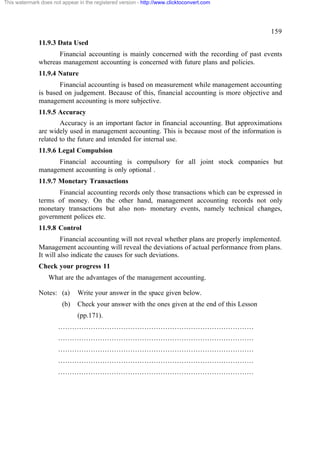
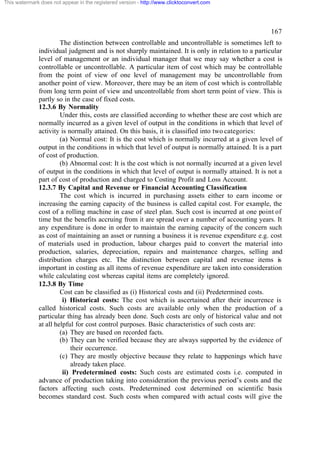
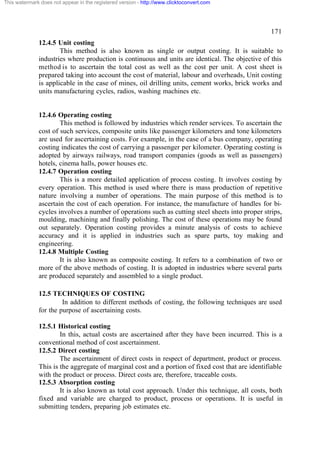
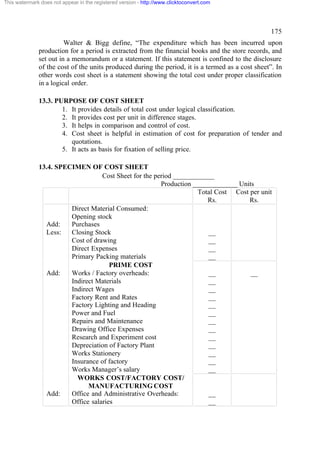
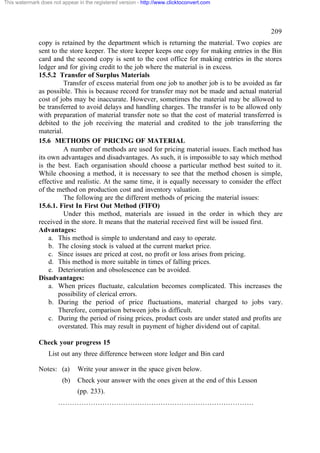
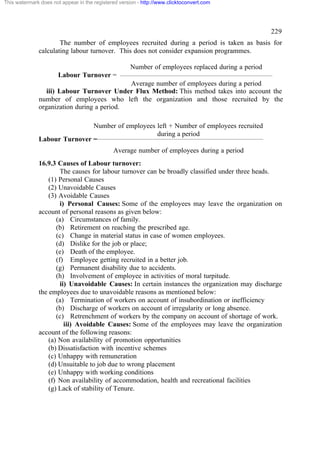
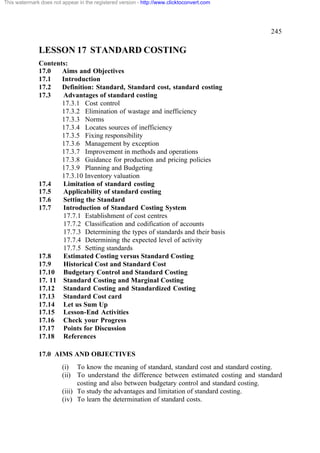
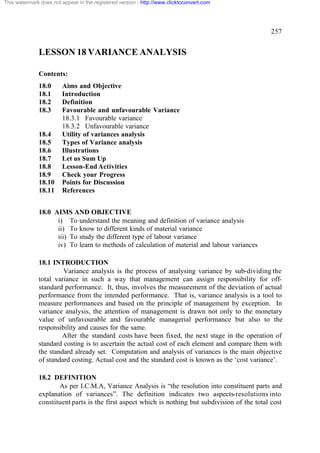
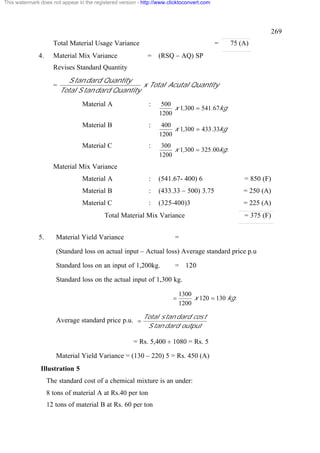
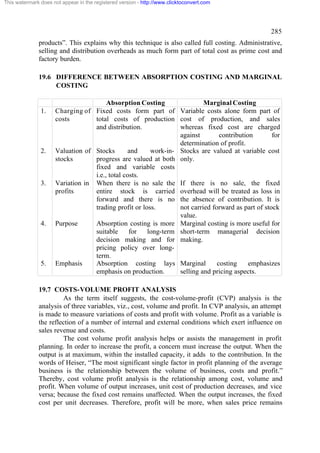
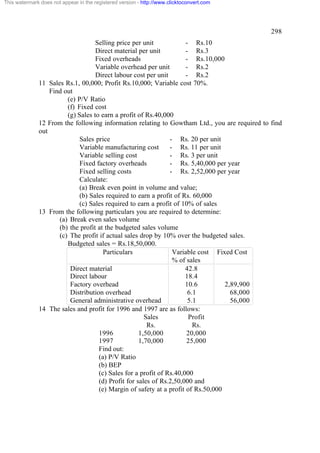
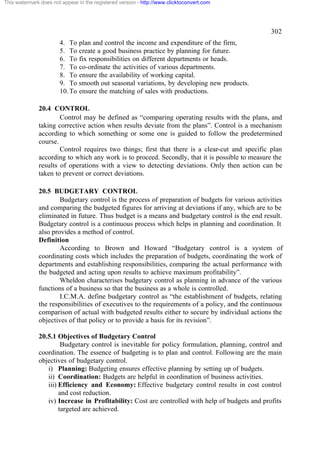
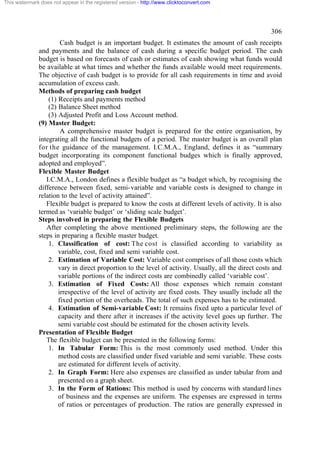
5.7 ILLUSTRATIONS
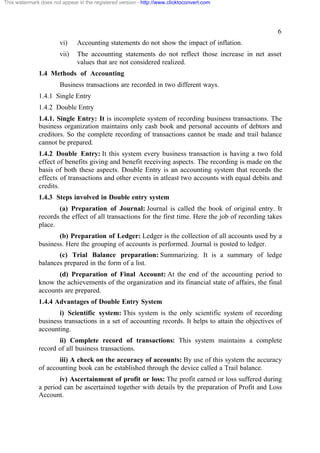
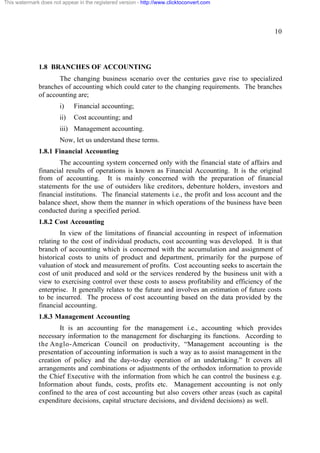
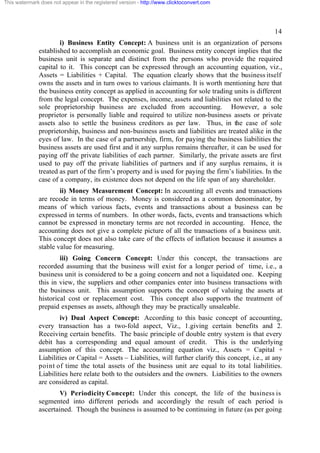
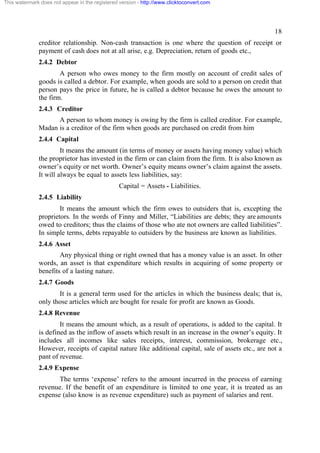
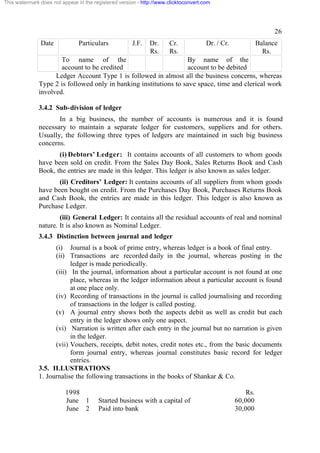
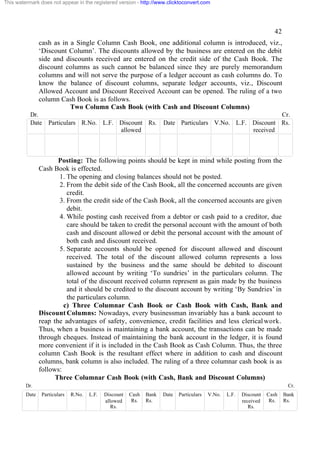
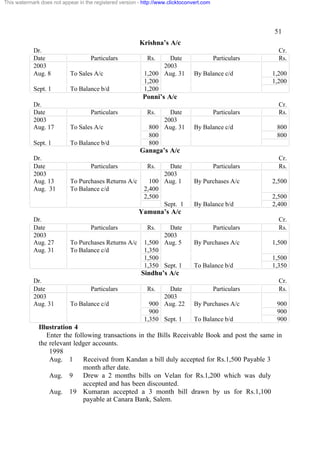
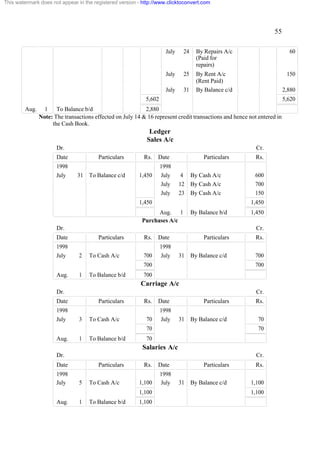
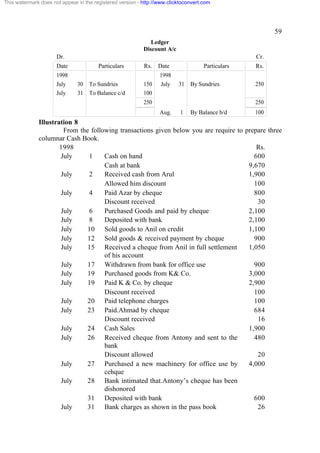
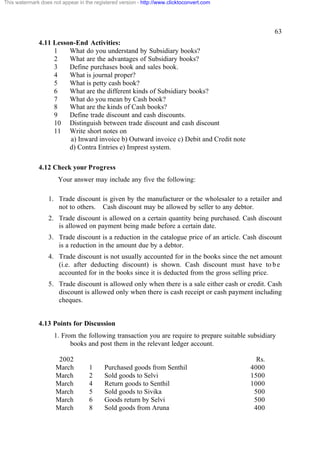
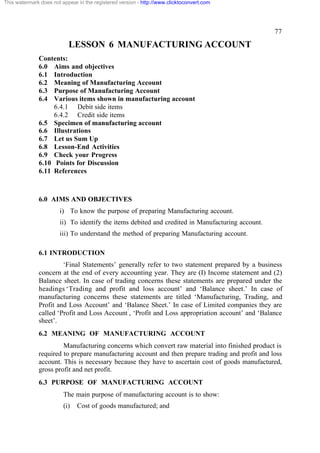
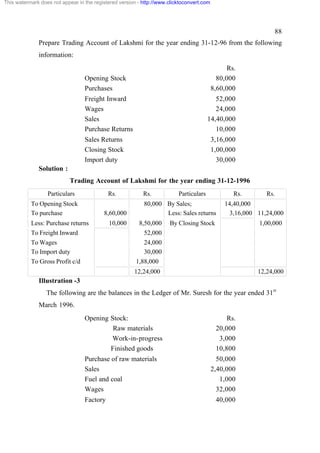
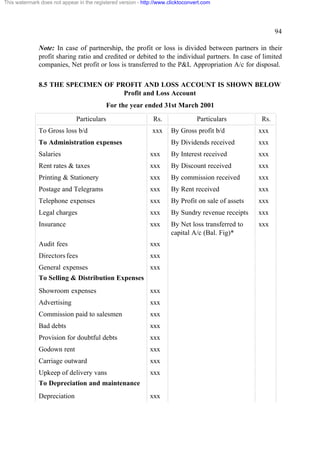
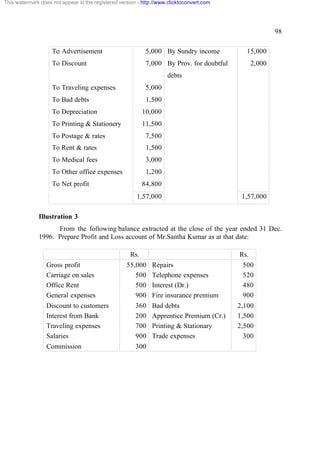
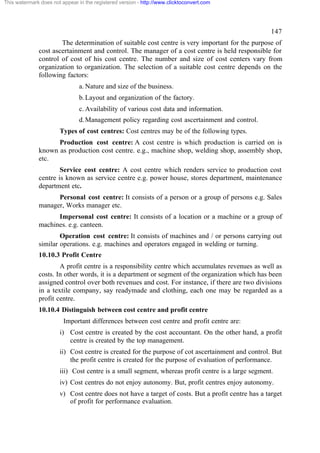
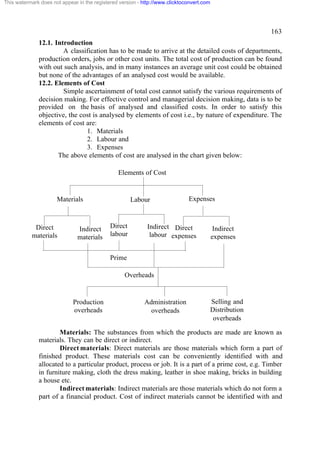
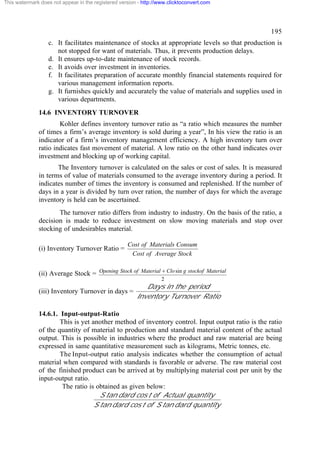
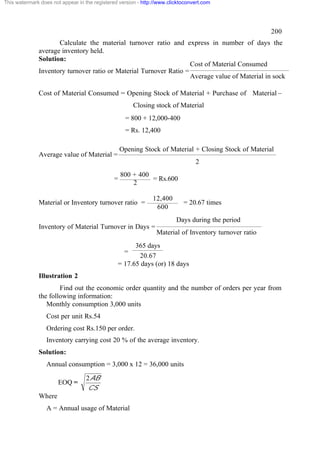
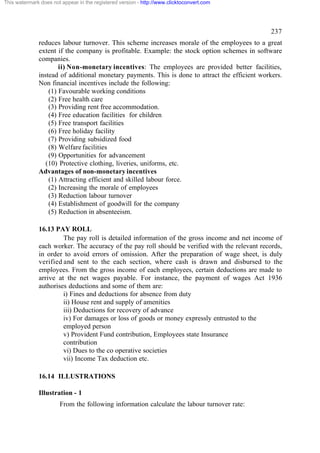
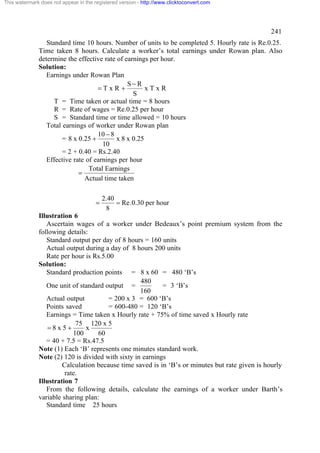
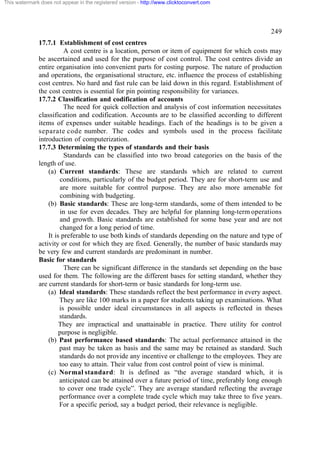
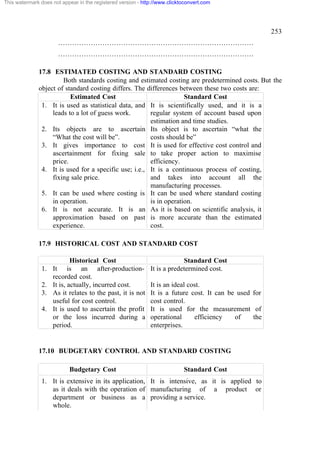
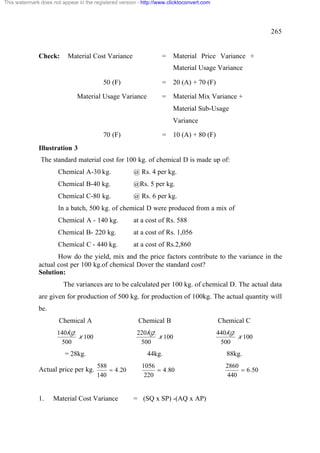
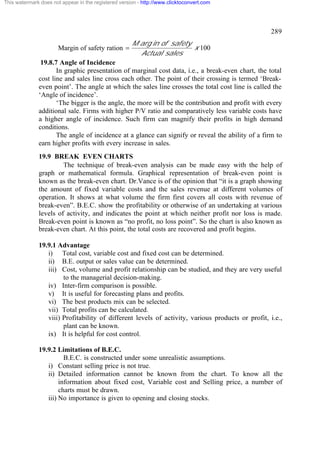
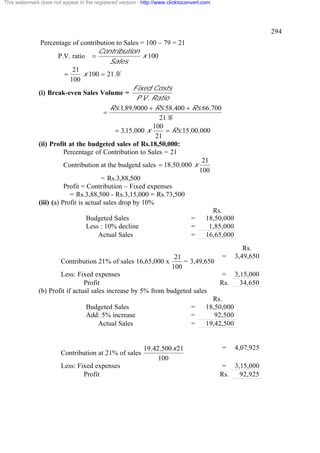
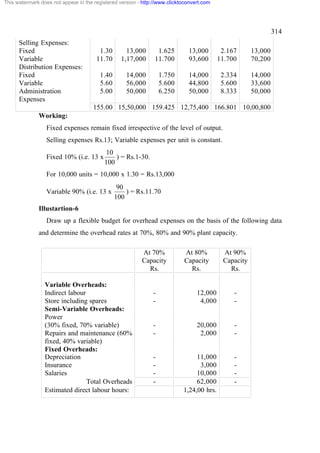
Illustration 1
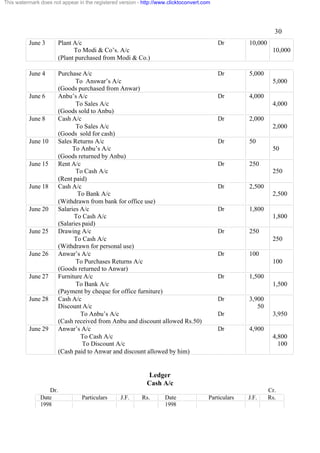
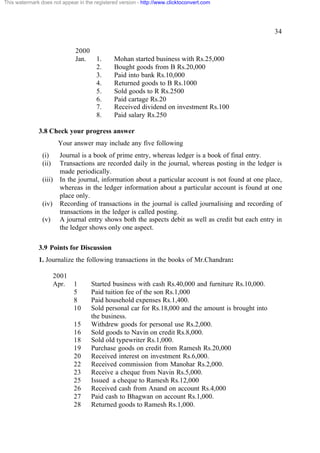
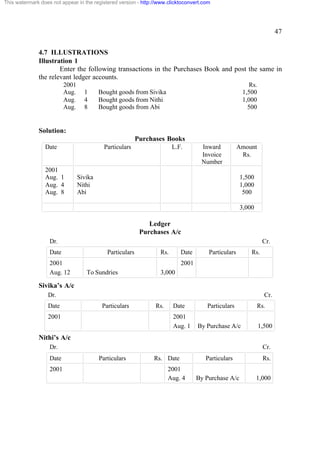
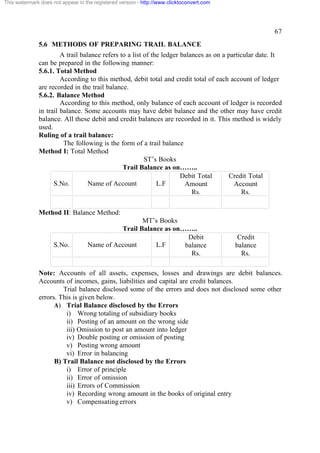
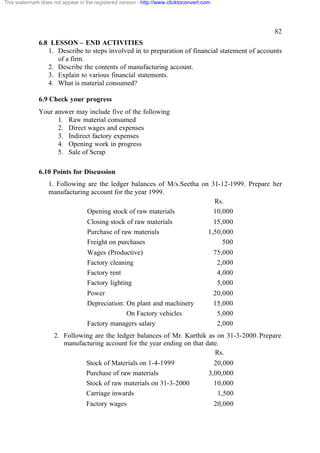
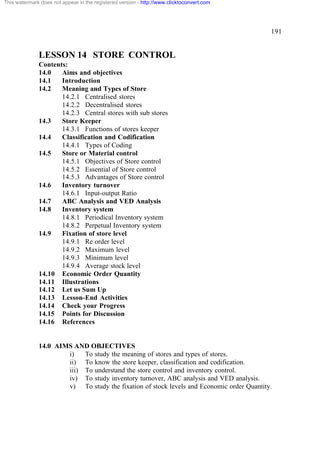
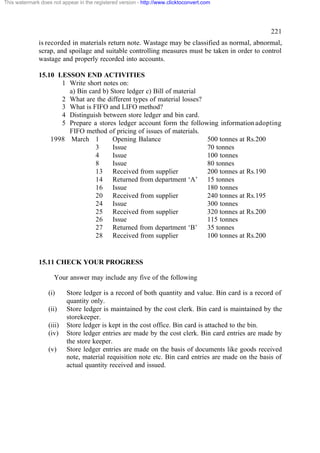
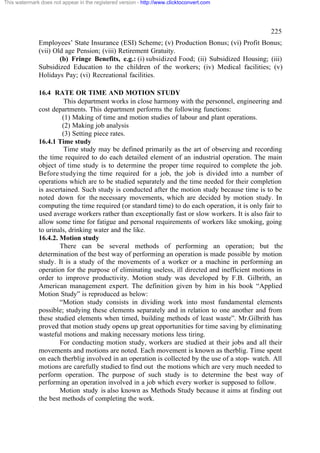
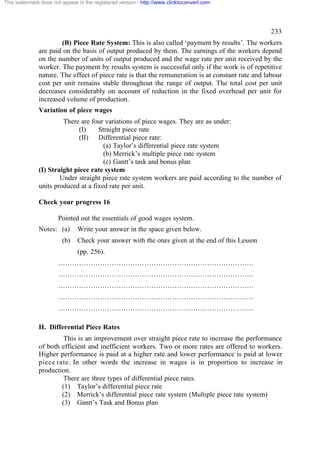
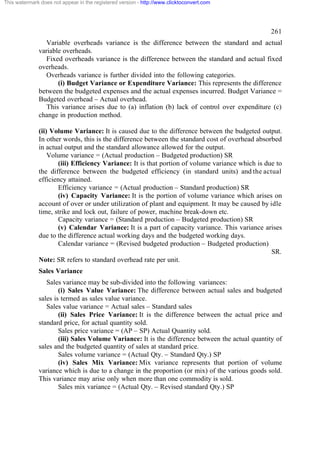
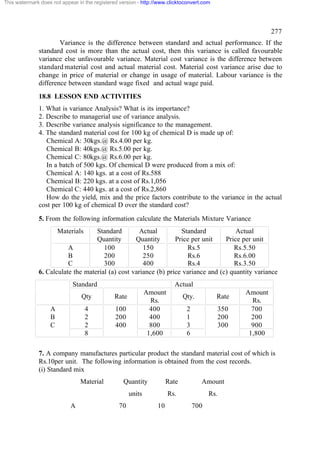
From the following transactions, pass journal entries, prepare ledger accounts
and also prepare Trial Balance under (i) Balance method (ii) Total method.
Rs.
1. Anil started business with 8,000
2. Purchased furniture 1,000
3. Purchased goods 6,000
4. Sold goods 7,000
5. Purchased from Raja 4,000
6. Sold to Somu 5,000
7. Paid to Raja 2,500
8. Received from Somu 3,000
9. Paid rent 200
10. Received commission 100
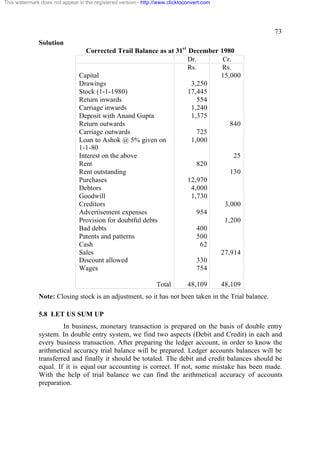
Solution
Journal Entries
Particulars L.F Dr. Cr.
Cash A/c Dr. 8,000 8,000
To Capital A/c
[Started business]
Furniture A/c Dr. 1,000
To Cash A/c 1,000
[Purchased furniture]
Purchases A/c Dr. 6,000
6,000
To Cash A/c
[Purchased goods]
Cash A/c Dr. 7,000
To Sales A/c 7,000
[Sold goods for cash]](https://image.slidesharecdn.com/bbmaccount-111016045217-phpapp01/85/Bbm-account-69-320.jpg)
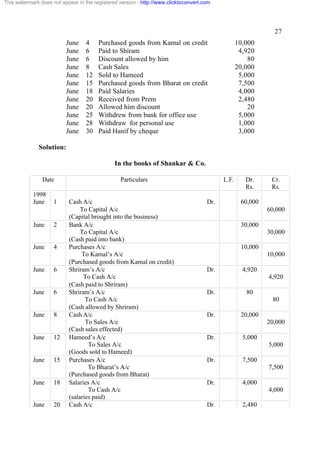
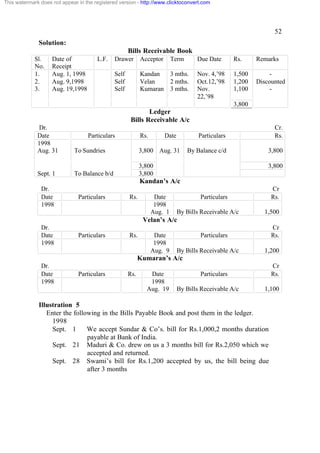
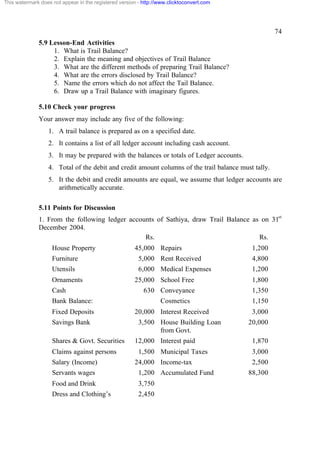
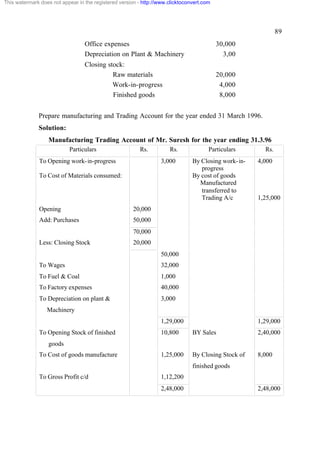
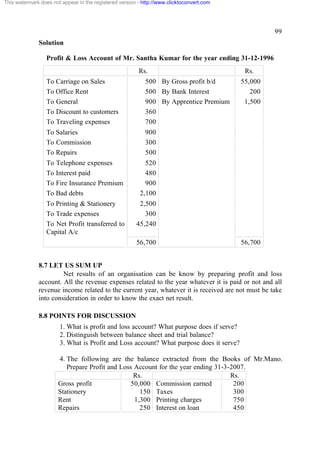
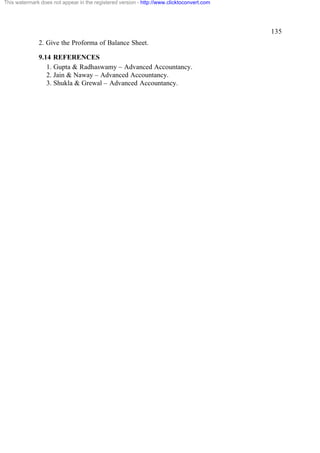
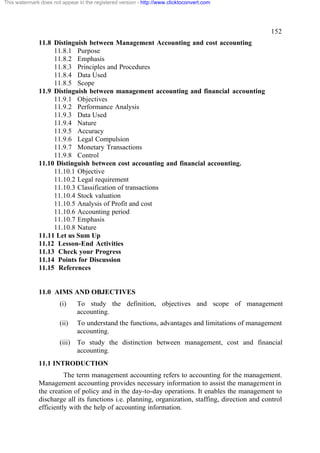
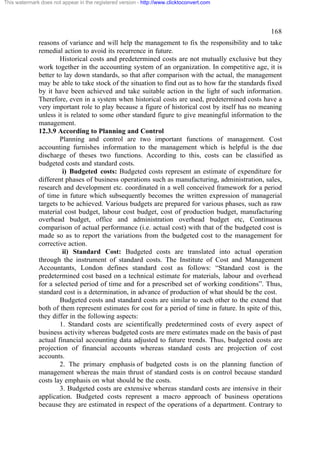
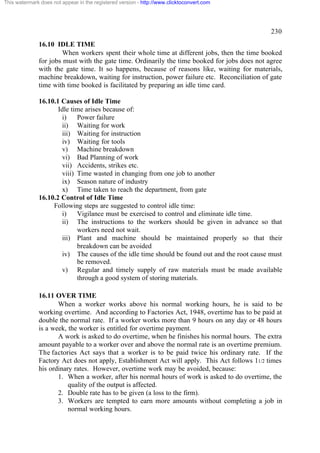
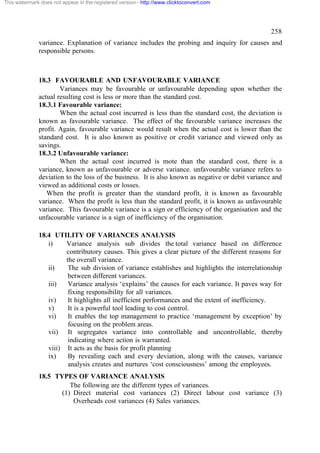
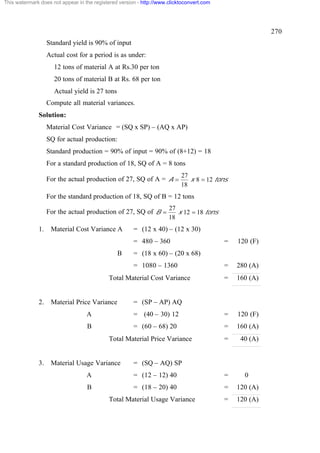
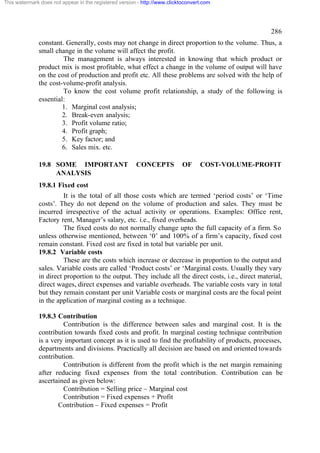
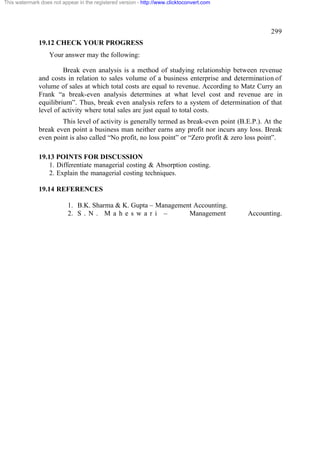
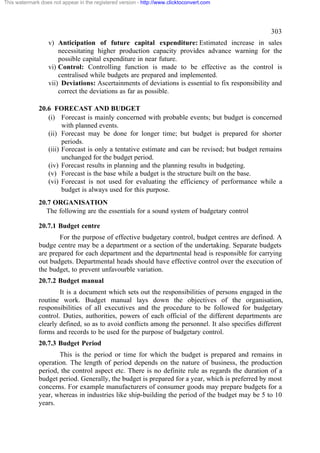
![This watermark does not appear in the registered version - http://www.clicktoconvert.com
69
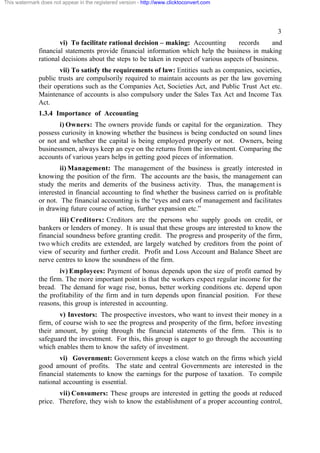
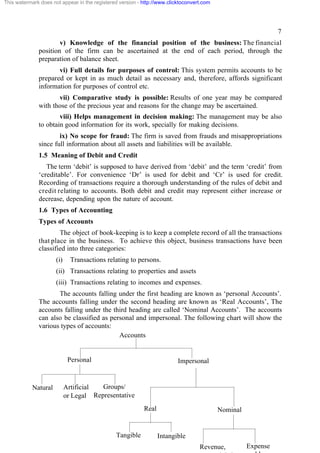
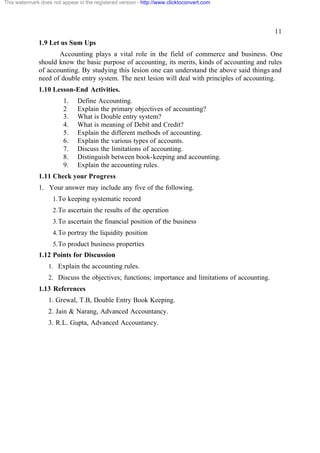
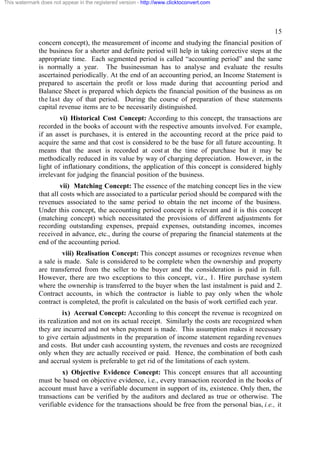
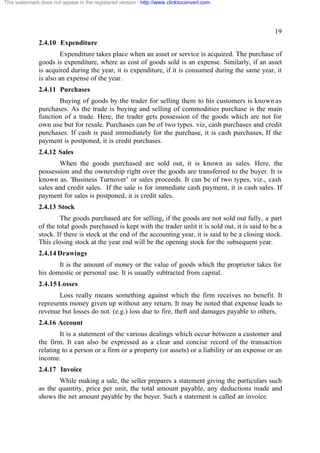
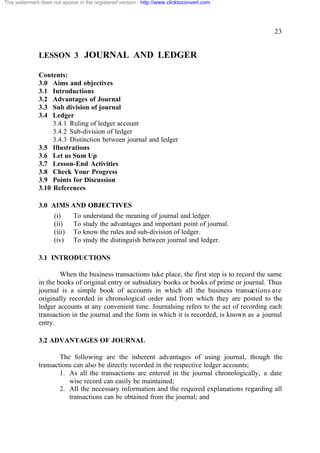
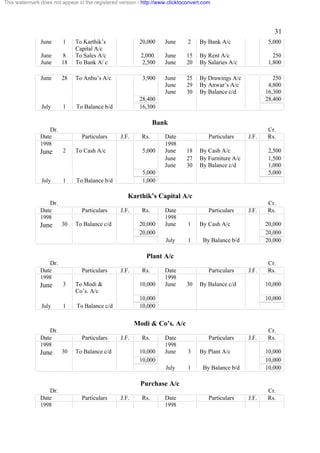
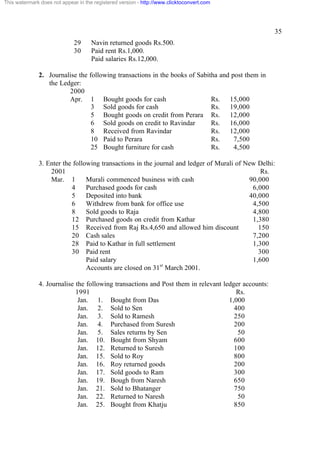
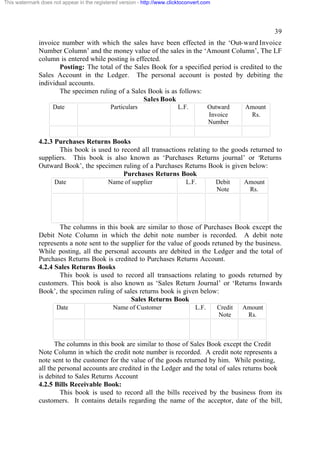
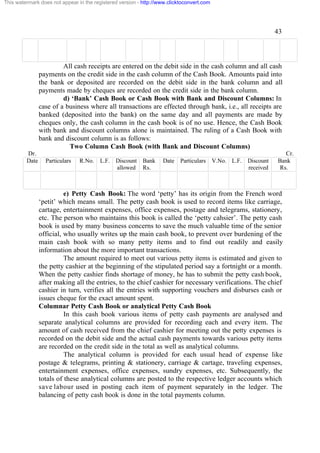
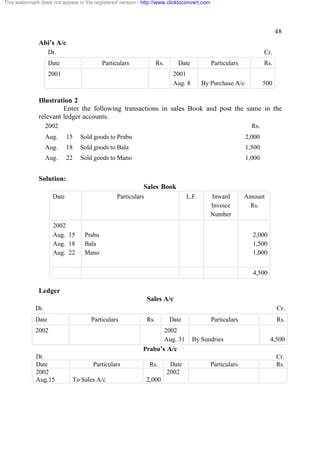
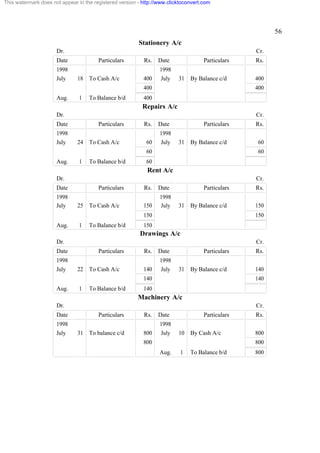
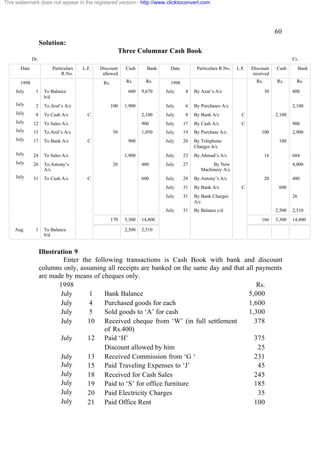
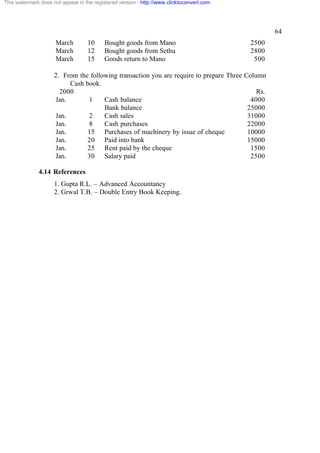
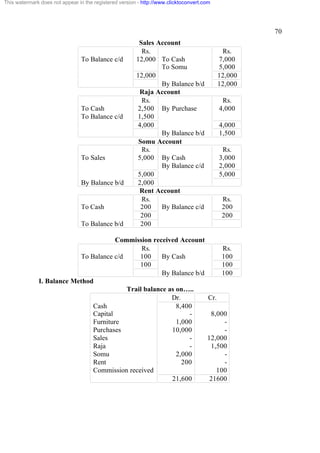
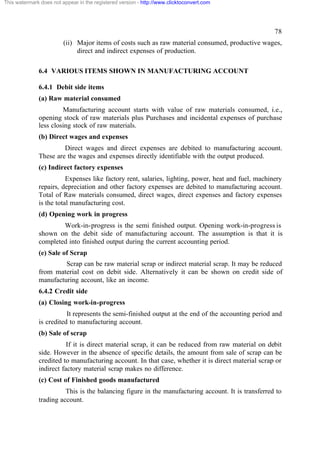
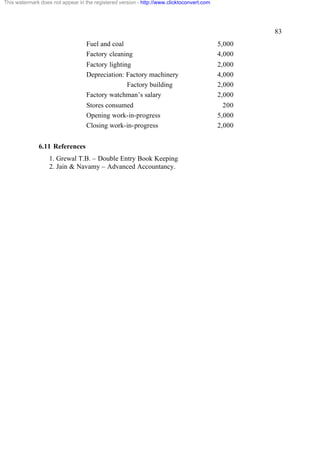
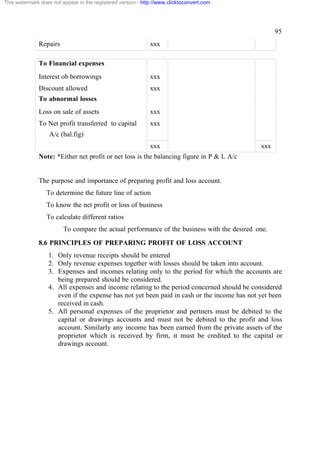
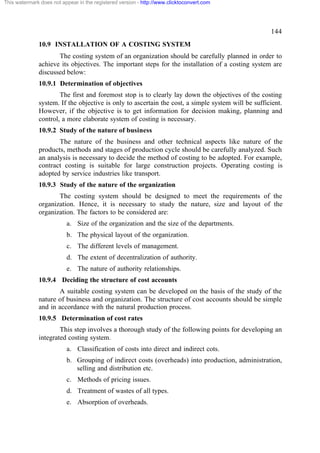
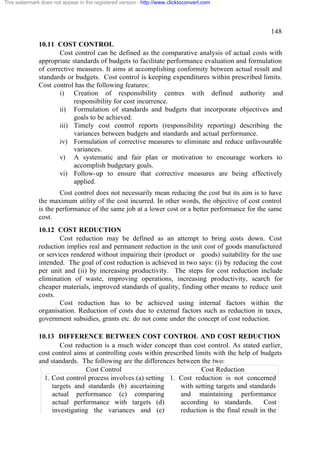
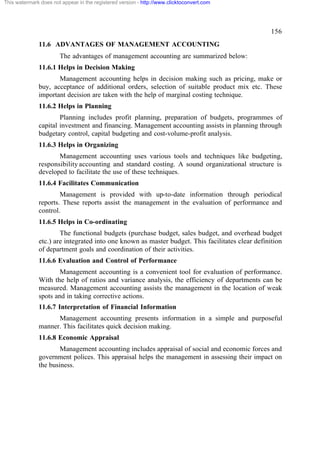
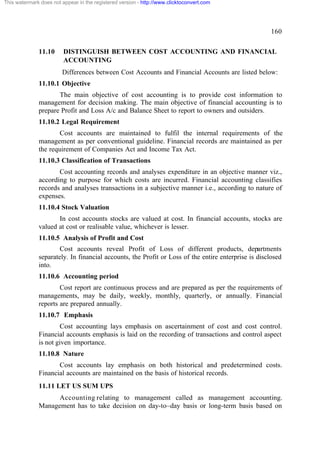
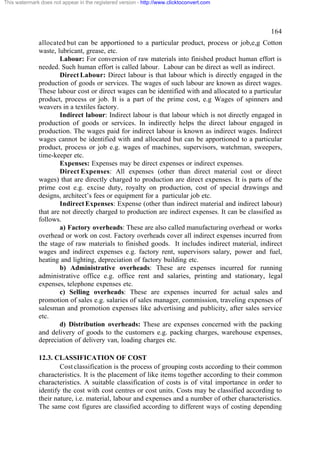
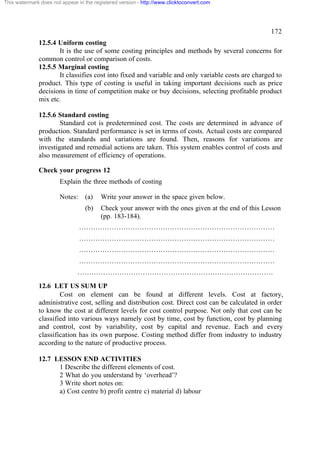
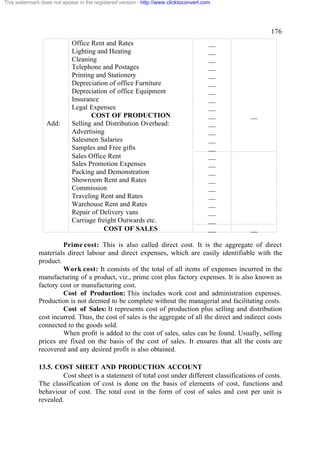
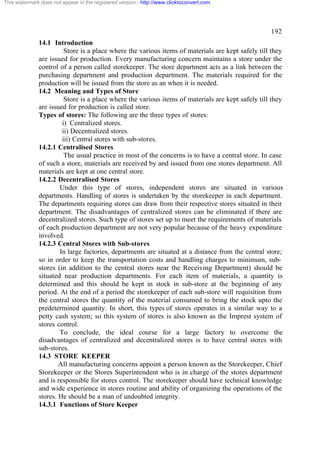
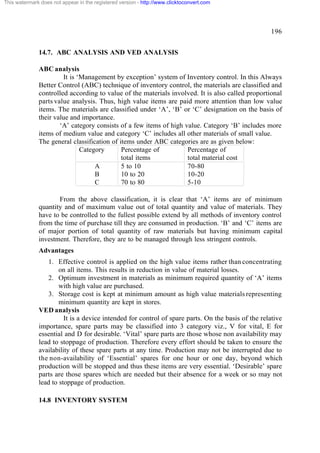
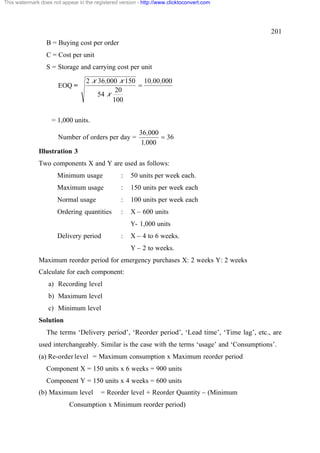
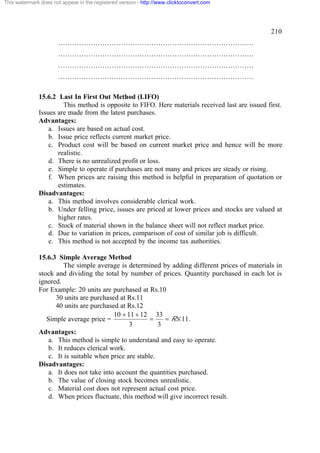
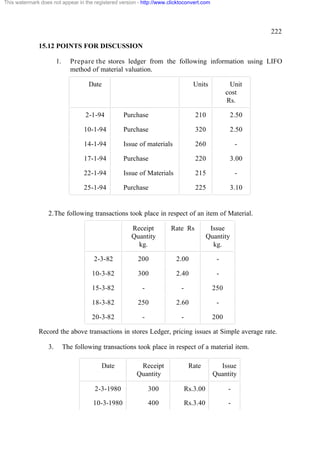
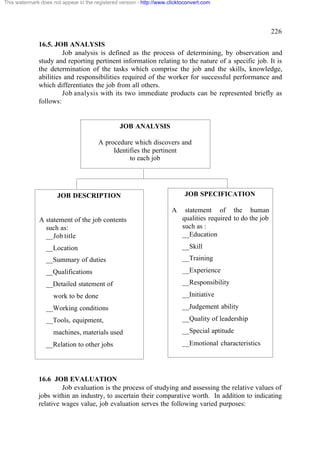
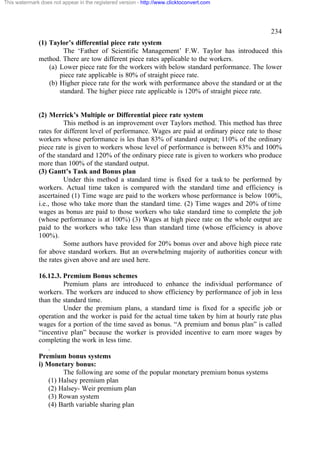
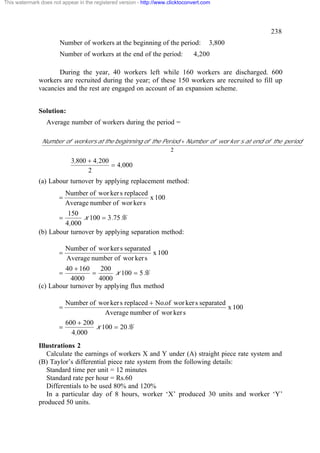
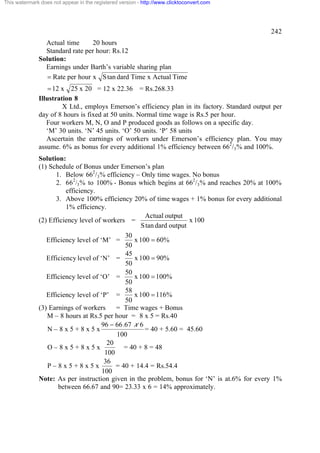
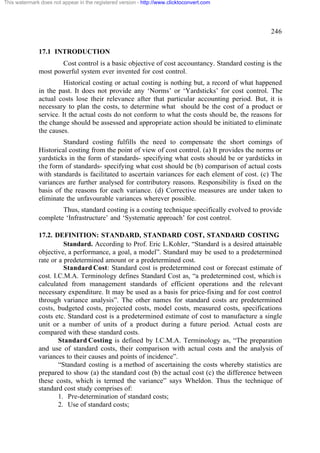
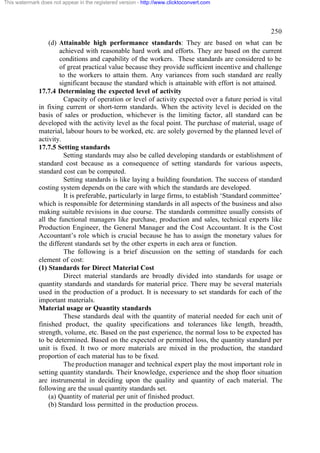
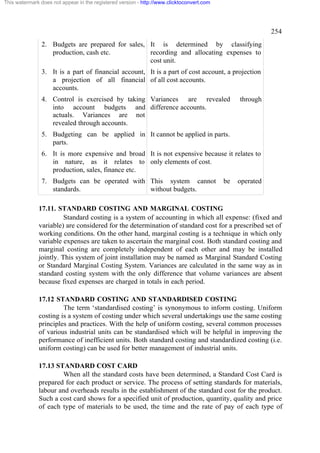
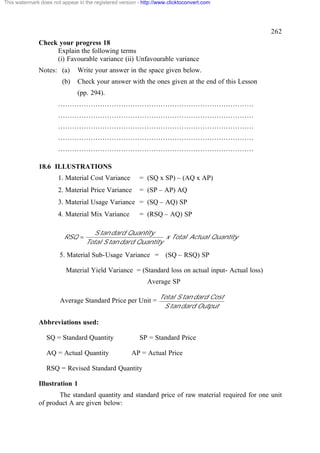
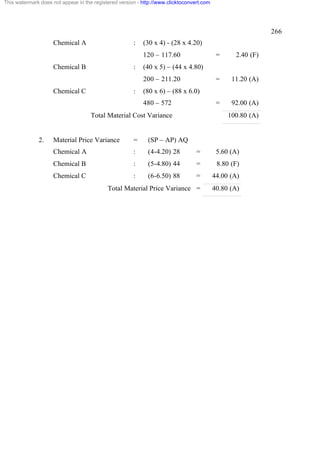
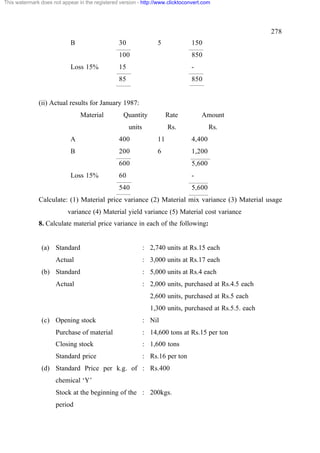
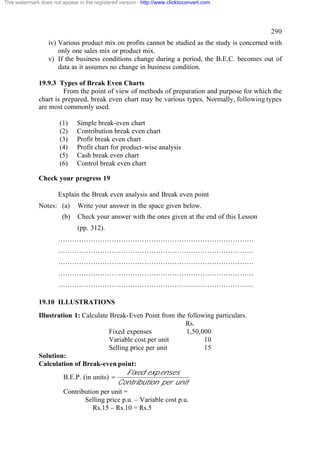
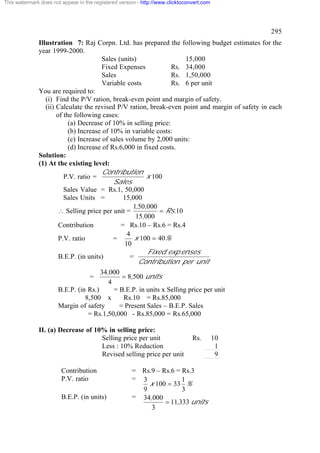
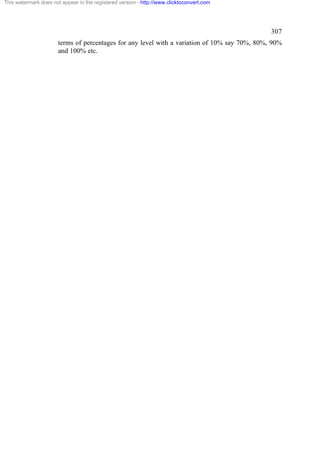
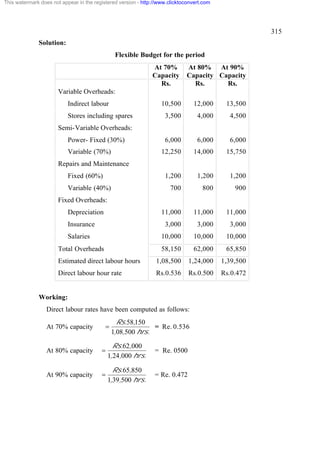
Purchases A/c Dr. 4,000
4,000
To Raja A/c
[Purchased goods]
Somu A/c Dr. 5,000
5,000
To Sales A/c
[Sold goods on credit]
Raja A/c Dr. 2,500
To Cash A/c 2,500
[Paid cash]
Cash A/c Dr. 3,000
To Somu A/c 3,000
[Received from Somu]
Rent A/c Dr. 200
To Cash A/c 200
[Paid rent]
Cash A/c Dr. 100
To Commission received A/c 100
[Received commission]
Cash Account
Rs. Rs.
To Capital 8,000 By Furniture 1,000
To Sales 7,000 By Purchases 6,000
To Somu 3,000 By Raja 2,500
To Commission 100 By Rent 200
By Balance c/d 8,400
18,100 18,100
To Balance b/d 8,400
Capital Account
Rs. Rs.
To Balance c/d 8,000 By Cash 8,000
8,000 8,000
By Balance b/d 8,000
Furniture Account
Rs. Rs.
To Cash 1,000 By Balance c/d 1,000
1,000 1,000
By Balance b/d 1,000
Purchase Account
Rs. Rs.
To Cash 6,000 By Balance c/d 10,000
To Raja 4,000
10,000 10,000
To Balance b/d 10,000](https://image.slidesharecdn.com/bbmaccount-111016045217-phpapp01/85/Bbm-account-70-320.jpg)

![This watermark does not appear in the registered version - http://www.clicktoconvert.com
85
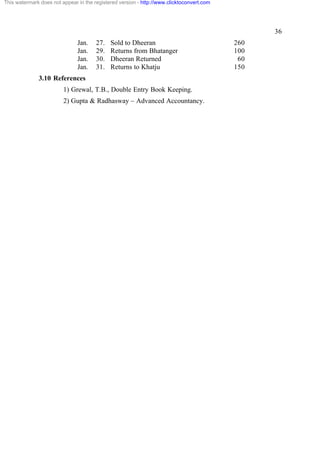
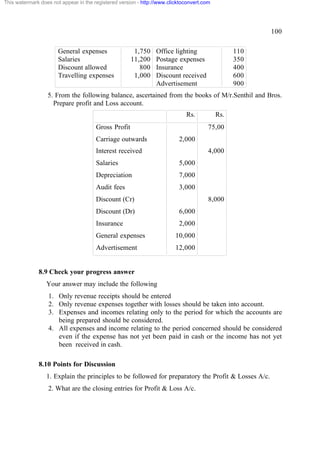
ii) Purchases: The total value of goods purchased after deducting purchase
returns is debited to trading a/c. Purchases comprise of cash purchases am credit
purchases.
iii) Direct expenses: Direct expenses are incurred to make the goods sale
able. They include wages, carriage and freight on purchases, import duty, customs
duty, clearing and forwarding charges manufacturing expenses or factor. Expenses
(where manufacturing account is not separately prepared). All direct expenses are
extracted from trial balance.
7.2.2 Items shown in trading account :(B) Credit side:
i) Sales: It includes both credit and cash sales. Sales returns are reduced from
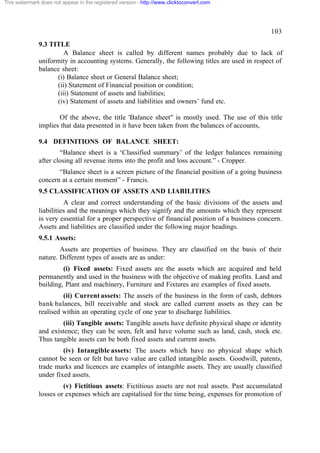
sales and net sales are shown on the credit side of trading account. The sales and
returns are extracted from the trial balance.
ii) Closing stock: Closing stock is the value of goods remaining at the end of
the accounting period. It includes closing stock of raw materials, work progress
(where manufacturing account is not separately prepared) and finished stock. The
opening stock is ascertained from trial balance but closing stock is not a part of ledger.
It is separately valued and given as an adjustment. If it is given in trial balance, it is
after adjustment of opening and closing stocks in purchases. If closing stock is given
in trial balance it is shown only as current asset in balance sheet. If closing stock is
given outside trial balance, it is shown on credit side of trading account and also as
current asset in the balance sheet
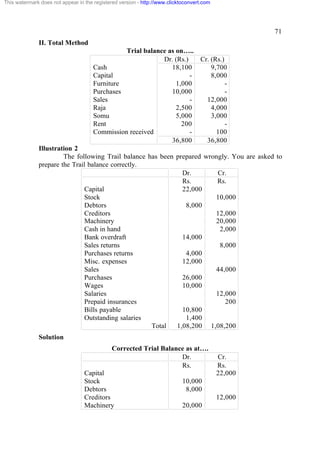
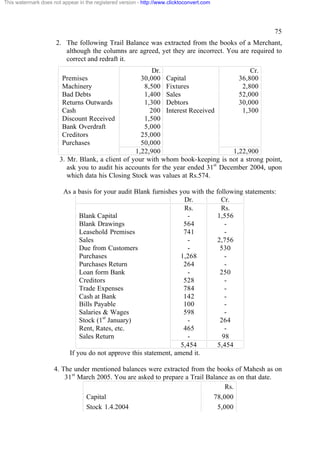
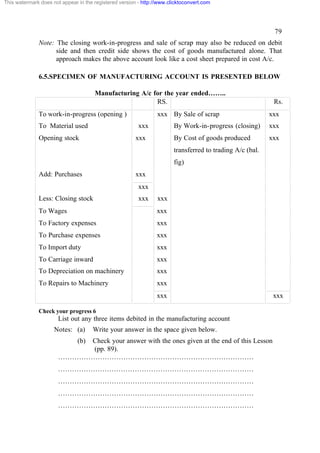
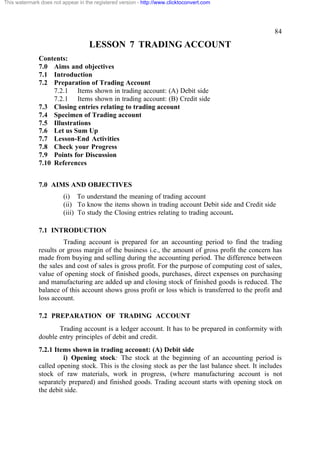
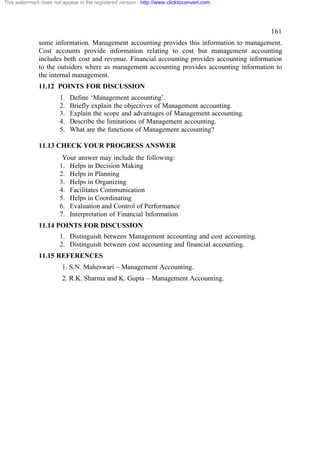
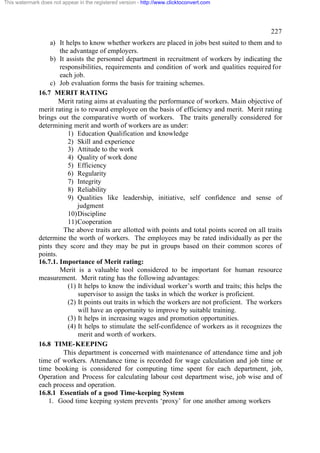
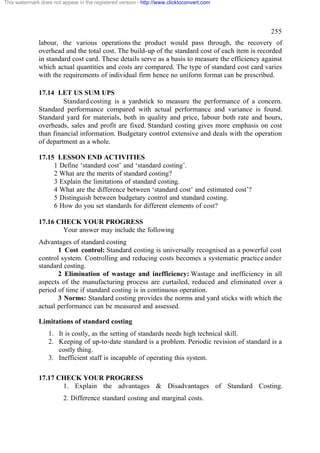
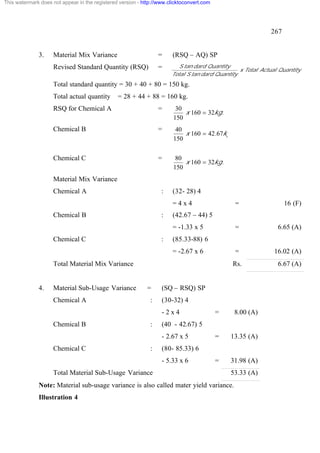
7.3 CLOSING ENTRIES RELATING TO TRADING ACCOUNT
The Journal entries given below are passed to transfer the relevant ledger
account balances to trading account.
(i) For opening stock, purchases and direct expenses.
Trading A/c Dr xxx
To Opening Stock A/c xxx
To Purchases (Net) A/c xxx
To Direct expenses A/c xxx
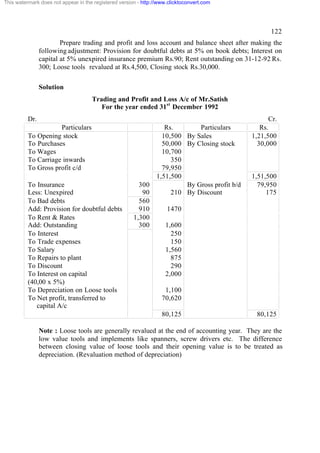
[Being transfer of trading a/c debit
side items]
(ii) For transfer of sales (after reducing sales returns)
Sales (net) A/c Dr xxx
To Trading A/c xxx
[Being transfer of sales to Trading A/c]](https://image.slidesharecdn.com/bbmaccount-111016045217-phpapp01/85/Bbm-account-86-320.jpg)
![This watermark does not appear in the registered version - http://www.clicktoconvert.com
86
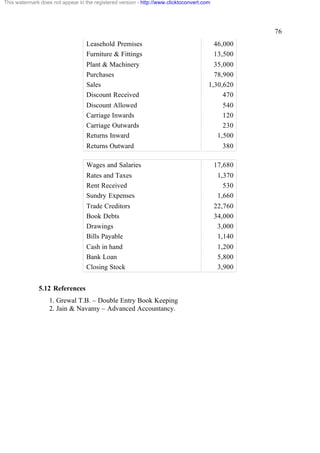
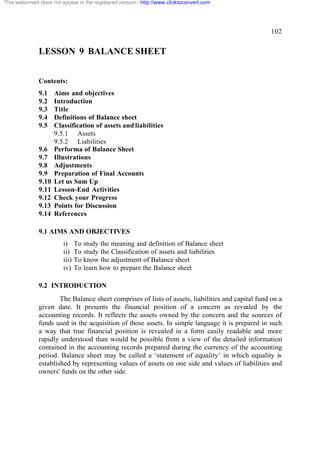
(iii) For transferring gross profit
Trading A/c Dr xxx
To Profit & Loss A/c xxx
[Being transfer of gross profit to P&L A/c]
(iv) For Gross Loss
Profit & Loss A/c Dr xxx
To Trading A/c xxx
[Being transfer of gross loss to P&L A/c]
Note: Closing stock is taken into account by an adjustment journal entry along with
other adjustments.
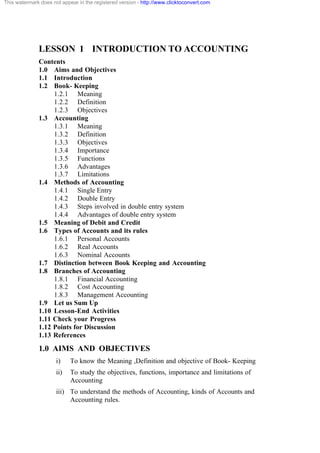
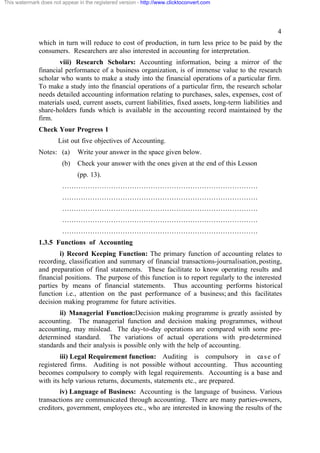
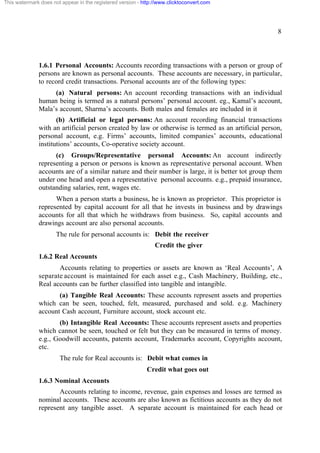
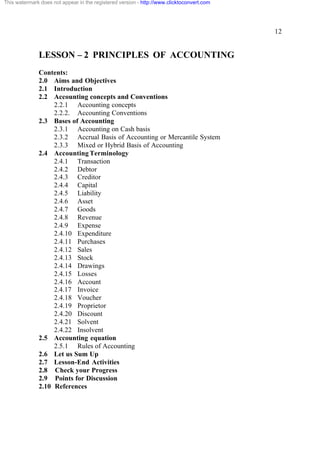
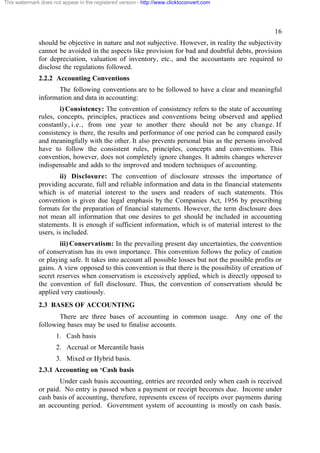
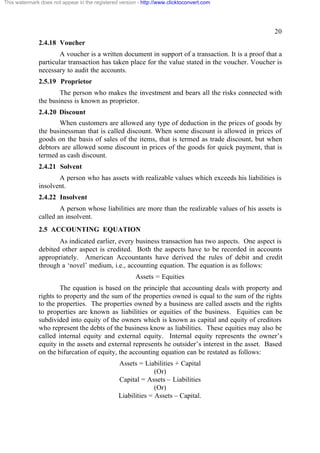
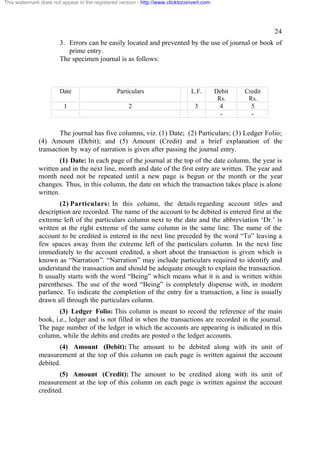
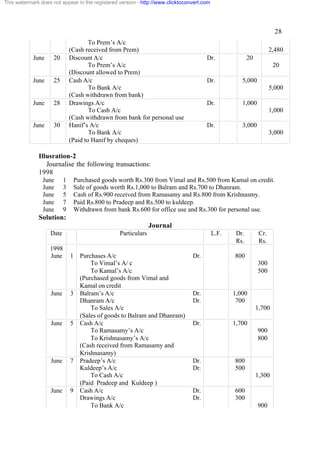
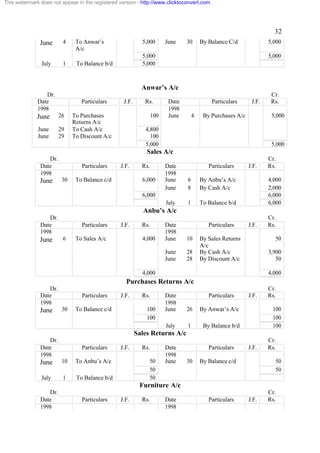
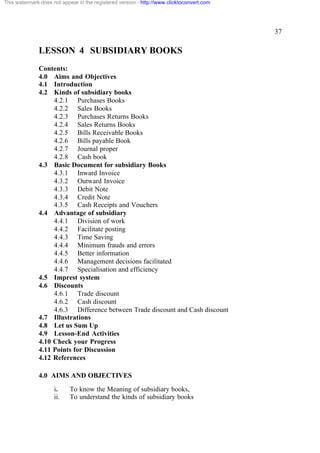
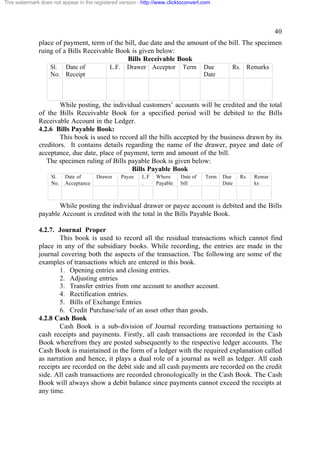
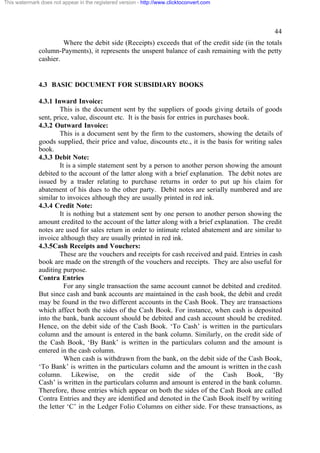
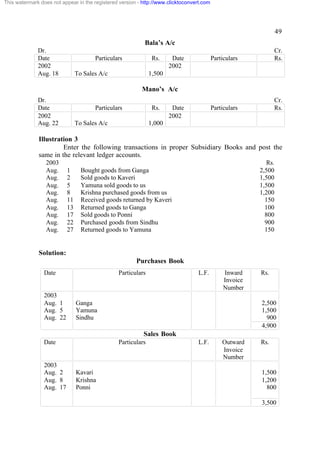
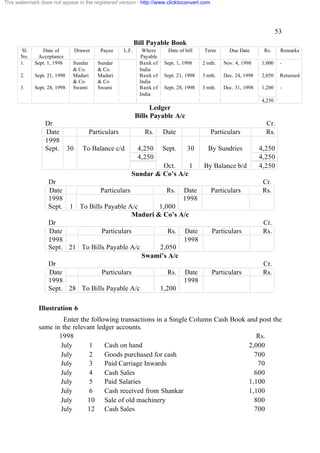
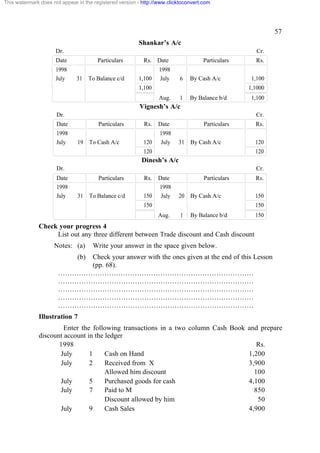
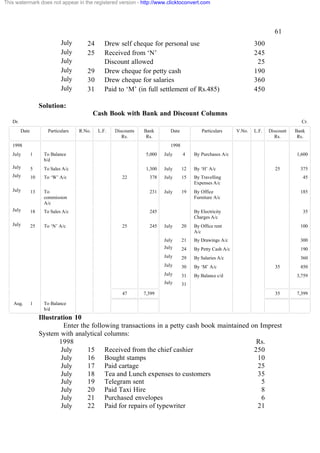
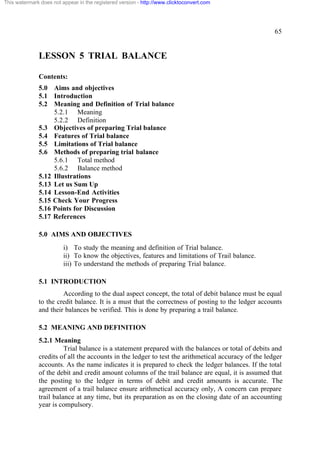
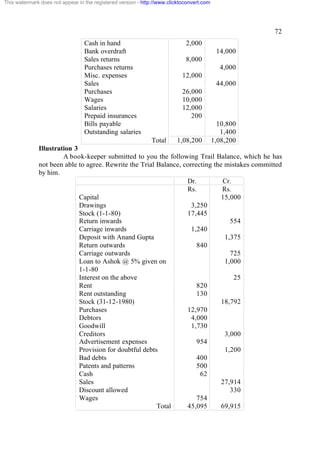
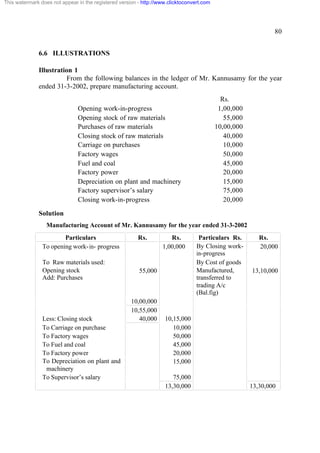
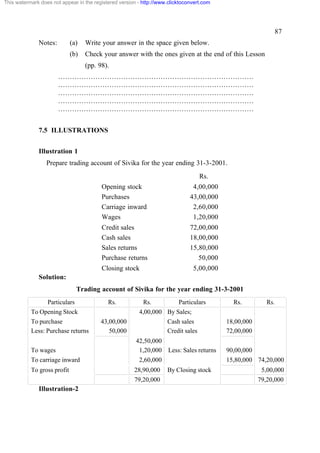
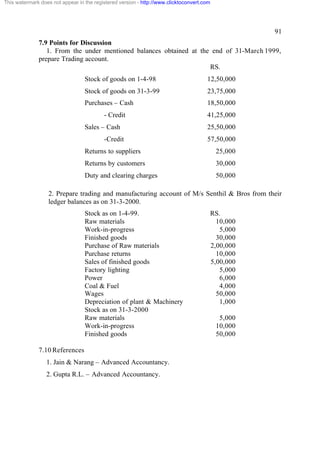
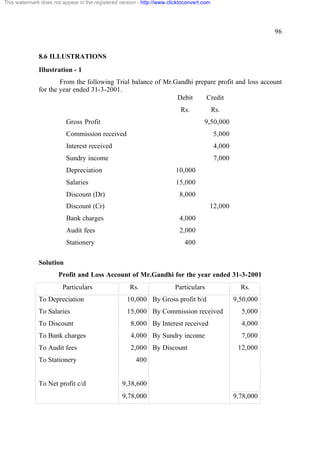
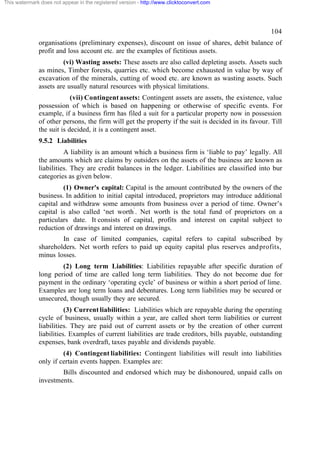
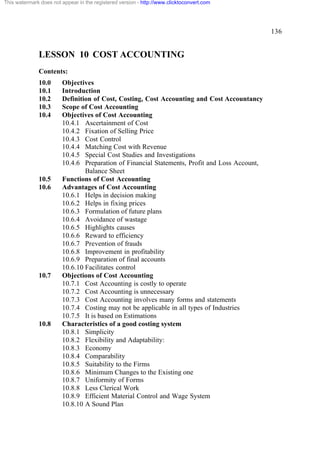
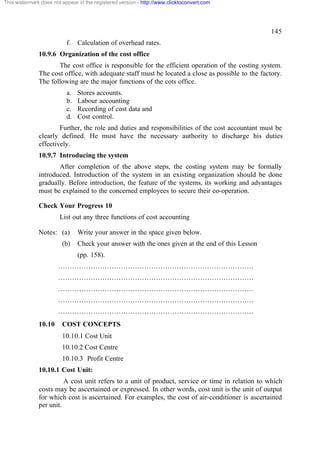
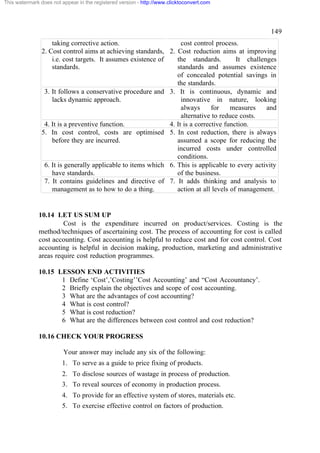
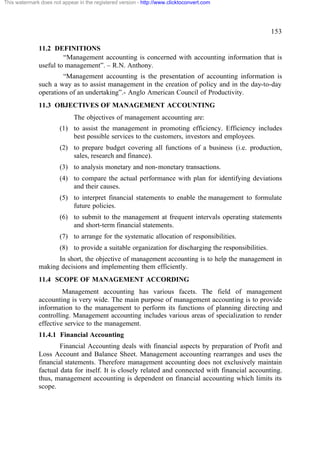
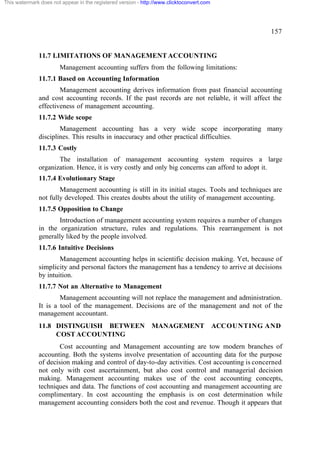
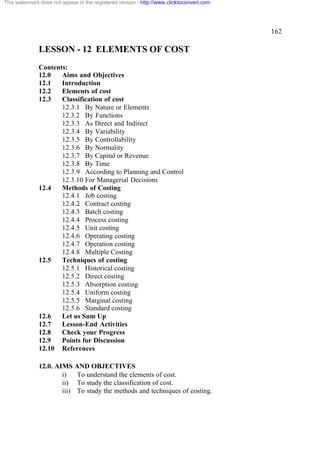
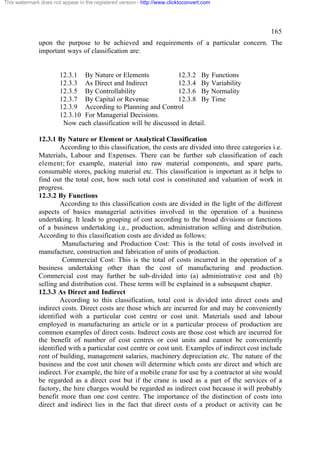
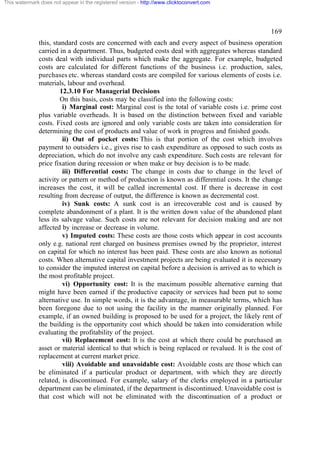
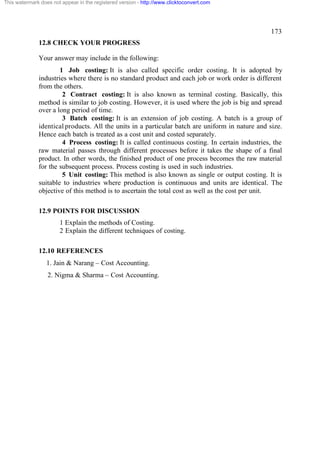
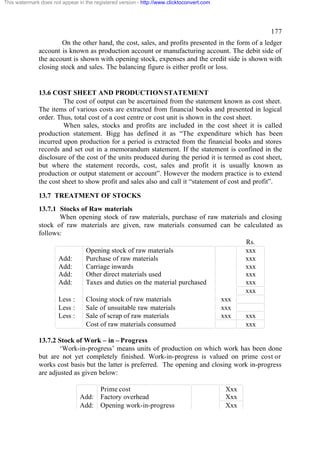
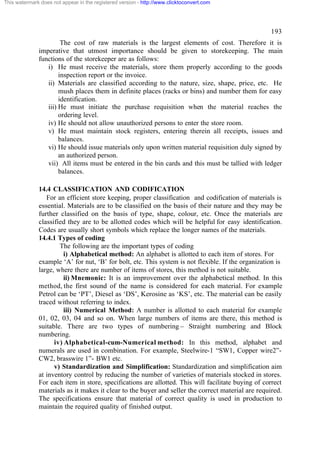
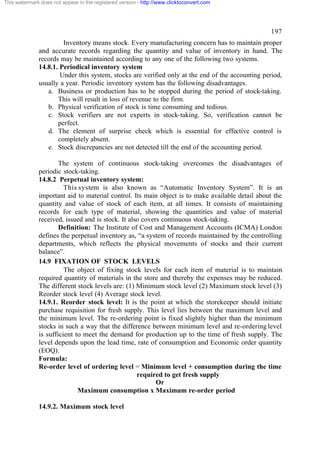
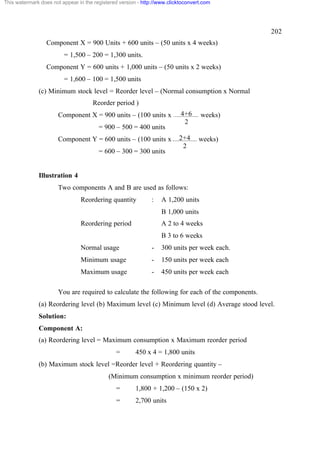
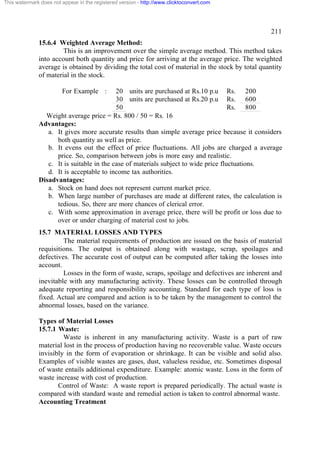
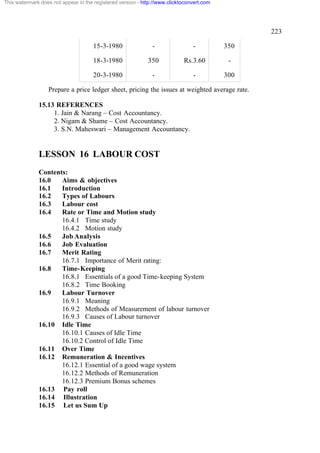
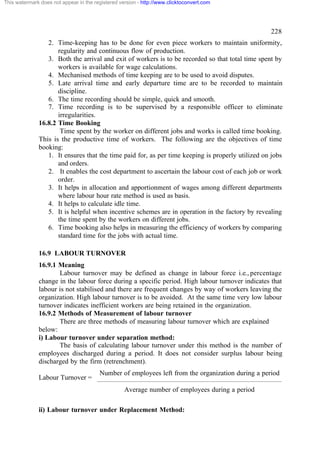
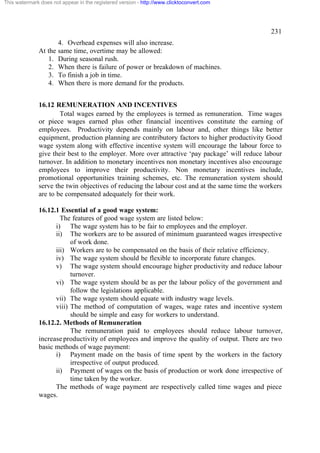
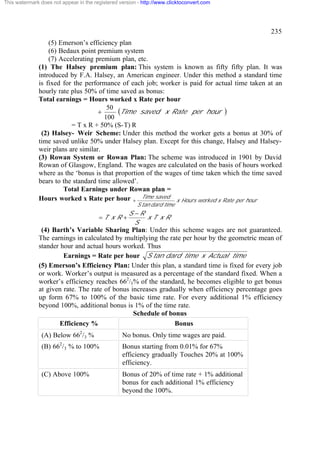
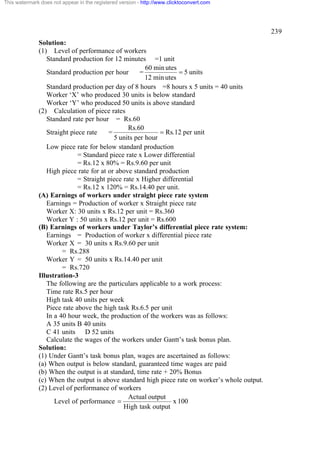
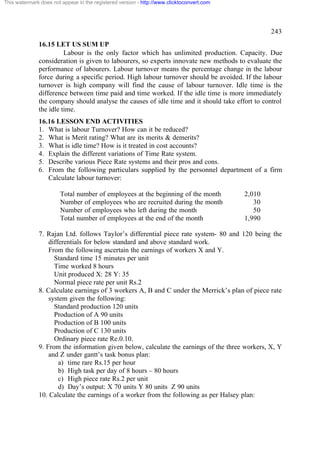
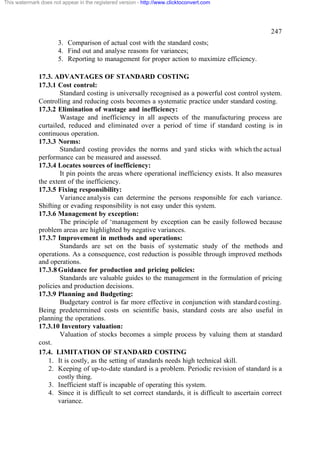
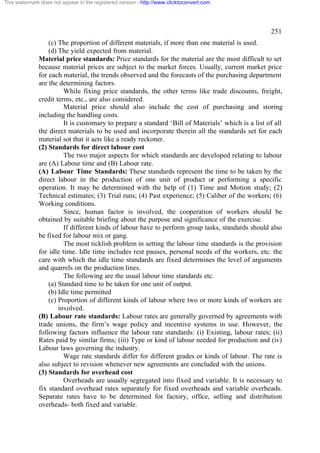
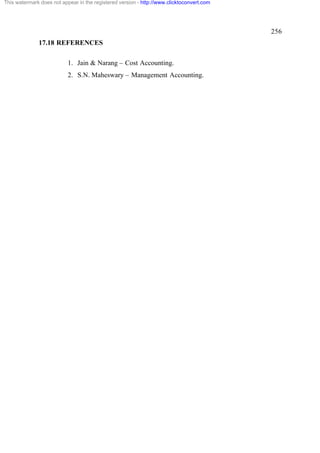
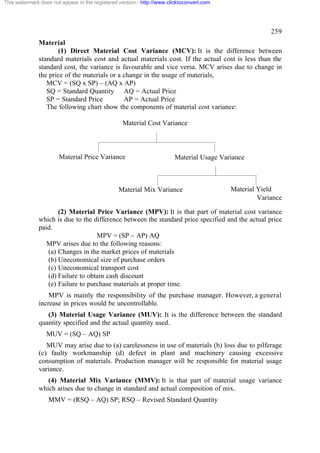
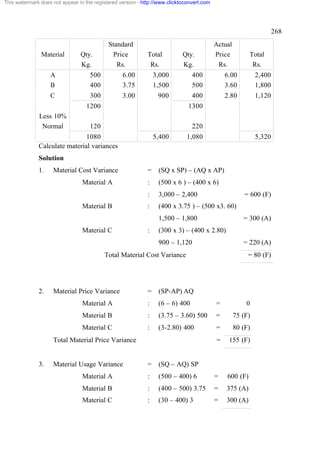
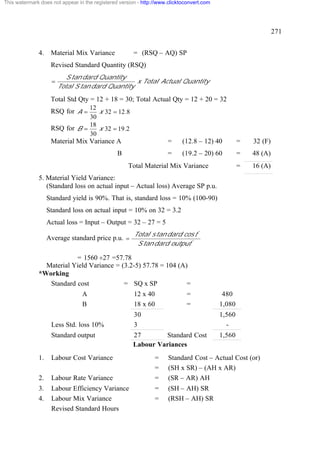
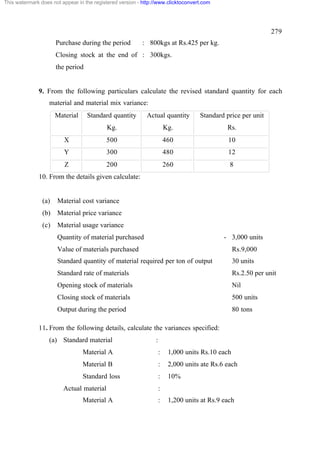
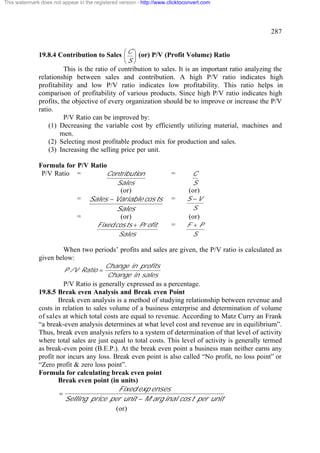
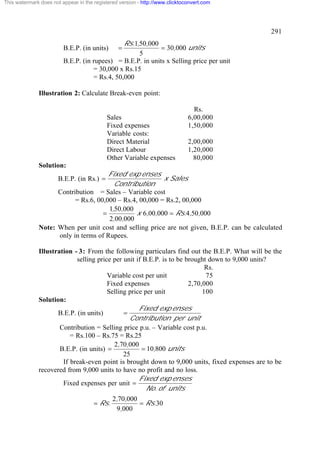
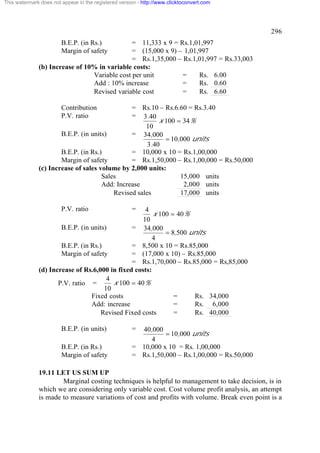
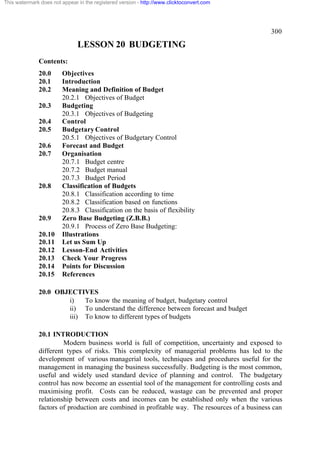
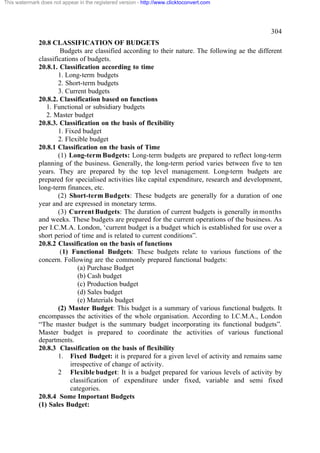
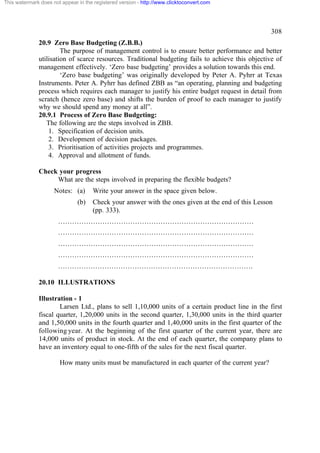
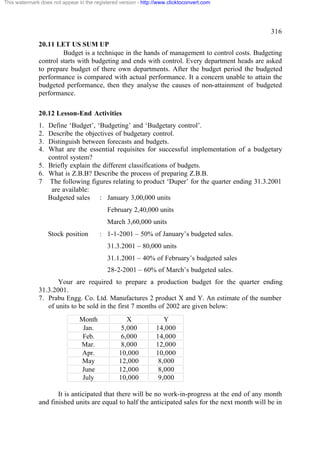
7.4 A SPECIMEN OF TRADING ACCOUNT IS SHOWN BELOW
Trading account for the year ended ……………
Particulars Rs. Rs. Particulars Rs. Rs.
To Opening stock xxx By Sales Xxx
To purchases xxx Less: Returns inwards
(or)
xxx
Sales Returns
Less: purchase returns xxx xxx ----- xxx
To Direct expenses:
Wages xxx By closing stock
Fuel & Power xxx By Gross loss c/d * xxx
Carriage inwards xxx (transferred to profit xxx
and loss A/c)
Royalty on production xxx
Power xxx
Coal water, Gas xxx
Import duty xxx
Consumable stores xxx
Factory expenses xxx
To Gross profit c/d xxx
(transferred to profit and ------ ------
loss A/c)
* Balancing figure will be either gross profit or loss in Trading A/c
Check your progress 7
List out closing entries to be passed to transfer relevant ledger balances to trading
account.](https://image.slidesharecdn.com/bbmaccount-111016045217-phpapp01/85/Bbm-account-87-320.jpg)
![This watermark does not appear in the registered version - http://www.clicktoconvert.com
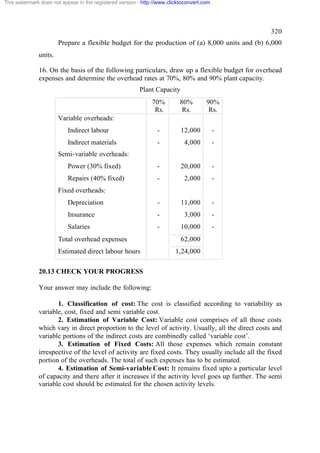
90
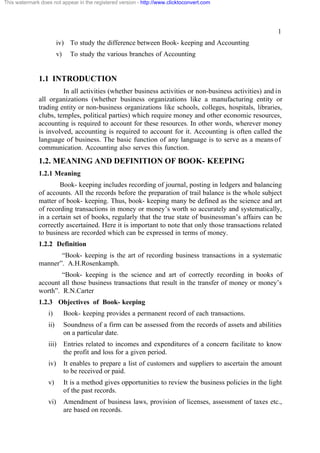
7.6 LET US SUM UP
At the end of the year, trading account is prepared to know the trading results.
Trade expenses like wages, carriage inward are considered. Cost of goods sold is
compared with sales in order to know gross profit / gross loss.
7.7 LESSON – END ACTIVITIES
1. What is trading account? Why it is prepared?
2. Distinguish between trading and manufacturing account?
7.8 Check your progress answer
Your answer may include the following :
(i) For opening stock, purchases and direct expenses.
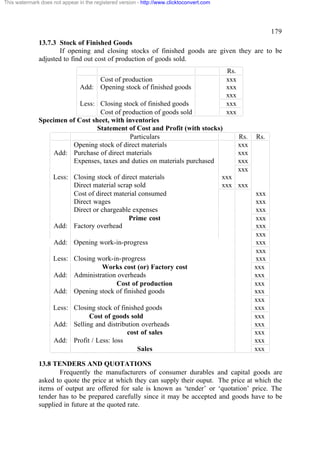
Trading A/c Dr xxx
To Opening Stock A/c xxx
To Purchases (Net) A/c xxx
To Direct expenses A/c xxx
[Being transfer of trading a/c debit
side items]
(ii) For transfer of sales (after reducing sales returns)
Sales (net) A/c Dr xxx
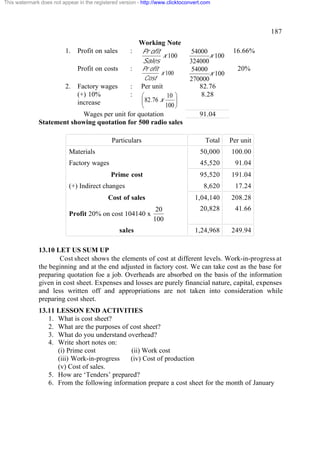
To Trading A/c xxx
[Being transfer of sales to Trading A/c]
(iii) For transferring gross profit
Trading A/c Dr xxx
To Profit & Loss A/c xxx
[Being transfer of gross profit to P&L A/c]
(iv) For Gross Loss
Profit & Loss A/c Dr xxx
To Trading A/c xxx
[Being transfer of gross loss to P&L A/c]](https://image.slidesharecdn.com/bbmaccount-111016045217-phpapp01/85/Bbm-account-91-320.jpg)
![This watermark does not appear in the registered version - http://www.clicktoconvert.com
93
(1) Operating expenses: These expenses are incurred to operate the business
efficiently. They are incurred in running the organisation. Operating expenses include
administration, selling, distribution, finance, depreciation and maintenance expenses.
(2) Non operating expenses: These expenses are not directly associate with day today
operations of the business concern. They include loss on sale of assets, extraordinary
losses, etc.
8.3.2 Credit side
Gross profit is the first item appearing on the credit side of profit and loss
account. Other revenue incomes also appear on the credit side of profit and to account.
The other incomes are classified as operating incomes and non operating incomes.
(1) Operating incomes: These incomes are incidental to business and earned
from usual business carried on by the concern. Examples: discount received,
commission earned, interest received etc.
(2) Non operating incomes: These incomes are not related to the business
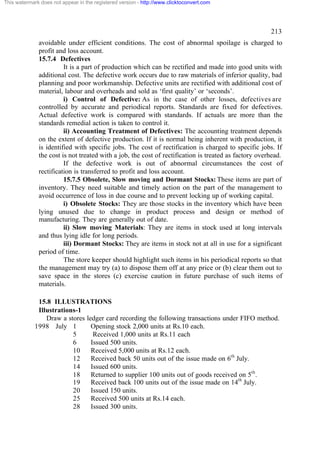
carried on by the firm. Examples are profit on sale of fixed assets, refund of tax etc.
8.4 CLOSING ENTRIES FOR PROFIT AND LOSS ACCOUNT
1. For transferring expenses to profit and loss account:
Profit and Loss A/c Dr xxx
To expenses A/c xxx
[Being transfer of all P&L A/c debit
side items]
2. For transfer of incomes to profit and loss account
Incomes A/c Dr xxx
To Profit and Loss A/c xxx
[Being transfer of Incomes to P&L A/c]
3. For net profit:
P&L A/c Dr xxx
To Capital A/ xxx
[Being net profit credited to capital]
4. For transfer of Net Loss
Capital A/c Dr xxx
To P&L A/c xxx
[Being net loss transferred to capital]](https://image.slidesharecdn.com/bbmaccount-111016045217-phpapp01/85/Bbm-account-94-320.jpg)

![This watermark does not appear in the registered version - http://www.clicktoconvert.com
107
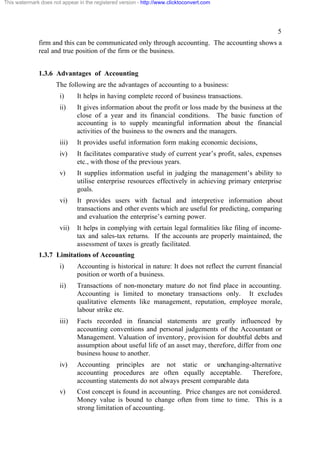
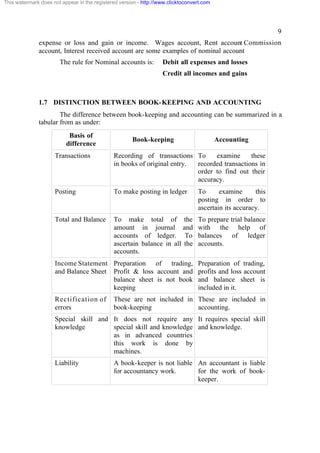
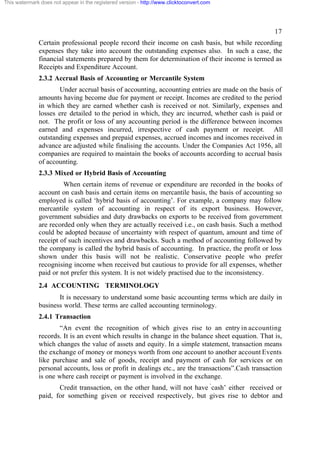
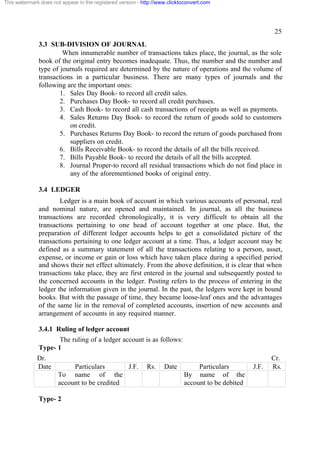
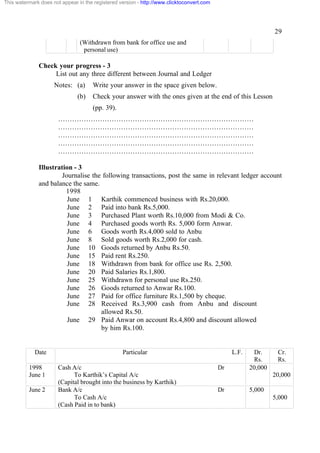
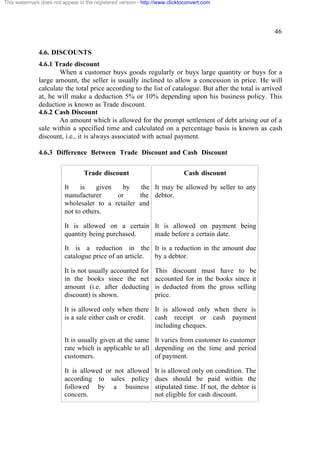
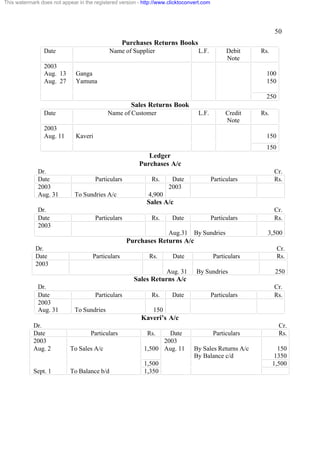
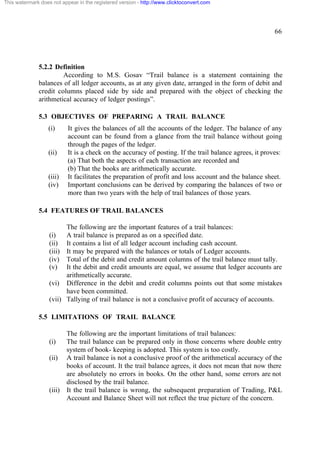
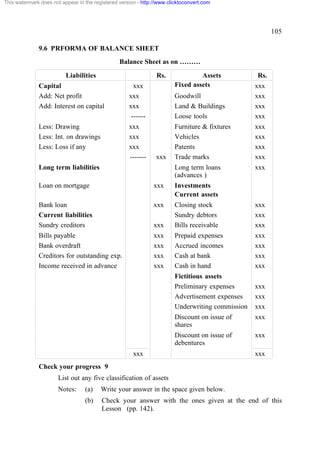
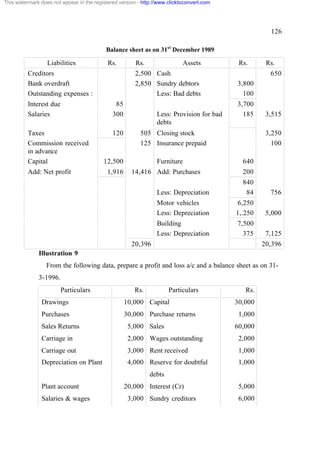
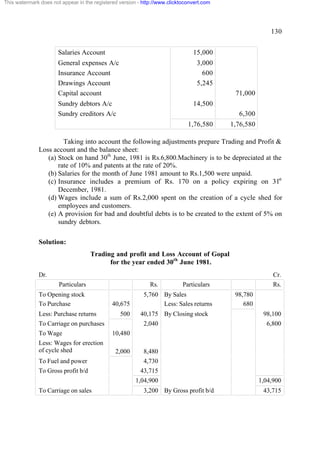
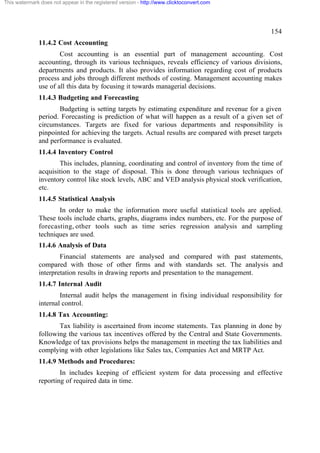
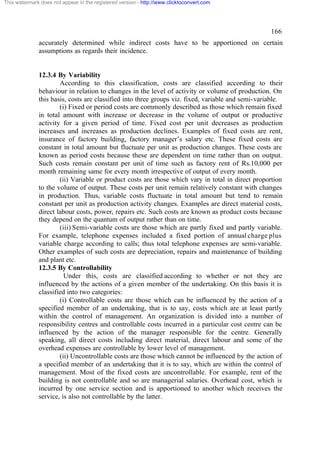
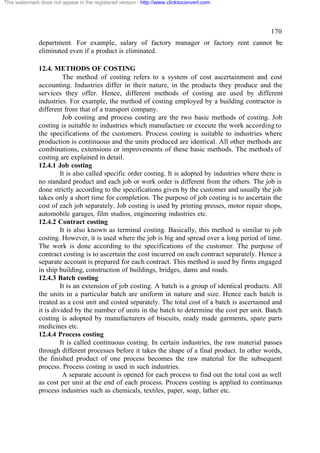
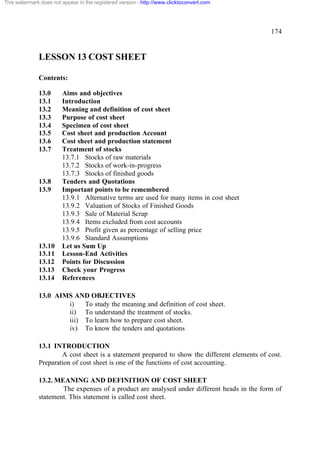
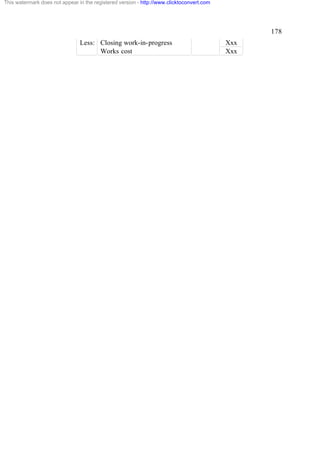
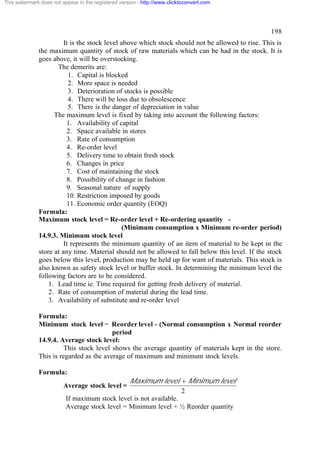
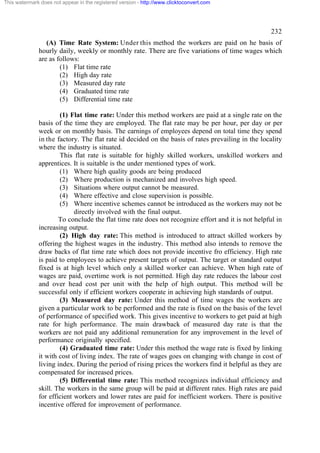
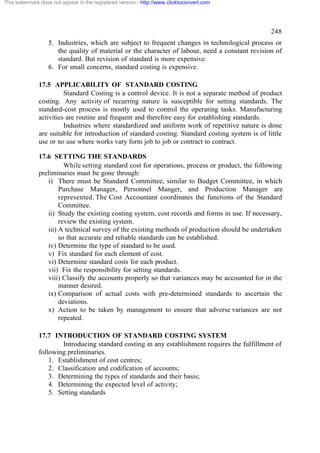
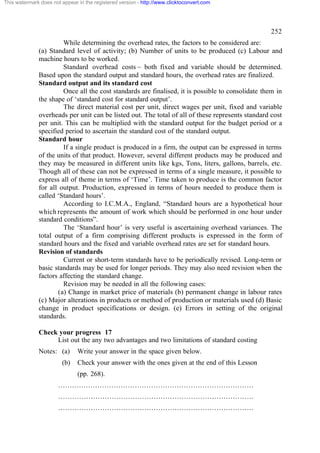
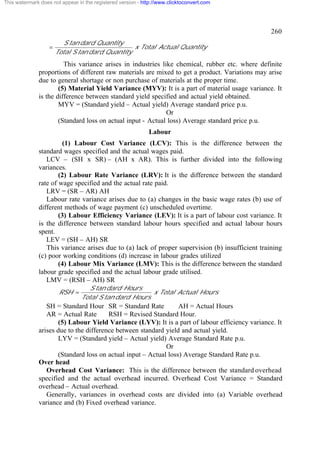
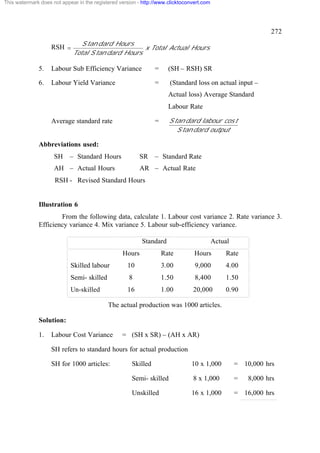
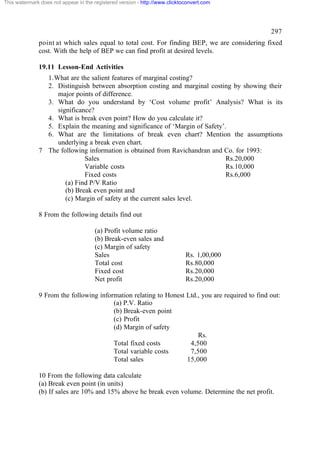
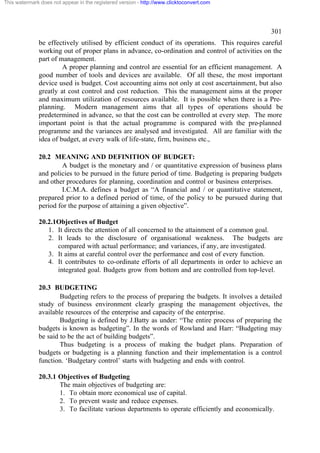
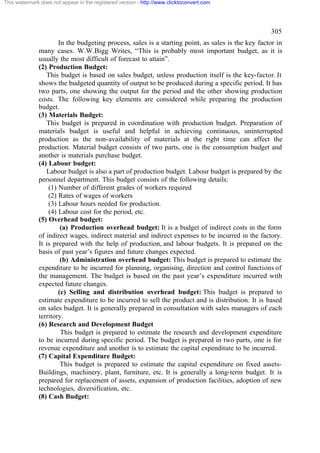
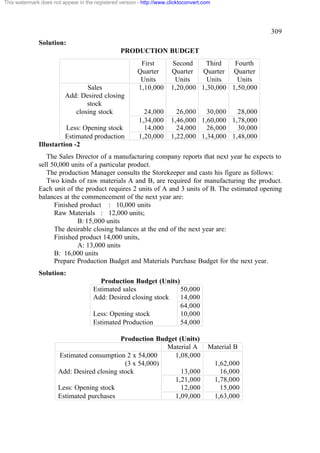
Solution
Saravanan Traders
Balance Sheet as on 31st December 2004
Liabilities Rs. Assets Rs.
Capital 2,50,000 Fixed assets 2,00,000
Add : Net profit 70,000 Less: Depn. 20,000
1,80,000
Less: Drawings 3,20,000 Investments 15,000
12,000 Closing stock 20,000
3,08,000 Sundry 52,000
debtors
Bills payable 2,000 Bills 21,000
receivable
Sundry creditors 25,000 Cash at bank 30,000
Liabilities for 10,000 Cash in hand 40,000
expenses
Bank overdraft 13,000
3,58,000 3,58,000
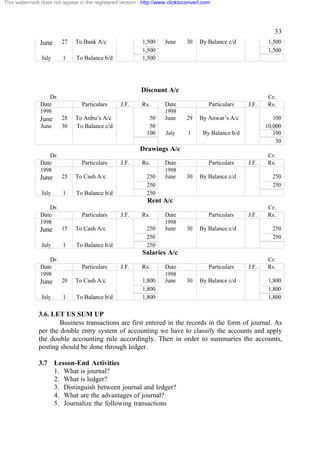
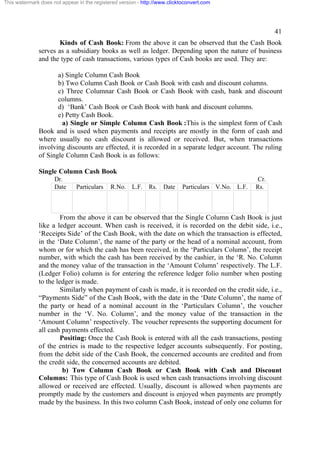
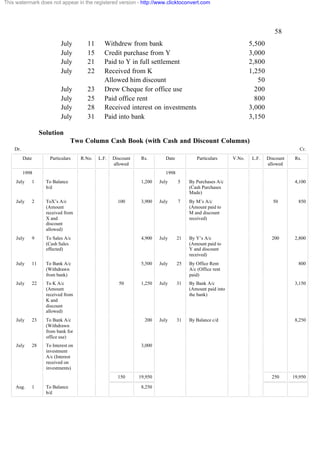
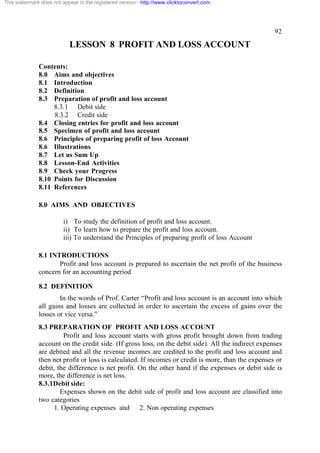
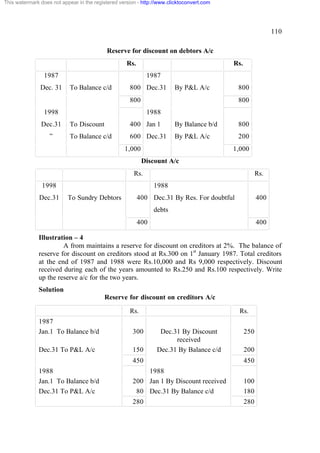
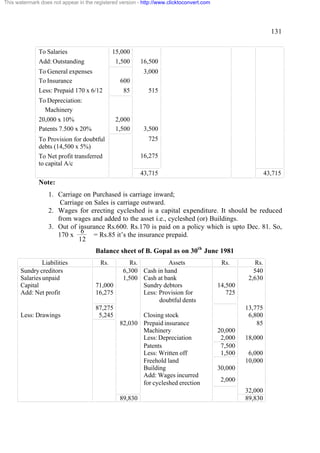
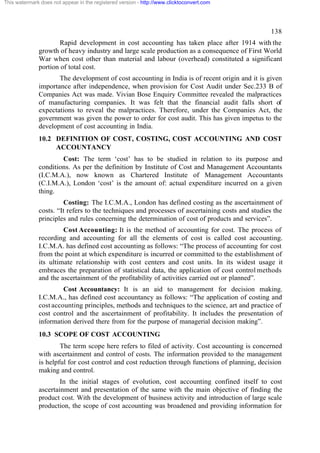
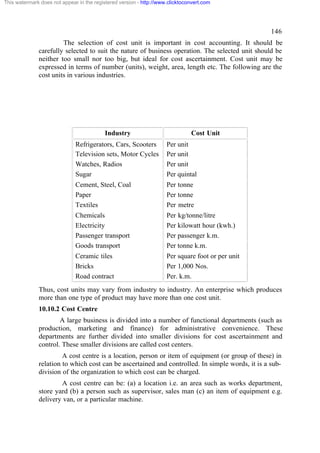
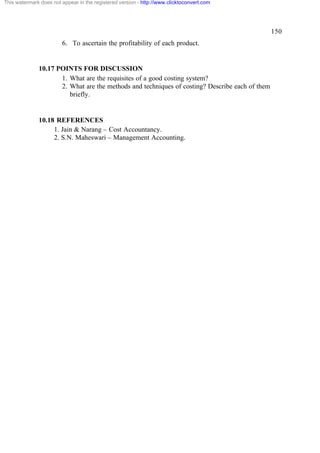
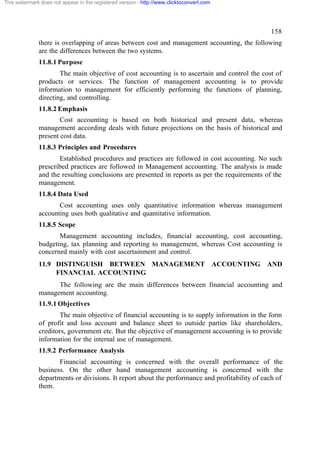
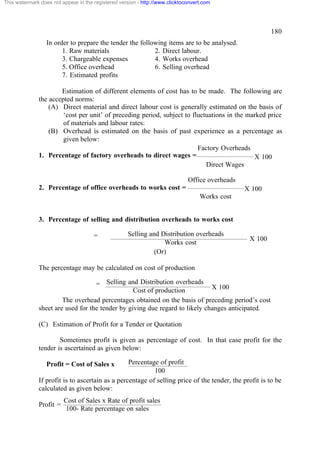
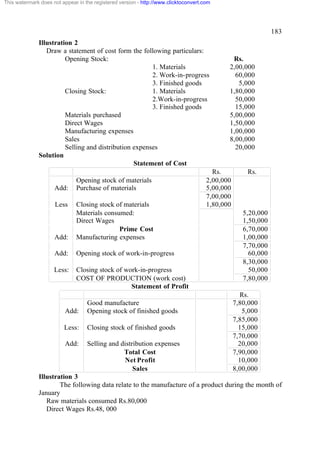
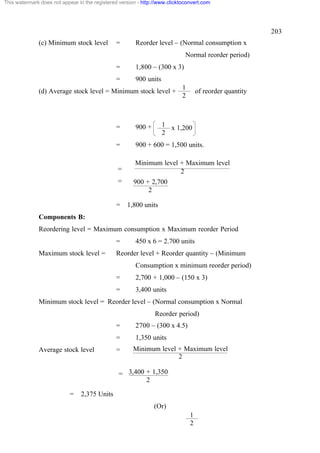
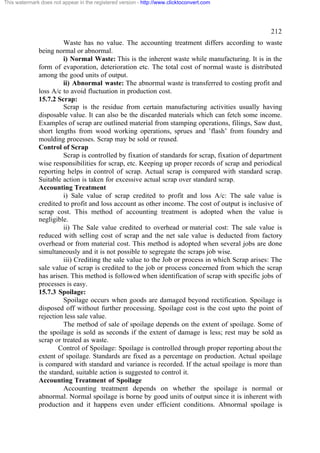
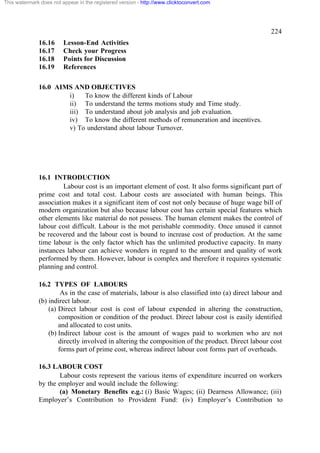
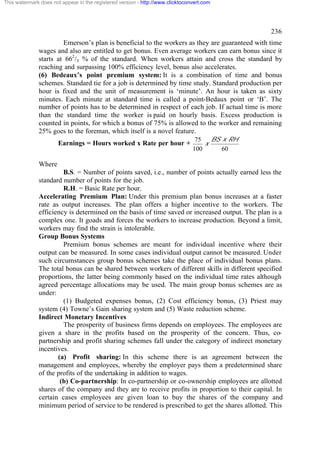
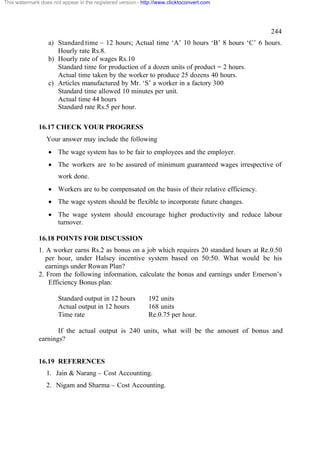
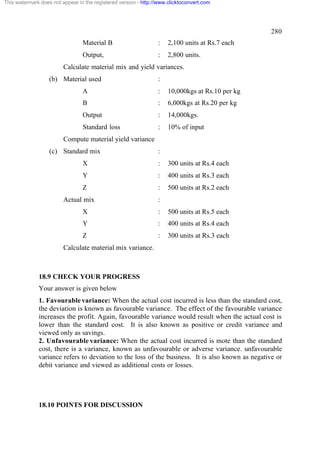
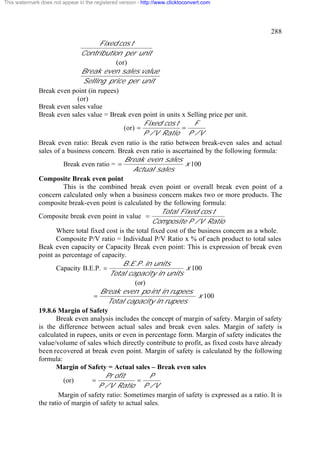
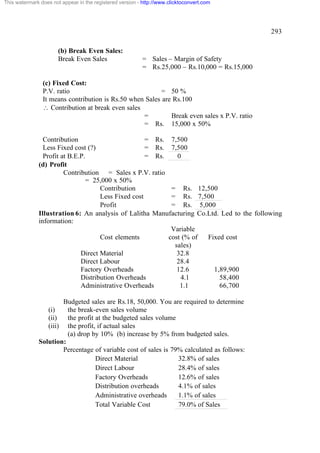
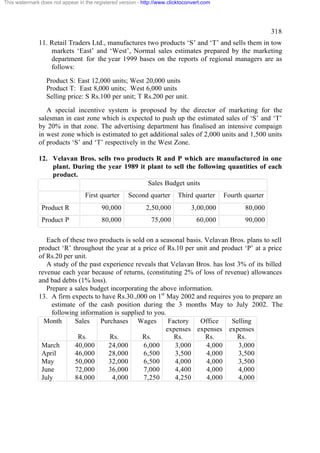
Illustrations 2
The reserve for doubtful debts account showed a credit balance of Rs.1,500
on 1.1.90. During 1990, bad debts amounted to Rs.1,100. The debtors on 31.12.90
owed Rs.40,000. Maintain a 5% reserve for doubtful debts. During 1991, bad debts
came to Rs.800. On 31.12.91 the debtors owed Rs.44,000. The bad debts in 1992
amounted to Rs.400. On 31.12.92, the debtors owed Rs.32,000. The same 5% reserve
for doubtful debts is maintained in all the years. Pass necessary journals and ledger
accounts.
Solution
Journal Entries
Date Particulars Rs. Rs.
1990 Bad debts A/c Dr. 1,100
Dec.31 To Sundry debtors A/c 1,100
[Being bad debts written off]
” Prov. For doubtful debts A/c Dr. 1,100
To Bad debts A/c 1,100
[Being bad debts transferred]
” Profit & Loss A/c Dr. 1,600
To Provision for doubtful debts A/c 1,600
[Being amount transferred to P&L A/c
1991 Bad debts A/c Dr. 800](https://image.slidesharecdn.com/bbmaccount-111016045217-phpapp01/85/Bbm-account-108-320.jpg)
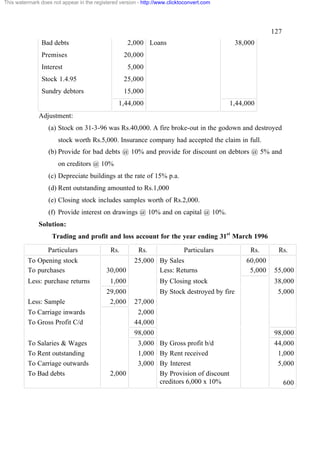
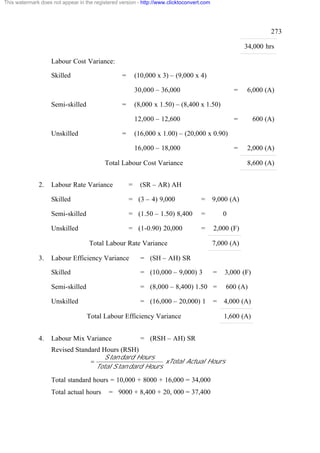
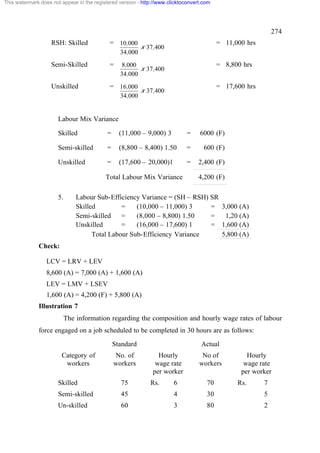
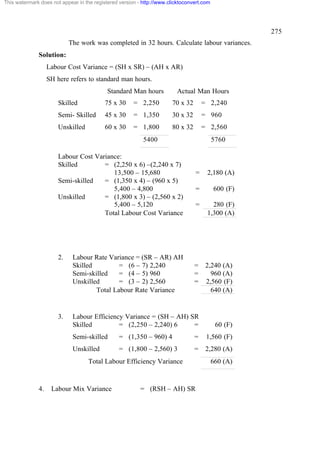
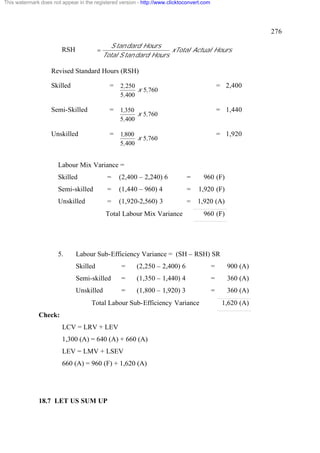
![This watermark does not appear in the registered version - http://www.clicktoconvert.com
108
Dec.31 To Sundry debtors A/c 800
[Being bad debts written off]
” Prov. for doubtful debts A/c Dr. 800
To Bad debts A/c 800
[Being bad debts transferred]
” Profit & Loss A/c Dr. 1,000
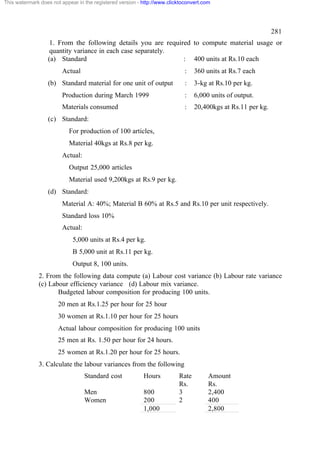
To Provision for doubtful debts A/c 1,000
[Being amount transferred to P & L A/c
1992 Bad debts A/c Dr. 400
Dec.31 To Sundry debtors A/c 400
[Being bad debts written off]
” Prov. for doubtful debts A/c Dr. 400
To Bad debts A/c 400
[Being bad debts A/c]
” Prov. for doubtful debts A/c Dr. 300
To Profit & Loss A/c 300
[Being excess reserve credited to P&L A/c]
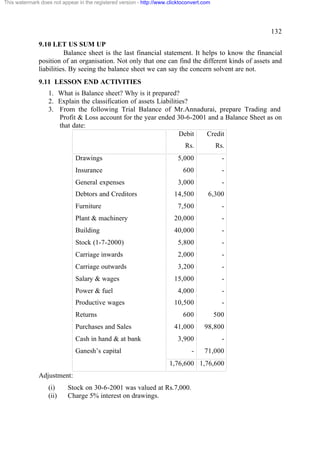
Bad debts A/c
Rs. Rs.
1990 1990
Dec.31 To Sundry Debtors 1,100 Dec.31 By Prov. for doubtful 1,100
debts
1991 1991
Dec.31 To Sundry Debtors 800 Dec.31 By Prov. for doubtful 800
debts
1992 1992
Dec.31 To Sundry Debtors 400 Jan 1 Balance b/d 400](https://image.slidesharecdn.com/bbmaccount-111016045217-phpapp01/85/Bbm-account-109-320.jpg)
![This watermark does not appear in the registered version - http://www.clicktoconvert.com
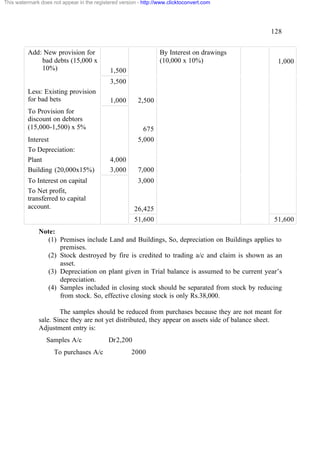
109
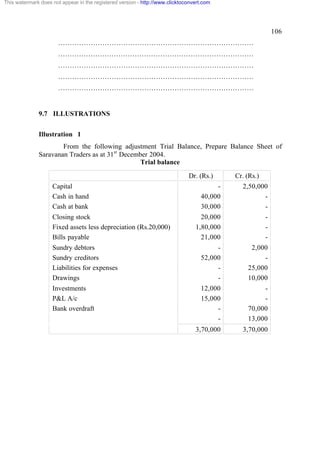
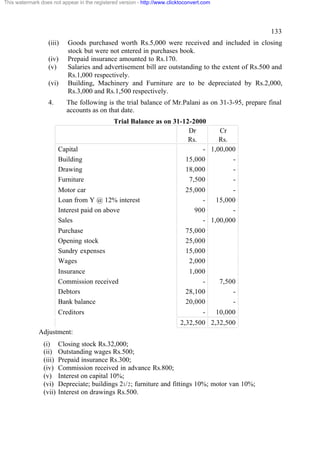
Provision for doubtful debts A/c
Rs. Rs.
1990 To Bad debts 1,100 1990 By Balance b/d 1,500
Dec.31 To Balance c/d 2,000 Dec.31 By P&L A/c 1,600
3,100 3,100
1991 1991
Dec.31 To Bad debts 800 Jan.31 By Balance b/d 2,000
To Balance c/d 2,200 By P&L A/c 1,000
3,000 3,000
1992 1992
Dec.31 To Bad debts 400 Jan 1 Balance b/d 2,200
To P&L A/c 300
To Balance c/d 1,500
2,200 2,200
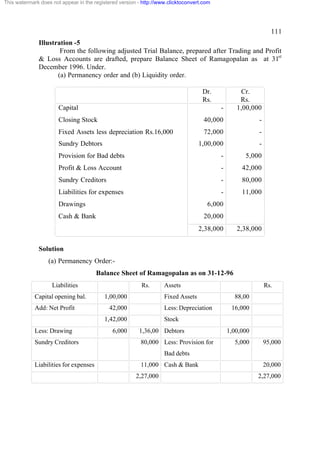
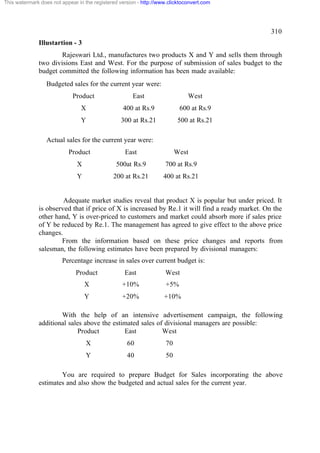
Illustration -3
The sundry debtors of a firm on 1st December 1987 were Rs.40,000. On that
date it was decided to create a provision for discount at 2% on debtors . During 1988
the actual amount of discount allowed was Rs.400. The debtors on 31st December
1988 were Rs30,000 and it is again decided to create a provision for discount on
debtors at 2%. Show the journal entries, discount A/c and provision for discount A/c
for both the year.
Solution
Journal Entries
Date Particulars Rs. Rs.
1987 Profit & loss Dr. 800
Dec.31 To Res. For discount on debtors A/c 800
[Being 2% reserve created on Rs.40,000]
1988 Discount A/c Dr. 400
Dec.31 To Sundry debtors A/c 400
[Being the discount allowed to debtors]
” Reserve for discount on debtors A/c Dr. 400
To Discount A/c 400
[Being the transfer made]
” Profit & Loss A/c Dr. 200
To Res. For discount on debtors A/c 200
[Being the provision created]](https://image.slidesharecdn.com/bbmaccount-111016045217-phpapp01/85/Bbm-account-110-320.jpg)
![This watermark does not appear in the registered version - http://www.clicktoconvert.com
137
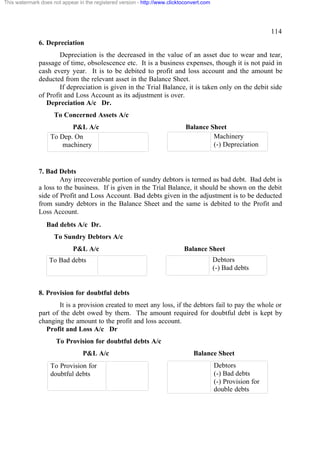
10.8.11 Reconciliation
10.8.12 Overall Efficiency of Cost Accountant
10.9 Installation of a costing system
10.9.1 Determination of objectives
10.9.2 Study of the nature of business
10.9.3 Study of the nature of the organization
10.9.4 Deciding the structure of cost accounts
10.9.5 Determination of cost rates
10.9.6 Organization of the cost office
10.9.7 Introducing the system
10.10 Cost concepts
10.10.1 Cost Unit
10.10.2 Cost Centre
10.10.3 Profit Centre
10.10.4 Distinguish between cost centre and profit centre
10.11 Cost control
10.12 Cost reduction
10.13 Difference between cost control and cost reduction
10.14 Let us Sum Up
10.15 Lesson-End Activities
10.16 Check your Progress
10.17 Points for Discussion]
10.18 References
10.0. AIMS AND OBJECTIVES
i) To know the Meaning and Definition of cost, costing and cost Accounting
ii) To study the objectives and functions of cost Accounting
iii) To study the importance of cost Accounting
iv) To know the Characteristics of a good costing system
v) To study the cost control and cost reduction
vi) To understand the meaning of cost unit, cost centre and profit centre.
10.1 INTRODUCTION
Industrialization and advent of factory system during the second half of 19th
Century necessitating accurate cost information have led to the development of cost
accounting. The growth of cost accounting was slow. To quote Eldons Handristen
“Not until the last 20 years of the 19th Century was there much literature on the subject
of cost accounting in England and even very little was found in the United States.
Most of the literature until this time emphasized the procedure for the calculation of
prime costs only”.](https://image.slidesharecdn.com/bbmaccount-111016045217-phpapp01/85/Bbm-account-138-320.jpg)
![This watermark does not appear in the registered version - http://www.clicktoconvert.com
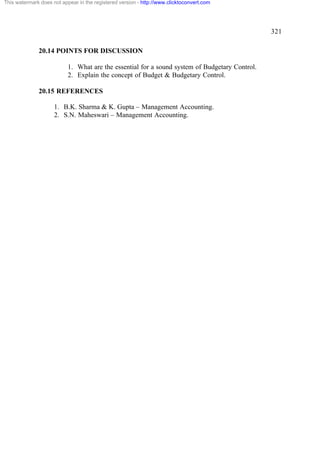
199
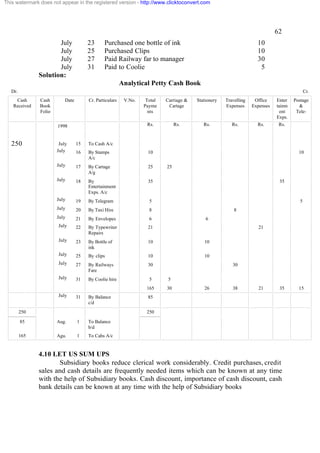
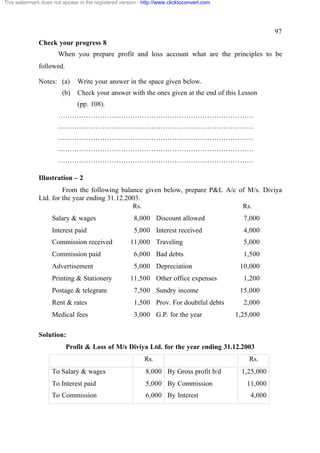
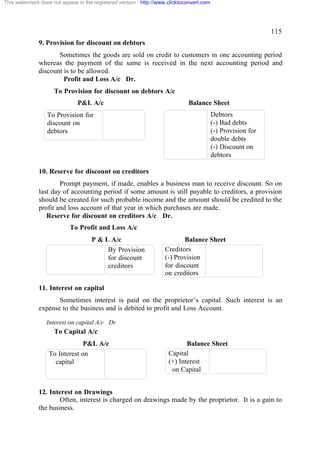
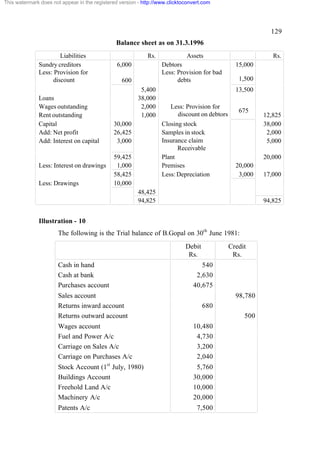
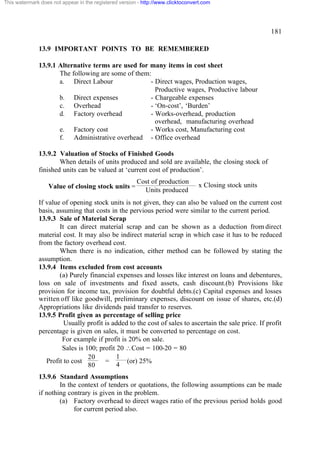
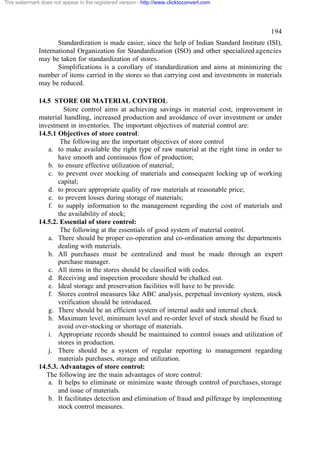
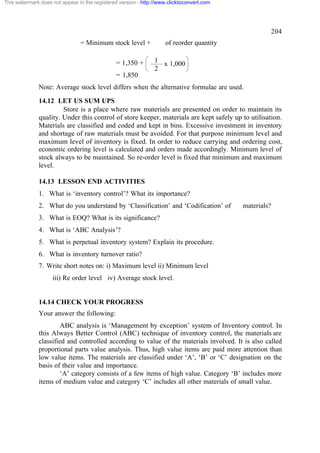
14.10 ECONOMIC ORDER QUANTITY [EOQ]
Economic ordering quantity depends on many factors like cost of purchasing
and receiving, normal consumption, interest on capital, availability of storage
accommodation, ordering and carrying costs. Economic ordering quantity is the
reorder quantity, which is the quantity to be purchased each time an order is placed.
When the purchase price remains constants, the economic ordering quantity
will be determined based on the following formula:
2 AB
EOQ =
CS
Where
EOQ = Economic Ordering Quantity
A = Annual consumption or usage of material in units.
B = Buying cost per order.
C = Cost per unit.
S = Storage and carrying cost per annum.
Check your progress 14
What you understand about ABC analysis
Notes: (a) Write your answer in the space given below.
(b) Check your answer with the ones given at the end of this Lesson
(pp. 215).
…………………………………………………………………………
…………………………………………………………………………
…………………………………………………………………………
…………………………………………………………………………
…………………………………………………………………………
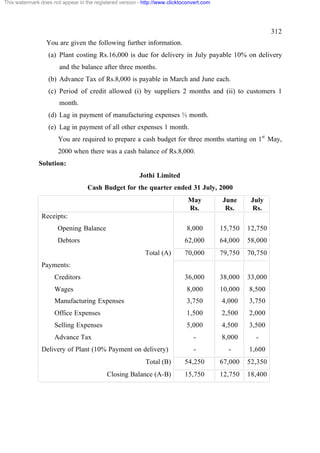
14.11 ILLUSTRATIONS
Illustration 1
The following information is relating to a material for the year ended 1998.
The value of material is Re.1 per Kg.
Opening Stock 800 Kg.
Purchases 12,000 Kg.
Closing Stock 400 Kg.](https://image.slidesharecdn.com/bbmaccount-111016045217-phpapp01/85/Bbm-account-200-320.jpg)
![This watermark does not appear in the registered version - http://www.clicktoconvert.com
206
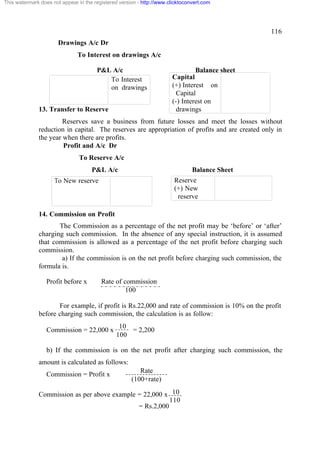
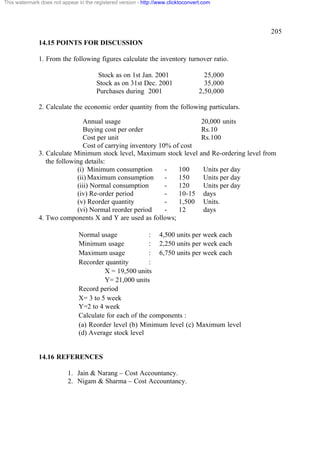
LESSON 15 STORES LEDGER
Contents:
15.0 Aims and objectives
15.1 Introduction
15.2 Store ledger Specimen
15.3 BIN card
15.3.1 Difference between store ledger and Bin card
15.4 Issue of material
15.4.1 Material requisition
15.4.2 Bill of material
15.5 Treatment of surplus material
15.5.1 Return of surplus Material
15.5.2 Transfer of surplus Material
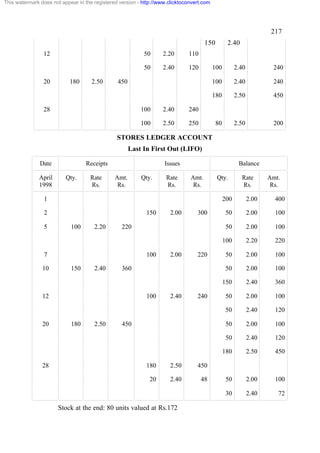
15.6 Methods of pricing of material
15.6.1 First in First out method [FIFO]
15.6.2 Last in First out method [LIFO]
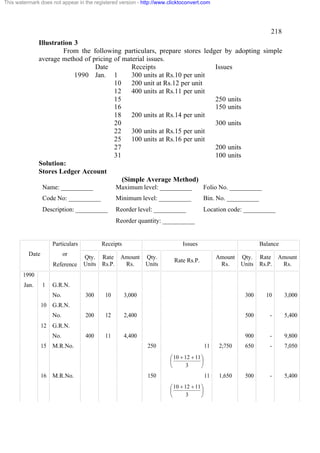
15.6.3 Simple Average method
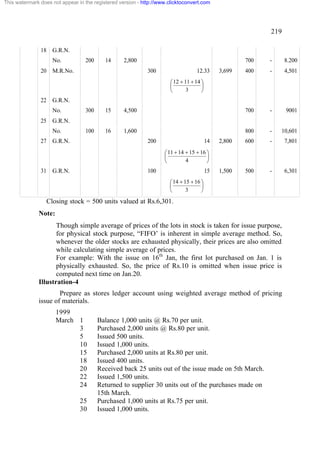
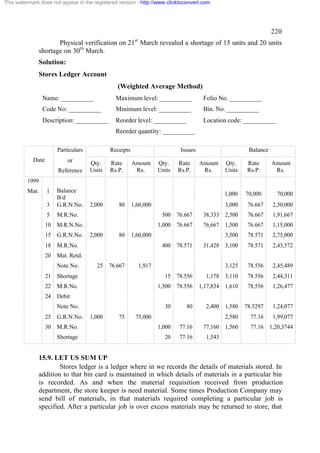
15.6.4 Weighted Average method
15.7 Material losses and Types
15.7.1 Waste
15.7.2 Scrap
15.7.3 Spoilage
15.7.4 Defectives
15.7.5 Obsolete, Slow moving and Dormant Stocks
15.8 Let us Sum Up
15.9 Lesson-End Activities
15.10 Check your Progress
15.11 Points for Discussion
15.12 References
15.0 AIMS AND OBJECTIVES
i) To know the store ledger and Bin card
ii) To understand the issue of material and treatment of surplus material.
iii) To study the different methods of pricing of material and material losses.
15.1 INTRODUCTION
Store ledger is another stores record kept in the costing department. It is a
document showing the quantity and value of materials received, issued and in balance
at the end. One stores ledger is allotted to each component of material. Entries are
made in this ledger by the costing clerk with reference to goods received note,
material requisition note, material returned note etc. It is very similar to the bin card
except it contains additional columns showing the prices and value of materials
received, issued and balance in hand. It gives the value of closing stock at any time.](https://image.slidesharecdn.com/bbmaccount-111016045217-phpapp01/85/Bbm-account-207-320.jpg)

![This watermark does not appear in the registered version - http://www.clicktoconvert.com
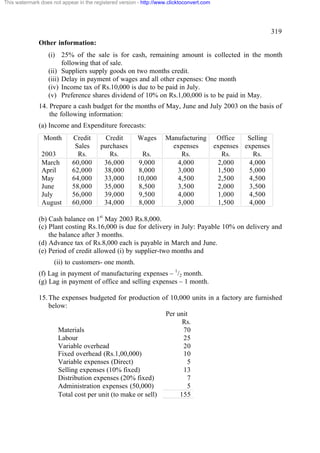
317
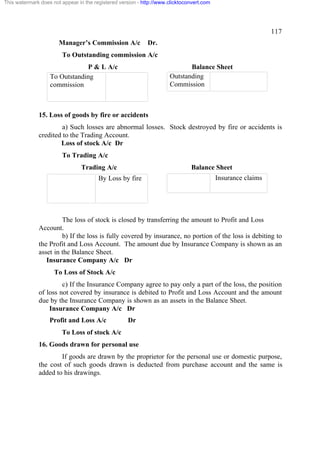
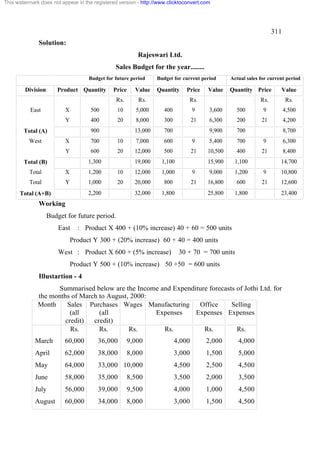
stock at the end of each month (including Dec.2001). Your are required to prepare a
production budget showing the number of units to be manufactured each month.
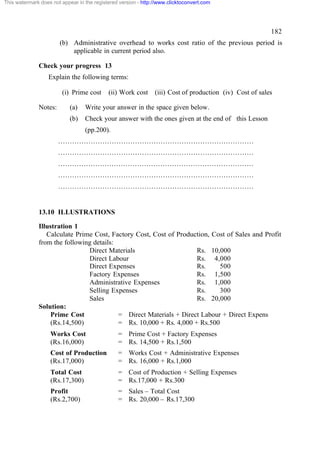
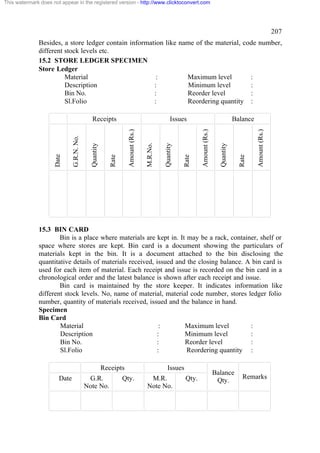
9. Draw a material procurement budget [quantitative] from the following
information Estimated sales of a product 40,000 units. Each unit of the product
requires 3 units of material A and 5 units of material B.
Estimate opening balances at the commencement of the next year.
Finished product 5,000 units
Material A 12,000 units
Material B 20,000 units
Materials on order
Material A 7,000 units
Material B 11,000 units
The desirable closing balances at the end of the next year.
Finished product 7,000 units
Material A 15,000 units
Material B 25,000 units
Material on order
Material A 8,000 units
Material B 10,000 units
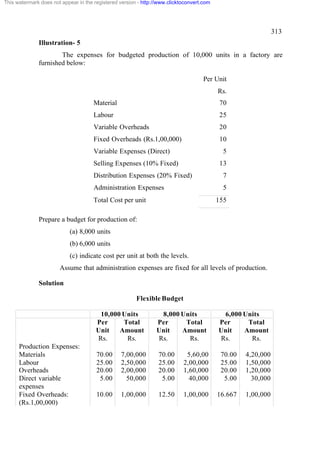
10. The sales director of Future Problem & Co. reports that next year he
expects to sell 1,00,000 units of a particular product. The Production Manager
consults the store keeper and casts his figures as follows:
Two kind of raw materials ‘P’ and ‘Q’ are required for manufacturing the
product. Each unit of the product requires 2 units of P and 3 units of Q. The estimated
opening balances at the commencement of next year are
Finished product – 20,000 units
Raw material ‘P’ – 24,000 units
Raw material ‘Q’ – 30,000 units
The desirable closing balances at the end of next year are:
Finished product – 28,000 units
Raw material ‘P’ – 26,000 units
Raw material ‘Q’ – 32,000 units
Prepare production budget and materials purchase budget for the next year.](https://image.slidesharecdn.com/bbmaccount-111016045217-phpapp01/85/Bbm-account-318-320.jpg)

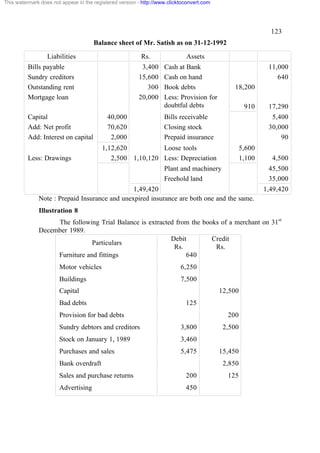
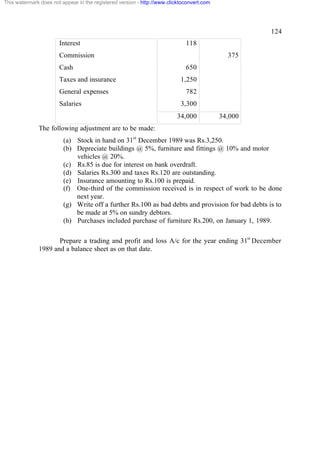
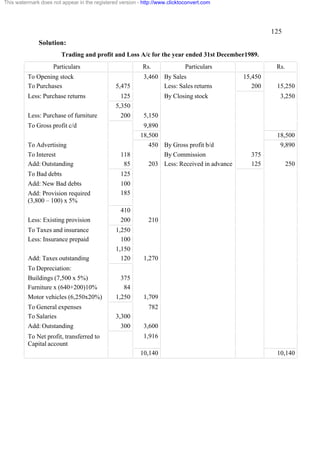
This document provides an introduction to accounting, including definitions and objectives of bookkeeping and accounting. It discusses the key differences between bookkeeping and accounting, and covers topics like the double-entry accounting system, types of accounts, and branches of accounting. The document is the first lesson in an accounting course, aiming to explain the basic concepts and terminology used in accounting.