Download to read offline


![ This error demonstrates greatly how DataFlow analysis works in
PVS-Studio
This error was found using PVS-Studio in Chromium project
(Protocol Buffers)
The analyzer issues two warnings:
V547 Expression 'time.month <= kDaysInMonth[time.month] + 1' is always
true. time.cc 83
V547 Expression 'time.month <= kDaysInMonth[time.month]' is always true.
time.cc 85
Data Flow analysis](https://image.slidesharecdn.com/2020-210315053109/85/PVS-Studio-features-overview-2020-10-320.jpg)
![static const int kDaysInMonth[13] = {
0, 31, 28, 31, 30, 31, 30, 31, 31, 30, 31, 30, 31
};
bool ValidateDateTime(const DateTime& time) {
if (time.year < 1 || time.year > 9999 ||
time.month < 1 || time.month > 12 ||
time.day < 1 || time.day > 31 ||
time.hour < 0 || time.hour > 23 ||
time.minute < 0 || time.minute > 59 ||
time.second < 0 || time.second > 59) {
return false;
}
if (time.month == 2 && IsLeapYear(time.year)) {
return time.month <= kDaysInMonth[time.month] + 1;
} else {
return time.month <= kDaysInMonth[time.month];
}
}](https://image.slidesharecdn.com/2020-210315053109/85/PVS-Studio-features-overview-2020-11-320.jpg)
![static const int kDaysInMonth[13] = {
0, 31, 28, 31, 30, 31, 30, 31, 31, 30, 31, 30, 31
};
bool ValidateDateTime(const DateTime& time) {
if (time.year < 1 || time.year > 9999 ||
time.month < 1 || time.month > 12 ||
time.day < 1 || time.day > 31 ||
time.hour < 0 || time.hour > 23 ||
time.minute < 0 || time.minute > 59 ||
time.second < 0 || time.second > 59) {
return false;
}
if (time.month == 2 && IsLeapYear(time.year)) {
return time.month <= kDaysInMonth[time.month] + 1;
} else {
return time.month <= kDaysInMonth[time.month];
}
}](https://image.slidesharecdn.com/2020-210315053109/85/PVS-Studio-features-overview-2020-12-320.jpg)
![static const int kDaysInMonth[13] = {
0, 31, 28, 31, 30, 31, 30, 31, 31, 30, 31, 30, 31
};
bool ValidateDateTime(const DateTime& time) {
if (time.year < 1 || time.year > 9999 ||
time.month < 1 || time.month > 12 ||
time.day < 1 || time.day > 31 ||
time.hour < 0 || time.hour > 23 ||
time.minute < 0 || time.minute > 59 ||
time.second < 0 || time.second > 59) {
return false;
}
if (time.month == 2 && IsLeapYear(time.year)) {
return time.month <= kDaysInMonth[time.month] + 1;
} else {
return time.month <= kDaysInMonth[time.month];
}
}](https://image.slidesharecdn.com/2020-210315053109/85/PVS-Studio-features-overview-2020-13-320.jpg)
![static const int kDaysInMonth[13] = {
0, 31, 28, 31, 30, 31, 30, 31, 31, 30, 31, 30, 31
};
bool ValidateDateTime(const DateTime& time) {
if (time.year < 1 || time.year > 9999 ||
time.month < 1 || time.month > 12 ||
time.day < 1 || time.day > 31 ||
time.hour < 0 || time.hour > 23 ||
time.minute < 0 || time.minute > 59 ||
time.second < 0 || time.second > 59) {
return false;
}
if (time.month == 2 && IsLeapYear(time.year)) {
return time.month <= kDaysInMonth[time.month] + 1;
} else {
return time.month <= kDaysInMonth[time.month];
}
} time.day](https://image.slidesharecdn.com/2020-210315053109/85/PVS-Studio-features-overview-2020-14-320.jpg)


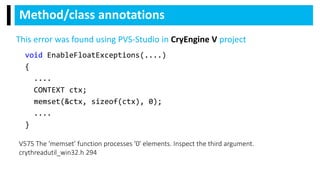
![static void FwdLockGlue_InitializeRoundKeys()
{
unsigned char keyEncryptionKey[KEY_SIZE];
....
memset(keyEncryptionKey, 0, KEY_SIZE); // Zero out key data.
}
Pattern-based matching analysis
V597 CWE-14 The compiler could delete the 'memset' function call, which is used to flush
'keyEncryptionKey' buffer. The memset_s() function should be used to erase the private data.
FwdLockGlue.c 102
This error was found using PVS-Studio in Android
project](https://image.slidesharecdn.com/2020-210315053109/85/PVS-Studio-features-overview-2020-18-320.jpg)


PVS-Studio is a static code analyzer for C, C++, C#, and Java that detects bugs and vulnerabilities. It supports various compilers and IDE plugins. It uses data flow analysis, symbolic execution, pattern matching, and other techniques to detect bugs like buffer overflows, leaks, dead code, and undefined behavior. Over 700 diagnostics are implemented to date across the supported languages. The analyzer produces warnings classified by standard taxonomies. Users can exclude files, suppress warnings, and integrate it with continuous integration systems. Support and documentation is provided through online and PDF references.


![Lect 1 Number systems and base conversions. [Autosaved].pptx](https://cdn.slidesharecdn.com/ss_thumbnails/lect1numbersystemsandbaseconversions-260111134109-67c2d865-thumbnail.jpg?width=640&height=640&fit=bounds)


