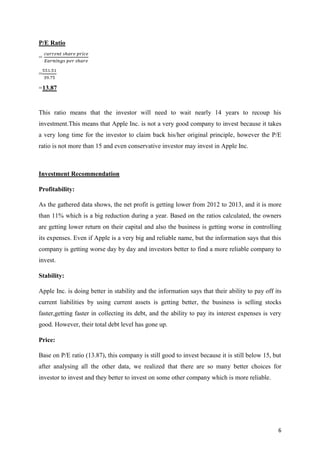
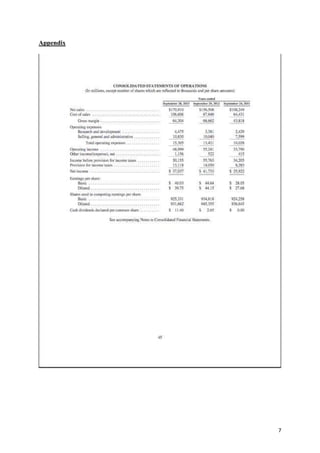
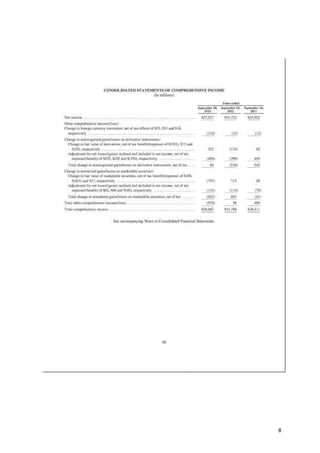
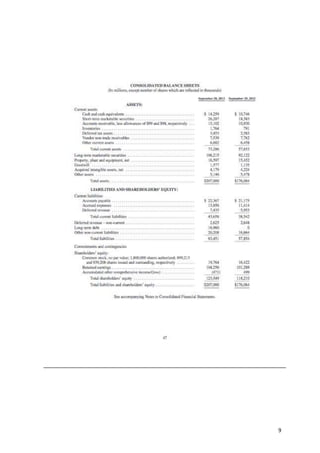
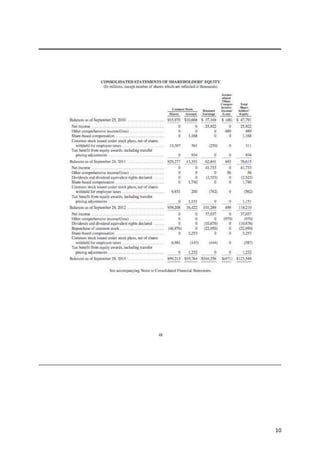
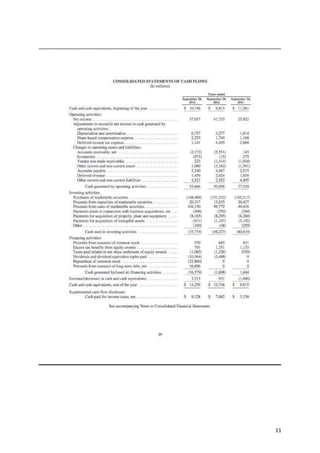
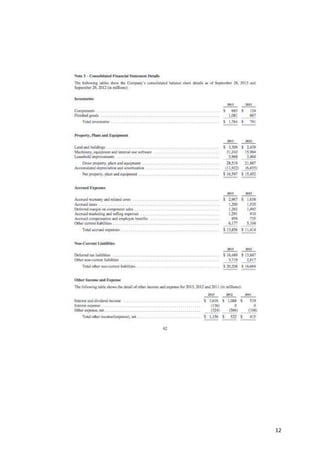
SCHOOL OF ARCHITECTURE, BUILDING AND DESIGN
THE DESIGN SCHOOL
FOUNDATION IN NATURAL BUILD ENVIRONMENT

TOPIC: FINANCIAL RATIO ANALYSIS

GROUP MEMBERS: PARHAM FARHADPOOR
MOY CHIN HOONG

SUBJECT:

0313698

0314014

BASIC ACCOUNTING
(FNBE0145)

LECTURER:

CHANG JAU HO

SUBMISSION DATE: 24th JANUARY 2014

1
The Introduction
Apple Inc. (Apple) was founded by Steve Jobs, Steve Wozniak, and Ronald Wayne on 1 st
April, 1976 to develop personal computers, then Applewas incorporated in January 3, 1977 in
California.Their main focus was on computers until 2007, they changed their main focus to
other electric devices such as mobile phones and tablets. They manufactures, and markets
mobile communication and media devices such as iPhone, iPad, iPod, Mac, and apple TV as
hard wares while iOS, OS X, and iCloud as softwares. Apple sells and delivers digital content
and applications through the iTunes Store®, App Store™, iBooks Store™, and Mac App
Store. Apple is the world's top two largest information technology company and world's top
three largest mobile phone maker. Recently they introduced iBeacon late last year on devices
running iOS 7, the location-sensing technology works by sending off short-range transmitters
that notify mobile devices when they are within 100 feet of a beacon. This type of locationsensing technology can be used for indoor navigation, automatic ticketing, and locationrelevant promotions. Besides , Apple has bought Israel-based PrimeSense Ltd, which is a
developer of three dimensional chips with the price of $350 million. Apple also introduced
IOS Mfi-certified game controlled to solve the problem of a pocket arcade without enough
buttons recently. It gives the gamers to have a full game controller-like feeling while playing
games with their phone and ipod touch.

2
The Information needed for the Calculation of Ratio

-

2012
41,733
118,210
156,508
68,662
5,020
8,401

Net Profit
O/E
Net Sales
Gross Profit
Selling Expenses
General
Expenses
1,698
Financial
Expenses
791
Inventory
10,930
Debtors
57,653
Total Current
Asset
38,542
Total Current
Liability
87,846
Total GOGS
78,254
Credit Sales
0
Interest Expense
176,064
Total Asset
57,854
Total Liabilities
*All the numbers present in the table are in millions.

2013
37,037
123,549
170,910
64,304
5,415
9,890
16,379
1,764
13,102
73,286
43,658
106,606
85,455
136
207,000
83,451

*Notes:-

Total Selling & General
Exp.
Research & Development
Exp.
* Total Selling Exp.
* Total General Exp.

2012
10,040

2013
10,830

3,381

4,475

= 5,020
) + 3,381 = 8,401

= 5,415
+ 4,475 = 9,890

3
Ratio Analysis on the Business Based on the Year 2012 & 2013

Profitability
Ratio

2012

2013
100

Return on
Equity (ROE)
=

Net profit
Margin
(NPM)

100= 34.5%

=

=
=

=26.7%

=

Gross profit
Margin
(GPM)

=

=

=

=

=43.9%

=

x 100 = 3.21%

=

Selling Exp.
Ratio (SER)
=

General Exp.
Ratio (GER)
=

5.37%

=

Financial Exp.
Ratio (FER)

=

=
=

=1.1%

=

Interpretation
100 (ROE) has decreased from
34.5% to 30.6% during
2012 to 2013 which means
100=30.6%
that the owners are getting
the lower return on their
capital.
(NPM) has decreased from
26.7% to 21.7% during
2012 to 2013 which means
=21.7%
that the business is getting
worse in controlling its
expenses.
(GPM) has decreased from
43.9% to 37.6% during
2012 to 2013 which means
=37.6%
that the business is getting
worse in controlling its cos
of goods sold expenses.
(SER) has decresed from
3.21% to 3.17% during the
year 2012 to 2013. This
100 = 3.17%
means the company is
getting better in controlling
the selling expenses.
(GER) has increased from
5.37% to 5.79% during the
year 2012 to 2013. This
means that the business is
= 5.79%
getting worse in controlling
the general expenses.
(FER) has increased from
1.1% to 9.6% during 2012
to 2013 which means that
=9.6%
the business is getting
worse in controlling its
financial expenses.

4
Stability
Ratios

=
=1.68:1

=

=

=
=40.3%

= 365

= 365

=365

=365

=5.3 days

=4.4 days

=365

=365

=365

=365

=56 days

=51.3 days

Working
Capital
has
increased from 1.50:1 to
1.68:1 during 2012 to 2013
which means that the ability
to pay off its current
liabilities by using current
assets is getting better. But,
it still doesn’t satisfy to the
minimum ratio of 2:1.
Total Debt has increased
from 32.9% to 40.3% during
the year 2012 to 2013 which
means that the total debt
level has gone up, however
it is still below the
maximum of 50% level.
Stock
Turnover
has
decreased from 5.3 days to
4.4 days during 2012 to
2013 which means that the
business is selling the stocks
faster.
Debtor
Turnover
has
decreased from 56 days to
51.3 days during 2012 to
2013, which means that the
business is getting faster at
collecting its debts.

=

Interest
Coverage
(ICR)

=

=32.9%

Debtor
Turnover
(DTR)

=

=

Stock
Turnover
(ITR)

Interpretation

=1.50:1

Total Debt
(TDR)

2013

=

Working
Capital
(WCR)

2012

=

=

=

= NOT AVAILABLE

=273.3 times

Invest coverage for 2012 is
invalid, however it is 273.3
times for 2013, which
means that the business’s
ability to pay its interest
expenses is very good and it
also does satisfy the
minimum of 5 times
requirement.

5
P/E Ratio
=
=
=13.87

This ratio means that the investor will need to wait nearly 14 years to recoup his
investment.This means that Apple Inc. is not a very good company to invest because it takes
a very long time for the investor to claim back his/her original principle, however the P/E
ratio is not more than 15 and even conservative investor may invest in Apple Inc.

Investment Recommendation
Profitability:
As the gathered data shows, the net profit is getting lower from 2012 to 2013, and it is more
than 11% which is a big reduction during a year. Based on the ratios calculated, the owners
are getting lower return on their capital and also the business is getting worse in controlling
its expenses. Even if Apple is a very big and reliable name, but the information says that this
company is getting worse day by day and investors better to find a more reliable company to
invest.
Stability:
Apple Inc. is doing better in stability and the information says that their ability to pay off its
current liabilities by using current assets is getting better, the business is selling stocks
faster,getting faster in collecting its debt, and the ability to pay its interest expenses is very
good. However, their total debt level has gone up.
Price:
Base on P/E ratio (13.87), this company is still good to invest because it is still below 15, but
after analysing all the other data, we realized that there are so many better choices for
investor to invest and they better to invest on some other company which is more reliable.

6
Appendix

7
8
9
10
11
12
References list


Stein, S. (2014, January 16). Logitect powershell controller battery review. Retrieved
from http://reviews.cnet.com/game-controllers/logitech-powershell-controllerbattery/4505-3146_7-35832650.html



Apple Inc. (2014). Financial history. Retrieved from
http://investor.apple.com/financials.cfm



Reuters. (2013, November 25). Apple inc acquires israeli 3d developer primesense.
Retrieved from http://www.reuters.com/finance/stocks/AAPL.O/keydevelopments/article/2875856



Glen, S. (1996-2014). Company history. Retrieved from http://apple-history.com/h1



MR, B. (2008-2014). ibacon app makes iphone more tasty. Bacon Today. Retrieved
from http://bacontoday.com/ibacon-app-makes-iphone-more-tasty/

13

Ac final by jp

  • 1.
    SCHOOL OF ARCHITECTURE,BUILDING AND DESIGN THE DESIGN SCHOOL FOUNDATION IN NATURAL BUILD ENVIRONMENT TOPIC: FINANCIAL RATIO ANALYSIS GROUP MEMBERS: PARHAM FARHADPOOR MOY CHIN HOONG SUBJECT: 0313698 0314014 BASIC ACCOUNTING (FNBE0145) LECTURER: CHANG JAU HO SUBMISSION DATE: 24th JANUARY 2014 1
  • 2.
    The Introduction Apple Inc.(Apple) was founded by Steve Jobs, Steve Wozniak, and Ronald Wayne on 1 st April, 1976 to develop personal computers, then Applewas incorporated in January 3, 1977 in California.Their main focus was on computers until 2007, they changed their main focus to other electric devices such as mobile phones and tablets. They manufactures, and markets mobile communication and media devices such as iPhone, iPad, iPod, Mac, and apple TV as hard wares while iOS, OS X, and iCloud as softwares. Apple sells and delivers digital content and applications through the iTunes Store®, App Store™, iBooks Store™, and Mac App Store. Apple is the world's top two largest information technology company and world's top three largest mobile phone maker. Recently they introduced iBeacon late last year on devices running iOS 7, the location-sensing technology works by sending off short-range transmitters that notify mobile devices when they are within 100 feet of a beacon. This type of locationsensing technology can be used for indoor navigation, automatic ticketing, and locationrelevant promotions. Besides , Apple has bought Israel-based PrimeSense Ltd, which is a developer of three dimensional chips with the price of $350 million. Apple also introduced IOS Mfi-certified game controlled to solve the problem of a pocket arcade without enough buttons recently. It gives the gamers to have a full game controller-like feeling while playing games with their phone and ipod touch. 2
  • 3.
    The Information neededfor the Calculation of Ratio - 2012 41,733 118,210 156,508 68,662 5,020 8,401 Net Profit O/E Net Sales Gross Profit Selling Expenses General Expenses 1,698 Financial Expenses 791 Inventory 10,930 Debtors 57,653 Total Current Asset 38,542 Total Current Liability 87,846 Total GOGS 78,254 Credit Sales 0 Interest Expense 176,064 Total Asset 57,854 Total Liabilities *All the numbers present in the table are in millions. 2013 37,037 123,549 170,910 64,304 5,415 9,890 16,379 1,764 13,102 73,286 43,658 106,606 85,455 136 207,000 83,451 *Notes:- Total Selling & General Exp. Research & Development Exp. * Total Selling Exp. * Total General Exp. 2012 10,040 2013 10,830 3,381 4,475 = 5,020 ) + 3,381 = 8,401 = 5,415 + 4,475 = 9,890 3
  • 4.
    Ratio Analysis onthe Business Based on the Year 2012 & 2013 Profitability Ratio 2012 2013 100 Return on Equity (ROE) = Net profit Margin (NPM) 100= 34.5% = = = =26.7% = Gross profit Margin (GPM) = = = = =43.9% = x 100 = 3.21% = Selling Exp. Ratio (SER) = General Exp. Ratio (GER) = 5.37% = Financial Exp. Ratio (FER) = = = =1.1% = Interpretation 100 (ROE) has decreased from 34.5% to 30.6% during 2012 to 2013 which means 100=30.6% that the owners are getting the lower return on their capital. (NPM) has decreased from 26.7% to 21.7% during 2012 to 2013 which means =21.7% that the business is getting worse in controlling its expenses. (GPM) has decreased from 43.9% to 37.6% during 2012 to 2013 which means =37.6% that the business is getting worse in controlling its cos of goods sold expenses. (SER) has decresed from 3.21% to 3.17% during the year 2012 to 2013. This 100 = 3.17% means the company is getting better in controlling the selling expenses. (GER) has increased from 5.37% to 5.79% during the year 2012 to 2013. This means that the business is = 5.79% getting worse in controlling the general expenses. (FER) has increased from 1.1% to 9.6% during 2012 to 2013 which means that =9.6% the business is getting worse in controlling its financial expenses. 4
  • 5.
    Stability Ratios = =1.68:1 = = = =40.3% = 365 = 365 =365 =365 =5.3days =4.4 days =365 =365 =365 =365 =56 days =51.3 days Working Capital has increased from 1.50:1 to 1.68:1 during 2012 to 2013 which means that the ability to pay off its current liabilities by using current assets is getting better. But, it still doesn’t satisfy to the minimum ratio of 2:1. Total Debt has increased from 32.9% to 40.3% during the year 2012 to 2013 which means that the total debt level has gone up, however it is still below the maximum of 50% level. Stock Turnover has decreased from 5.3 days to 4.4 days during 2012 to 2013 which means that the business is selling the stocks faster. Debtor Turnover has decreased from 56 days to 51.3 days during 2012 to 2013, which means that the business is getting faster at collecting its debts. = Interest Coverage (ICR) = =32.9% Debtor Turnover (DTR) = = Stock Turnover (ITR) Interpretation =1.50:1 Total Debt (TDR) 2013 = Working Capital (WCR) 2012 = = = = NOT AVAILABLE =273.3 times Invest coverage for 2012 is invalid, however it is 273.3 times for 2013, which means that the business’s ability to pay its interest expenses is very good and it also does satisfy the minimum of 5 times requirement. 5
  • 6.
    P/E Ratio = = =13.87 This ratiomeans that the investor will need to wait nearly 14 years to recoup his investment.This means that Apple Inc. is not a very good company to invest because it takes a very long time for the investor to claim back his/her original principle, however the P/E ratio is not more than 15 and even conservative investor may invest in Apple Inc. Investment Recommendation Profitability: As the gathered data shows, the net profit is getting lower from 2012 to 2013, and it is more than 11% which is a big reduction during a year. Based on the ratios calculated, the owners are getting lower return on their capital and also the business is getting worse in controlling its expenses. Even if Apple is a very big and reliable name, but the information says that this company is getting worse day by day and investors better to find a more reliable company to invest. Stability: Apple Inc. is doing better in stability and the information says that their ability to pay off its current liabilities by using current assets is getting better, the business is selling stocks faster,getting faster in collecting its debt, and the ability to pay its interest expenses is very good. However, their total debt level has gone up. Price: Base on P/E ratio (13.87), this company is still good to invest because it is still below 15, but after analysing all the other data, we realized that there are so many better choices for investor to invest and they better to invest on some other company which is more reliable. 6
  • 7.
  • 8.
  • 9.
  • 10.
  • 11.
  • 12.
  • 13.
    References list  Stein, S.(2014, January 16). Logitect powershell controller battery review. Retrieved from http://reviews.cnet.com/game-controllers/logitech-powershell-controllerbattery/4505-3146_7-35832650.html  Apple Inc. (2014). Financial history. Retrieved from http://investor.apple.com/financials.cfm  Reuters. (2013, November 25). Apple inc acquires israeli 3d developer primesense. Retrieved from http://www.reuters.com/finance/stocks/AAPL.O/keydevelopments/article/2875856  Glen, S. (1996-2014). Company history. Retrieved from http://apple-history.com/h1  MR, B. (2008-2014). ibacon app makes iphone more tasty. Bacon Today. Retrieved from http://bacontoday.com/ibacon-app-makes-iphone-more-tasty/ 13