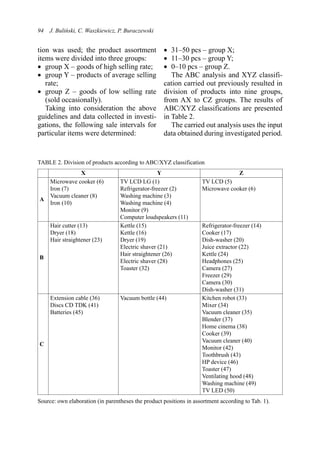
This document discusses using ABC/XYZ analysis to aid in stock planning for a small retail enterprise. It first describes collecting sales data on 50 products over a month. It then performs an ABC analysis on the products based on their total sales value, grouping them into high-value category A products (26% of items, 80.08% of sales), medium-value category B products (38% of items, 14.54% of sales), and low-value category C products (36% of items, 5.38% of sales). Next, it performs an XYZ classification to further group products based on their sales rates, identifying high-rate category X products, average-rate category Y products, and low-rate category
This presentation includes:
What is inventory?
Cost calculation of inventory
Cost formula
The objective of inventory management
Different methods of inventory cost calculation with examples
Refresher of basic Materials Management terms. Sometimes the simple things are all that matters. These slides are easy to understand and would remind you what SAP MM is all about.
How to activate SAP ATP check for Sales Order, when you place item in sales order. Getting the material's supply and demand information,then meet customer's request delivery date.
For the typical warehouse operation picking processes account for nearly 40-50% of total warehousing and distribution costs. Due to the significant financial impact picking is a critical area of focus for many supply chain operators. The supply chain industry is large and complex, as is each individual 3PL, warehouse, distribution center, manufacturer or retail that operates within it. For this reason there is no single picking method that will fit each individual supply chain. Any picking strategy or combination of picking strategies may be used. Some of the most commonly utilized picking strategies include batch, wave, cluster, piece, zone and sortation picking. The most basic picking strategy, piece picking, is the process of pulling inventory for a single order. The ratio for this method is one picker to one order. Batch picking is more complex. Using this method a picker will pull inventory from multiple orders into one large container or tote. Once all orders have been picked the inventory will be taken to a staging area where orders will be separated into their corresponding containers. Cluster picking is similar to batch picking in that multiple orders are picked simultaneously, but are picked directly into their corresponding containers rather than a group tote. This eliminates the added labor required to separate orders in the staging area. Wave picking is a method facilitated by warehouse management technology. Groups of orders are released in “waves” on a schedule to ensure labor is evenly distributed throughout the work day. Both wave length and frequency is determined by staff availability and daily workload. Zone picking is an inventory picking method where staff are designated to zones in the warehouse and only pick from those areas. Zones can be designated by groupings of SKUs or by aisle. Using this method multiple orders will be picked from each zone simultaneously. This method allows for inventory handling specialization by employee where necessary. Sortation picking is reserved for supply chain operations with the existing automated storage and retrieval system architecture. In this method inventory is brought to pickers via a conveyor system where they put items into their corresponding containers. This significantly reduces the labor hours required to complete order fulfillment activities. The final picking strategy is picking to box. In this method pickers remain at their designated station and place items into boxes as they move past on a conveyor system. Each box may visit multiple picking stations before order fulfillment is complete. To learn more about which picking strategy may be best for your business contact Datex for a no obligation operational assessment.
In ancient India the sources of drugs were of vegetable, animal and mineral origin.(Ayurveda).They were prepared empirically by few experienced persons. Knowledge of that medical system was usually kept secret within a family (Folkore).There were no scientific methods of standardization of drugs.
What is the best Healthcare Data Warehouse Model for Your Organization?Health Catalyst
Join Steve Barlow as he addresses the strengths and weaknesses of each of the following three primary Data Model approaches for data warehousing in healthcare:
1. Enterprise Data Model
2. Independent Data Marts
3. Late-binding Solutions
Statistical quality control applied industrial and manufacturing operations. Case study regarding the use of these tools. Description of statistical tools used in quality control and inspection.
ANALYZING THE PROCESS CAPABILITY FOR AN AUTO MANUAL TRANSMISSION BASE PLATE M...ijmvsc
The industry today is working intensively on a goal-oriented way towards introducing regular studies in
manufacturing. The current study is part of a large overall spanning project aiming towards an increase in
productivity, i.e. more products produced per year with availability. In this paper we have analyze what
Process Capability is and how it is implemented on a current process. All the steps are listed out in an easy
to understand manner. In current scenario, specifications for products have been tightened due to
performance competition in market. Statistical tools like control charts, process capability analysis and
cause and effect diagram ensure that processes are fit for company specifications while reduce the process
variation and improve product quality characteristic. Process capability indices (PCIs) are used in the
manufacturing process to provide numerical measures on whether a process is capable of producing items
within the predetermined limits. For the analysis purpose MINITAB 16.0 is used and is found that the
process is placed exactly at the centre of the control limits. Analysis also shows that process is not
adequate. The cause and effect diagram is prepared to found out the root cause of variation in diameter of
work. In this study, a process-capability analysis was also carried out in a medium-sized company that
produces machine and spare parts.
In thsi slide EOQ calculation, safety inventory, reorder point, lead time, ELS calculation, Incremental Analysis, ABC system analysis along with theoretical description and explanation is given about how inventories is managed in the electronic industries.
Business game - Polimi (three-year bachelor thesis)filippo cheli
This report represents the final deliverable of a Business Game about a manifacture firm "Cadrega SpA".
The Business Game is the thesis for the three-year bachelor at Politecnico of Milan for students attending management engineering.
Management AccountingActivity Based Costing vs Absorption Cost.docxinfantsuk
Management Accounting
Activity Based Costing vs Absorption Costing
Table of Contents
Budgeted Profit Statements 1
1.1 Absorption Costing 1
1.2 Activity Based Costing 3
1.3 Comments on the results 5
2.0 Discussion of the statement 6
References 9
0
2
1.0 Budgeted Profit Statements
1.1 Absorption Costing
Traditional absorption costing involves the calculation of product cost, using direct and indirect variable costs and fixed and variable overheads, which are substituted over the complete production. Overhead cost substitution is based upon the process activity that drives the cost. Machine hours and assembly hours are two example activities that influence product development; overheads are allocated based upon the hours consumed in each department.
The following table summarises the activity levels involved in the production process:
Product
Units
Machine (Hours)
Assembly (Hours)
Setups
Orders
Suppliers
XYI
50,000
100,000
350,000
120
8,000
3,000
YZT
40,000
200,000
120,000
200
8,000
4,000
ABW
30,000
120,000
60,000
200
16,000
4,200
Total
120,000
420,000
530,000
520
32,000
11,200
When the cost is allocated to each product, finding each product’s contribution towards overhead provides a clearer picture. The following table summarises the total contributions of the three products.
Total Contribution
Products
Selling Price (£)
(1)
Cost Price (£)
(2)
Contribution (£)
(3)= (1)-(2)
Units
(4)
Total Contribution (5)= (3)x(4)
XYI
45
32
13
50,000
650,000
YZT
95
84
11
40,000
440,000
ABW
73
65
8
30,000
240,000
The absorption rate on which the overhead cost is allocated to the products is also important in making the profit and loss statement. Since this involves two significant activities, the overhead is allocated over these two cost drivers.
· O/H Absorption rate (Machine Hours)
Overheads / machine hours = £504,000 / 420,000 = £1.20/hour
· O/H Absorption rate (Assembly Hours)
Overheads / assembly hours = £437,000 / 530,000 = £0.8245/hour
Based upon absorption rates, the following table summarises the division of overhead costs over the three products.
Machine Hours
Assembly Hours
Products
Hours
(1)
Rate
(2)
Overheads
(3)=(1)*(2)
Hours
(4)
Rate
(5)
Overheads
(6)=(4)*(5)
Total O/H
(7)=(3)+(6)
XYI
100,000
1.20
120,000
350,000
0.8245
288,575
408,575
YZT
200,000
1.20
240,000
120,000
0.8245
98,940
298,940
ABW
120,000
1.20
144,000
60,000
0.8245
49,470
169,470
504,000
436,985
940,985
· Statement of Profit / (Loss)
Using Absorption Costing Method
Revenue
XYI
YZT
ABW
(1) Units
50,000 units
40,000 units
30,000 units
(£)
(£)
(£)
(£)
(2) Sale Price
45
95
73
(3) Cost Price
32
84
65
(4) Contribution (2) – (3)
13
11
8
Total Contribution (4) * (1)
650,000
440,000
240,000
1,330,000
Overheads *
(408,575)
(298,940)
(169,470)
(940,985)
Net Profit
241,425
101,060
46,530
389,015
1.2 Activity Based Costing
The focus of activity based costing is upon departmentalizing overheads cost; this cost can be attributed to th ...
AN OPTIMIZING INTEGRATED INVENTORY MODEL WITH INVESTMENT FOR QUALITY IMPROVEM...IJITCA Journal
This paper presents a vendor-buyer integrated inventory model. This paper considers the problem of a vendor and buyer integrated production inventory model for the vendor and the buyer optimization model under quality improvement investment and setup cost reduction in the production system such that the total profit is maximized. The relationship between demand and price is considered as a linear. Entirety profit is the supply chain presentation calculate and it is calculated as the dissimilarity among revenue from sales and total cost, where the last is the sum of the vendor’s and buyer’s setup/order and inventory holding costs, opportunity in setup cost and opportunity investment cost. This manuscript efforts to conclude the optimal production run time and capital investments in setup cost reduction and process quality improvement for production system such that the total profit is maximized. The main focus for this paper is the setup cost reduction and investment for quality improvement. The proposed model is based on the integrated total profit for both buyer and vendor which find out the optimal value of order quantity, opportunity investment cost for quality improvement and setup cost reduction. The solution procedure is developed in order to find the total profit of the vendor and the buyer which is to be maximized. To conclude, a numerical example is given to demonstrate the solution procedure.
AN OPTIMIZING INTEGRATED INVENTORY MODEL WITH INVESTMENT FOR QUALITY IMPROVEM...IJITCA Journal
This paper presents a vendor-buyer integrated inventory model. This paper considers the problem of a vendor and buyer integrated production inventory model for the vendor and the buyer optimization model
under quality improvement investment and setup cost reduction in the production system such that the total
profit is maximized. The relationship between demand and price is considered as a linear. Entirety profit is
the supply chain presentation calculate and it is calculated as the dissimilarity among revenue from sales
and total cost, where the last is the sum of the vendor’s and buyer’s setup/order and inventory holding
costs, opportunity in setup cost and opportunity investment cost. This manuscript efforts to conclude the
optimal production run time and capital investments in setup cost reduction and process quality
improvement for production system such that the total profit is maximized. The main focus for this paper is
the setup cost reduction and investment for quality improvement. The proposed model is based on the
integrated total profit for both buyer and vendor which find out the optimal value of order quantity,
opportunity investment cost for quality improvement and setup cost reduction. The solution procedure is
developed in order to find the total profit of the vendor and the buyer which is to be maximized. To conclude, a numerical example is given to demonstrate the solution procedure.
NO1 Uk best vashikaran specialist in delhi vashikaran baba near me online vas...Amil Baba Dawood bangali
Contact with Dawood Bhai Just call on +92322-6382012 and we'll help you. We'll solve all your problems within 12 to 24 hours and with 101% guarantee and with astrology systematic. If you want to take any personal or professional advice then also you can call us on +92322-6382012 , ONLINE LOVE PROBLEM & Other all types of Daily Life Problem's.Then CALL or WHATSAPP us on +92322-6382012 and Get all these problems solutions here by Amil Baba DAWOOD BANGALI
#vashikaranspecialist #astrologer #palmistry #amliyaat #taweez #manpasandshadi #horoscope #spiritual #lovelife #lovespell #marriagespell#aamilbabainpakistan #amilbabainkarachi #powerfullblackmagicspell #kalajadumantarspecialist #realamilbaba #AmilbabainPakistan #astrologerincanada #astrologerindubai #lovespellsmaster #kalajaduspecialist #lovespellsthatwork #aamilbabainlahore#blackmagicformarriage #aamilbaba #kalajadu #kalailam #taweez #wazifaexpert #jadumantar #vashikaranspecialist #astrologer #palmistry #amliyaat #taweez #manpasandshadi #horoscope #spiritual #lovelife #lovespell #marriagespell#aamilbabainpakistan #amilbabainkarachi #powerfullblackmagicspell #kalajadumantarspecialist #realamilbaba #AmilbabainPakistan #astrologerincanada #astrologerindubai #lovespellsmaster #kalajaduspecialist #lovespellsthatwork #aamilbabainlahore #blackmagicforlove #blackmagicformarriage #aamilbaba #kalajadu #kalailam #taweez #wazifaexpert #jadumantar #vashikaranspecialist #astrologer #palmistry #amliyaat #taweez #manpasandshadi #horoscope #spiritual #lovelife #lovespell #marriagespell#aamilbabainpakistan #amilbabainkarachi #powerfullblackmagicspell #kalajadumantarspecialist #realamilbaba #AmilbabainPakistan #astrologerincanada #astrologerindubai #lovespellsmaster #kalajaduspecialist #lovespellsthatwork #aamilbabainlahore #Amilbabainuk #amilbabainspain #amilbabaindubai #Amilbabainnorway #amilbabainkrachi #amilbabainlahore #amilbabaingujranwalan #amilbabainislamabad
CFD Simulation of By-pass Flow in a HRSG module by R&R Consult.pptxR&R Consult
CFD analysis is incredibly effective at solving mysteries and improving the performance of complex systems!
Here's a great example: At a large natural gas-fired power plant, where they use waste heat to generate steam and energy, they were puzzled that their boiler wasn't producing as much steam as expected.
R&R and Tetra Engineering Group Inc. were asked to solve the issue with reduced steam production.
An inspection had shown that a significant amount of hot flue gas was bypassing the boiler tubes, where the heat was supposed to be transferred.
R&R Consult conducted a CFD analysis, which revealed that 6.3% of the flue gas was bypassing the boiler tubes without transferring heat. The analysis also showed that the flue gas was instead being directed along the sides of the boiler and between the modules that were supposed to capture the heat. This was the cause of the reduced performance.
Based on our results, Tetra Engineering installed covering plates to reduce the bypass flow. This improved the boiler's performance and increased electricity production.
It is always satisfying when we can help solve complex challenges like this. Do your systems also need a check-up or optimization? Give us a call!
Work done in cooperation with James Malloy and David Moelling from Tetra Engineering.
More examples of our work https://www.r-r-consult.dk/en/cases-en/
Water scarcity is the lack of fresh water resources to meet the standard water demand. There are two type of water scarcity. One is physical. The other is economic water scarcity.
Hybrid optimization of pumped hydro system and solar- Engr. Abdul-Azeez.pdffxintegritypublishin
Advancements in technology unveil a myriad of electrical and electronic breakthroughs geared towards efficiently harnessing limited resources to meet human energy demands. The optimization of hybrid solar PV panels and pumped hydro energy supply systems plays a pivotal role in utilizing natural resources effectively. This initiative not only benefits humanity but also fosters environmental sustainability. The study investigated the design optimization of these hybrid systems, focusing on understanding solar radiation patterns, identifying geographical influences on solar radiation, formulating a mathematical model for system optimization, and determining the optimal configuration of PV panels and pumped hydro storage. Through a comparative analysis approach and eight weeks of data collection, the study addressed key research questions related to solar radiation patterns and optimal system design. The findings highlighted regions with heightened solar radiation levels, showcasing substantial potential for power generation and emphasizing the system's efficiency. Optimizing system design significantly boosted power generation, promoted renewable energy utilization, and enhanced energy storage capacity. The study underscored the benefits of optimizing hybrid solar PV panels and pumped hydro energy supply systems for sustainable energy usage. Optimizing the design of solar PV panels and pumped hydro energy supply systems as examined across diverse climatic conditions in a developing country, not only enhances power generation but also improves the integration of renewable energy sources and boosts energy storage capacities, particularly beneficial for less economically prosperous regions. Additionally, the study provides valuable insights for advancing energy research in economically viable areas. Recommendations included conducting site-specific assessments, utilizing advanced modeling tools, implementing regular maintenance protocols, and enhancing communication among system components.
Sachpazis:Terzaghi Bearing Capacity Estimation in simple terms with Calculati...Dr.Costas Sachpazis
Terzaghi's soil bearing capacity theory, developed by Karl Terzaghi, is a fundamental principle in geotechnical engineering used to determine the bearing capacity of shallow foundations. This theory provides a method to calculate the ultimate bearing capacity of soil, which is the maximum load per unit area that the soil can support without undergoing shear failure. The Calculation HTML Code included.
About
Indigenized remote control interface card suitable for MAFI system CCR equipment. Compatible for IDM8000 CCR. Backplane mounted serial and TCP/Ethernet communication module for CCR remote access. IDM 8000 CCR remote control on serial and TCP protocol.
• Remote control: Parallel or serial interface.
• Compatible with MAFI CCR system.
• Compatible with IDM8000 CCR.
• Compatible with Backplane mount serial communication.
• Compatible with commercial and Defence aviation CCR system.
• Remote control system for accessing CCR and allied system over serial or TCP.
• Indigenized local Support/presence in India.
• Easy in configuration using DIP switches.
Technical Specifications
Indigenized remote control interface card suitable for MAFI system CCR equipment. Compatible for IDM8000 CCR. Backplane mounted serial and TCP/Ethernet communication module for CCR remote access. IDM 8000 CCR remote control on serial and TCP protocol.
Key Features
Indigenized remote control interface card suitable for MAFI system CCR equipment. Compatible for IDM8000 CCR. Backplane mounted serial and TCP/Ethernet communication module for CCR remote access. IDM 8000 CCR remote control on serial and TCP protocol.
• Remote control: Parallel or serial interface
• Compatible with MAFI CCR system
• Copatiable with IDM8000 CCR
• Compatible with Backplane mount serial communication.
• Compatible with commercial and Defence aviation CCR system.
• Remote control system for accessing CCR and allied system over serial or TCP.
• Indigenized local Support/presence in India.
Application
• Remote control: Parallel or serial interface.
• Compatible with MAFI CCR system.
• Compatible with IDM8000 CCR.
• Compatible with Backplane mount serial communication.
• Compatible with commercial and Defence aviation CCR system.
• Remote control system for accessing CCR and allied system over serial or TCP.
• Indigenized local Support/presence in India.
• Easy in configuration using DIP switches.
Saudi Arabia stands as a titan in the global energy landscape, renowned for its abundant oil and gas resources. It's the largest exporter of petroleum and holds some of the world's most significant reserves. Let's delve into the top 10 oil and gas projects shaping Saudi Arabia's energy future in 2024.
Student information management system project report ii.pdfKamal Acharya
Our project explains about the student management. This project mainly explains the various actions related to student details. This project shows some ease in adding, editing and deleting the student details. It also provides a less time consuming process for viewing, adding, editing and deleting the marks of the students.
Governing Equations for Fundamental Aerodynamics_Anderson2010.pdf
Abc & xyz analysis
1. Annals of Warsaw University of Life Sciences – SGGW
Agriculture No 61 (Agricultural and Forest Engineering) 2013: 89–96
(Ann. Warsaw Univ. of Life Sci. – SGGW, Agricult. 61, 2013)
Utilization of ABC/XYZ analysis in stock planning
in the enterprise
JERZY BULIŃSKI, CZESŁAW WASZKIEWICZ, PIOTR BURACZEWSKI
Department of Agricultural and Forest Machinery, Warsaw University of Life Sciences – SGGW
Abstract: Utilization of ABC/XYZ analysis in
stock planning in the enterprise. Utilization of
ABC and XYZ analysis in the process of product
stock management in trade enterprise is presented.
Basing on the product list and information con-nected
with the sale level, the goods were grouped
into categories and priority levels in the decision
problem solving were pointed out in order to
achieve better financial results.
Key words: stock, stock planning, ABC/XYZ
analysis.
INTRODUCTION
The object subjected to analysis is an en-terprise
that sells the goods of household,
radio and television and multimedia. The
firm has been operating on the market
since 2002 and is situated in Mazovian
province. It is an administration subject
within the private sector and is repre-sented
by natural person; according to
valid classification [Chmielewski 1997]
it can be counted among the small enter-prises.
It operates the branch retail trade
that is limited to household goods and
electronic equipment. The enterprise’s
organization structure has not expanded
form and all employees are directly sub-ordinated
to the owner.
METHODOLOGY
In undertaken activity connected with
stock management there can be distin-guished
several stages. The first one
includes observations and collecting
information on the sale level of offered
goods within the investigated month. At
this stage there are obtained numerical
data that are characteristic for the demand
for particular products offered by the
enterprise. Interpretation of these data
enables to obtain the valuable informa-tion
for working out the strategy for fur-ther
activity and possibility of enterprise
development. The ABC/XYZ analysis is
one of the methods used in this respect.
The collected data were arranged ac-cording
to cumulated value and sale’s
volume. The analysis principle was based
on the Lorenz curve diagram. One of the
two described models for restocking of
the selected products was assumed on the
basis of classification. Considering that
the small storage area in the analyzed en-terprise
limits the stock volume needed to
assure a high level of customer’s service,
the rational stock management becomes
especially important.
METHOD FOR RESTOCKING
Apart from the two main methods for re-stocking
(the system that uses a constant
order volume and the system of periodic
inspection) there exist the modified ver-sions
of models, including the method of
2. 90 J. Buliński, C. Waszkiewicz, P. Buraczewski
constant volume and constant intervals
of orders, applied at the known demand.
Considering uncertain level of demand,
the investigated enterprise uses the irre-gular
volume and irregular time intervals
between orders. This method is based on
the “pull” system that considers, first of
all, the demand size [Bardi et al. 2002],
as opposed to the “push” system that
considers mainly the demand prognosis.
Restocking in this system is performed
according to timetable undertaken in
advance, thus, it is better organized. It is
most often used at the dependent demand
and when delayed supplies can occur
[Bowersox et al. 1986].
The „pull” system is used mainly at
independent demand. The most impor-tant
advantage of restocking models
based on this system is the ability for
efficient responding to the market needs.
If the stock of certain product is too small
or totally used up, the subsequent order
is submitted. In respect of coordination,
this system comes true in the single sale
shops far better than in the expanded nets
of distribution. On the other hand, such
method does not provide a high level of
customer service, since the order sub-mitted
in reaction to the lack of a given
product does not assure its continuous
availability; this method for restocking
can bring about the negative effects of
possible stock exhaustion.
ANALYSIS OF DEMAND
FOR THE SELECTED PRODUCTS
The point of issue for determination
a good restocking system should be
the detailed analysis of demand to get
information on particular products and
trends of changes [Pierścionek 1997].
The demand can depend on the price
for a given good; the lower it is, the
more often a product can be purchased
[Koptiew et al. 2002]. It is also shaped
by incentives independent of the dealer,
e.g. income level of society, number of
potential consumers on the market, com-petition
in the form of substitute goods
availability [Wojciechowski 2007]. The
initial stage of demand analysis can be
the ABC/XYZ analysis, that describes
the nature of changes in selling the
products.
ABC/XYZ ANALYSIS
The main task of all enterprises is making
large selection of products in sufficient
quantities available to the customers
[Błaszczyk 2005]. The enterprise offers
a wide assortments of goods. Manage-ment
of many items calls for division
into goods of lower and higher strategic
importance for the enterprise. Such
need was first observed by H.F. Dicky,
who found that such classification can
be performed in order to determine the
purchase policy, production planning
and store management [Brown 1982].
The ABC/XYZ analysis that serves this
purpose consists of ABC analysis and
XYZ classification.
ABC ANALYSIS
The ABC analysis facilitates arrange-ment
of products or materials into sets
in consideration of a given criterion. It
enables to manage the assortment groups
without consideration to single elements
that can be in large quantities. The as-signment
can be made according to fol-lowing
criteria: value of sale, demand for
3. Utilization of ABC/XYZ analysis in stock planning... 91
a give product or rotation [http://www.
logistica].
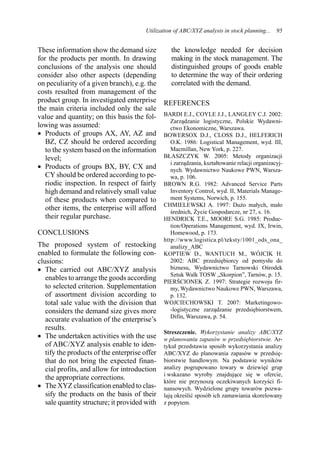
Data for ABC analysis were worked
out for 50 items (Tab. 1) of the sale offer;
as a criterion of division the sale income
was assumed. There was made a list con-taining
the values of sale (Ws) arranged
in the column starting from the biggest
one, calculated on the basis of unitary
price (Cj) and number of sold products
(S). The obtained value were the basis for
determination of the percent share (uWs)
of particular products in the sale volume
and cumulated sale values (sWs). No full
names or designations of analyzed pro-ducts
are given in the Table, with respect
to constraints connected with data confi-dentiality.
In the obtained cumulated sale value
one can distinguish three groups of pro-ducts:
• Group A – includes 13 products (26%)
of sale share 80.08%;
• Group B – includes 19 products (38%)
of cumulated share value 14.54%;
• Group C – includes 18 products (36%)
of cumulated share value 5.38%.
It confirms the Pareto’s principle,
which says that in empirical problems
usually about 20–30% of reasons lead to
TABLE 1. Distribution of trade offer products according to ABC analysis
No Product
Unitary
price (Cj) [zł]
Sale (S) [pcs]
Sale value
(Ws) [PLN]
Sale ratio
Ws [%]
Cumulated
share Ws [%]
Group
1 2 3 4 5 6 7 8
1 TV LCD 1 449.0 29 42 021.00 18.48 18.48
A
2 Refrigerator-freezer 1 399.00 22 30 778.00 13.53 32.01
3 Washing machine 959.00 18 17 262.00 7.59 39.6
4 Washing machine 999.00 16 15 984.00 7.03 46.63
5 TV LCD 1 699.00 8 13 592.00 5.98 52.61
6 Microwave cooker 329.00 35 11 515.00 5.06 57.67
7 Iron 279.00 37 10 323.00 4.54 62.21
8 Vacuum cleaner 299.00 33 9 867.00 4.34 66.55
9 Monitor 369.00 23 8 487.00 3.73 70.28
10 Iron 189.00 42 7 938.00 3.49 73.77
11 Computer loudspeakers 269.00 29 7 801.00 3.43 77.2
12 Microwave cooker 349.00 10 3 490.00 1.53 78.73
13 Hair cutter 99.00 31 3 069.00 1.35 80.08
14 Refrigerator-freezer 1 099.00 2 2 198.00 0.97 81.05
B
15 Kettle 199.00 11 2 189.00 0.96 82.01
16 Kettle 99.00 22 2 178.00 0.96 82.97
17 Cooker 1 059.00 2 2 118.00 0.93 83.9
18 Dryer 49.00 43 2 107.00 0.93 84.83
19 Dryer 189.00 11 2 079.00 0.91 85.74
20 Dish-washer 999.00 2 1 998.00 0.88 86.62
4. 92 J. Buliński, C. Waszkiewicz, P. Buraczewski
Table 1. (continued)
1 2 3 4 5 6 7 8
21 Electric shaver 99.00 20 1 980.00 0.87 87.49
22 Juice extractor 189.00 10 1 890.00 0.83 88.32
23 Hair straightener 52.00 35 1 820.00 0.8 89.1
24 Kettle 249.00 7 1 743.00 0.7 89.89
25 Headphones 169.00 10 1 690.00 0.74 90.6
26 Curler 75.00 22 1 650.00 0.72 91.3
27 Camera 749.00 2 1 498.00 0.66 92.01
28 Electric shaver 119.00 12 1 428.00 0.63 92.64
29 Freezer 1 289.00 1 1 289.00 0.57 93.21
30 Camera 279.00 4 1 116.00 0.49 93.7
31 Dish-washer 1 099.00 1 1 099.00 0.48 94.18
32 Toaster 59.00 17 1 003.00 0.44 94.62
33 Kitchen robot 499.00 2 998.00 0.44 95.06
34 Mixer 249.00 4 996.00 0.44 95.5
35 Vacuum cleaner 319.00 3 957.00 0.42 95.92
36 Extension cable 5 m 27.99 34 951.66 0.42 96.34
37 Blender 189.00 5 945.00 0.4 96.75
38 Home cinema 899.00 1 899.00 0.4 97.15
39 Cooker 869.00 1 869.00 0.38 97.53
40 Vacuum cleaner 119.00 7 833.00 0.37 97.9
41 CD-RX discs 16.99 49 832.51 0.37 98.27
42 Monitor LG 799.00 1 799.00 0.35 98.62
43 Toothbrush 79.00 10 790.00 0.35 98.97
44 Vacuum bottle 54.90 12 658.80 0.29 99.26
45 Batteries Duracell 9.99 57 569.43 0.25 99.51
46 HP device 189.00 3 567.00 0.25 99.76
47 Toaster 179.00 2 358.00 0.16 99.92
48 Ventilating hood 189.00 1 189.00 0.08 100
49 Washing machine 1 469.00 0 0.00 0 100
50 TV LED 2 469.00 0 0.00 0 100
STOTAL 227 412.40 100
about 70–80% of results [Hendrick 1985].
In the case of investigated enterprise, the
sale results (numerical or financial) can
be determined by a small part (26%) of
products offered.
Information from the above Table can
be presented graphically for better illus-tration.
Dependence of total sale value
B
C
on the number of assortment items is
presented on the diagram in the form of
Lorenz curve (Fig. 1).
The carried out ABC analysis and
the obtained results enable to group the
products into categories. By identification
and evaluation of significance of the ana-lyzed
problems, the results provide the
Source: own elaboration.
5. Utilization of ABC/XYZ analysis in stock planning... 93
Number of assortment position
FIGURE 1. Lorenz curve for analyzed assortment items (own elaboration)
basis for determination priority levels
in solving of the decision problem to
achieve better effects. It is evident from
the analysis that basic concentration of
activities should be focused on a small
set of 13 products (26%) that provide
the enterprise with about 80% of the sale
value. The group B includes 19 products
(38%) that bring smaller profit to enter-prise
(14.54% of the sale value). Pro-ducts
of this group are less important for
the enterprise, thus, it should be consid-ered
if activities towards improvement
of situation (demand analysis, evaluation
of the reasons for low sale, evaluation of
the market and competitors, etc.) should
not be performed in a later period. The
analysis also pointed out at 18 products
(36%) of small effect on the sale value
(5.38%), where undertaking activities
that force the enterprise to financial or
organization efforts could be inexpedient
or should be preceded with the economic
or organization analysis. However, it
happens that incorrect conclusions are
drawn from the ABC analysis, e.g. when
the whole attention is paid to group A,
while groups B and C are treated casu-ally.
In the case of a trade enterprise it
can result in situation, when the product
stock of these two groups are inacces-sible
for the customers. In addition it is
possible that at the change in demand
structure, the non-assignable products
of C group will be sold in future in far
bigger quantities. It means that a proper
importance should be put down to par-ticular
groups in order to be informed
on current situation and be able to use
appropriate solutions in stock manage-ment
in the nick of time. Besides, in the
case of availability of data that cover the
longer period, it is possible to investigate
the demand changes with time and the
potential trends or seasonal changes.
XYZ CLASSIFICATION
The XYZ classification is a modification
of ABC analysis and consists in classifi-cation
of products (in the case of a trade
enterprise), based on the structure (rate)
of their selling; therefore, it provides
with the knowledge essential in decision
making in stock management. Apart
from the assumed criterion according to
the value (BC analysis), to achieve better
segmentation of products one should
divide them also according to the sale
quantity. To this end the XYZ classifica-
Cumulated sale value SWs (%)
6. 94 J. Buliński, C. Waszkiewicz, P. Buraczewski
tion was used; the product assortment
items were divided into three groups:
• group X – goods of high selling rate;
• group Y – products of average selling
rate;
• group Z – goods of low selling rate
(sold occasionally).
Taking into consideration the above
guidelines and data collected in investi-gations,
the following sale intervals for
particular items were determined:
• 31–50 pcs – group X;
• 11–30 pcs – group Y;
• 0–10 pcs – group Z.
The ABC analysis and XYZ classifi-cation
carried out previously resulted in
division of products into nine groups,
from AX to CZ groups. The results of
ABC/XYZ classifications are presented
in Table 2.
The carried out analysis uses the input
data obtained during investigated period.
TABLE 2. Division of products according to ABC/XYZ classification
X Y Z
A
Microwave cooker (6)
Iron (7)
Vacuum cleaner (8)
Iron (10)
TV LCD LG (1)
Refrigerator-freezer (2)
Washing machine (3)
Washing machine (4)
Monitor (9)
Computer loudspeakers (11)
TV LCD (5)
Microwave cooker (6)
B
Hair cutter (13)
Dryer (18)
Hair straightener (23)
Kettle (15)
Kettle (16)
Dryer (19)
Electric shaver (21)
Hair straightener (26)
Electric shaver (28)
Toaster (32)
Refrigerator-freezer (14)
Cooker (17)
Dish-washer (20)
Juice extractor (22)
Kettle (24)
Headphones (25)
Camera (27)
Freezer (29)
Camera (30)
Dish-washer (31)
C
Extension cable (36)
Discs CD TDK (41)
Batteries (45)
Vacuum bottle (44) Kitchen robot (33)
Mixer (34)
Vacuum cleaner (35)
Blender (37)
Home cinema (38)
Cooker (39)
Vacuum cleaner (40)
Monitor (42)
Toothbrush (43)
HP device (46)
Toaster (47)
Ventilating hood (48)
Washing machine (49)
TV LED (50)
Source: own elaboration (in parentheses the product positions in assortment according to Tab. 1).
7. Utilization of ABC/XYZ analysis in stock planning... 95
These information show the demand size
for the products per month. In drawing
conclusions of the analysis one should
consider also other aspects (depending
on peculiarity of a given branch), e.g. the
costs resulted from management of the
product group. In investigated enterprise
the main criteria included only the sale
value and quantity; on this basis the fol-lowing
was assumed:
• Products of groups AX, AY, AZ and
BZ, CZ should be ordered according
to the system based on the information
level;
• Products of groups BX, BY, CX and
CY should be ordered according to pe-riodic
inspection. In respect of fairly
high demand and relatively small value
of these products when compared to
other items, the enterprise will afford
their regular purchase.
CONCLUSIONS
The proposed system of restocking
enabled to formulate the following con-clusions:
• The carried out ABC/XYZ analysis
enables to arrange the goods according
to selected criterion. Supplementation
of assortment division according to
total sale value with the division that
considers the demand size gives more
accurate evaluation of the enterprise’s
results.
• The undertaken activities with the use
of ABC/XYZ analysis enable to iden-tify
the products of the enterprise offer
that do not bring the expected finan-cial
profits, and allow for introduction
the appropriate corrections.
• The XYZ classification enabled to clas-sify
the products on the basis of their
sale quantity structure; it provided with
the knowledge needed for decision
making in the stock management. The
distinguished groups of goods enable
to determine the way of their ordering
correlated with the demand.
REFERENCES
BARDI E.J., COYLE J.J., LANGLEY C.J. 2002:
Zarządzanie logistyczne, Polskie Wydawni-ctwo
Ekonomiczne, Warszawa.
BOWERSOX D.J., CLOSS D.J., HELFERICH
O.K. 1986: Logistical Management, wyd. III,
Macmillan, New York, p. 227.
BŁASZCZYK W. 2005: Metody organizacji
i zarządzania, kształtowanie relacji organizacyj-nych.
Wydawnictwo Naukowe PWN, Warsza-wa,
p. 106.
BROWN R.G. 1982: Advanced Service Parts
Inventory Control, wyd. II, Materials Manage-ment
Systems, Norwich, p. 155.
CHMIELEWSKI A. 1997: Dużo małych, mało
średnich, Życie Gospodarcze, nr 27, s. 16.
HENDRICK T.E., MOORE S.G. 1985: Produc-tion/
Operations Management, wyd. IX, Irwin,
Homewood, p. 173.
http://www.logistica.pl/teksty/1001_ods_ona_
analizy_ABC
KOPTIEW D., WANTUCH M., WÓJCIK H.
2002: ABC przedsiębiorcy od pomysłu do
biznesu, Wydawnictwo Tarnowski Ośrodek
Sztuk Walk TOSW „Skorpion”, Tarnów, p. 15.
PIERŚCIONEK Z. 1997: Strategie rozwoju fir-my,
Wydawnictwo Naukowe PWN, Warszawa,
p. 132.
WOJCIECHOWSKI T. 2007: Marketingowo-
-logistyczne zarządzanie przedsiębiorstwem,
Difin, Warszawa, p. 54.
Streszczenie. Wykorzystanie analizy ABC/XYZ
w planowaniu zapasów w przedsiębiorstwie. Ar-tykuł
przedstawia sposób wykorzystania analizy
ABC/XYZ do planowania zapasów w przedsię-biorstwie
handlowym. Na podstawie wyników
analizy pogrupowano towary w dziewięć grup
i wskazano wyroby znajdujące się w ofercie,
które nie przynoszą oczekiwanych korzyści fi-nansowych.
Wydzielone grupy towarów pozwa-lają
określić sposób ich zamawiania skorelowany
z popytem.
8. 96 J. Buliński, C. Waszkiewicz, P. Buraczewski
MS. received October 2012
Authors’ address:
Czesław Waszkiewicz
Jerzy Buliński
Wydział Inżynierii Produkcji SGGW
Katedra Maszyn Rolniczych i Leśnych
02-787 Warszawa, ul. Nowoursynowska 166
Poland
e-mail: kmrl@sggw.pl