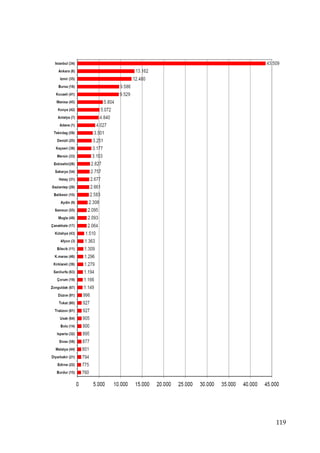
This document presents a hazardous waste management concept for Turkey. It begins with an introduction to Turkey's legislative framework and stakeholders involved in hazardous waste management. It then analyzes the development of Turkey's hazardous waste management system and provides an overview of the current situation. The document estimates the quantity and types of hazardous waste generated in Turkey and assigns waste types to appropriate disposal options. It concludes with recommendations, including developing integrated hazardous waste treatment facilities in five regions of the country.
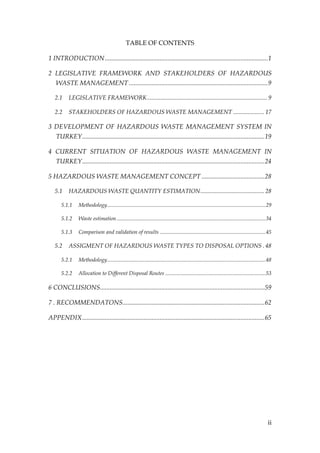
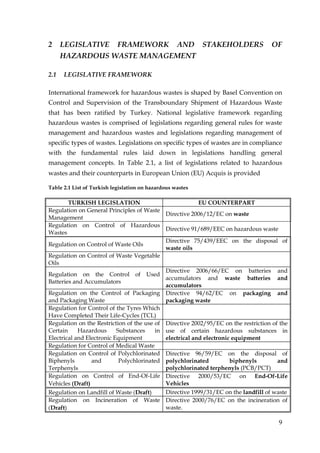
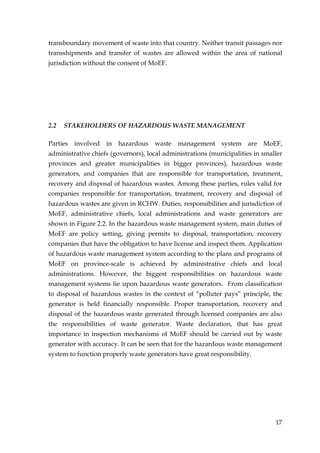
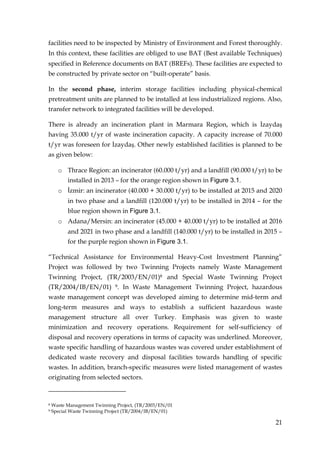
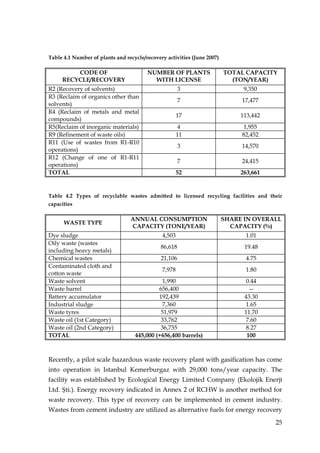
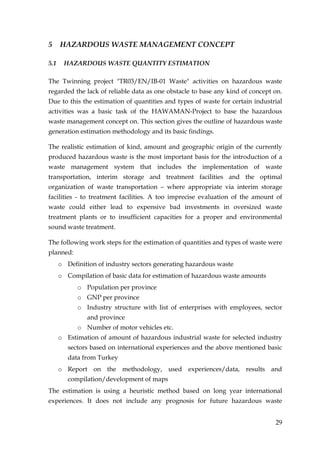
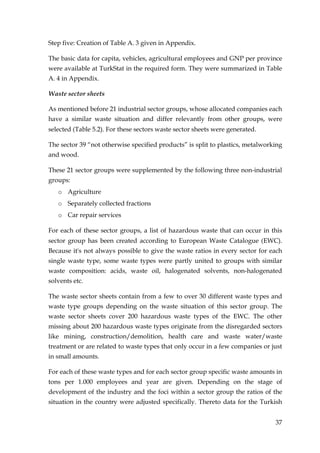
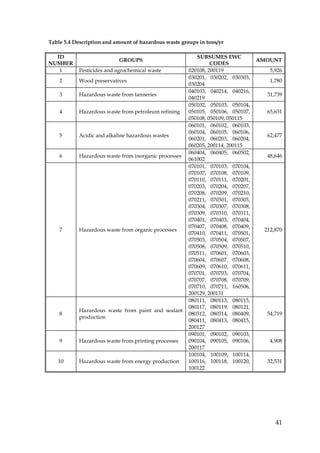
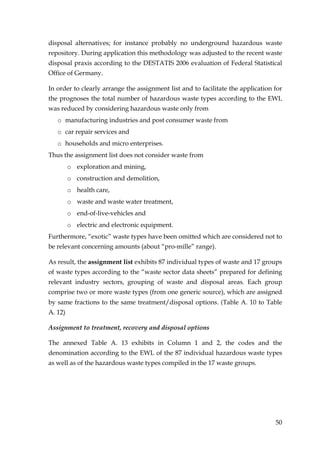
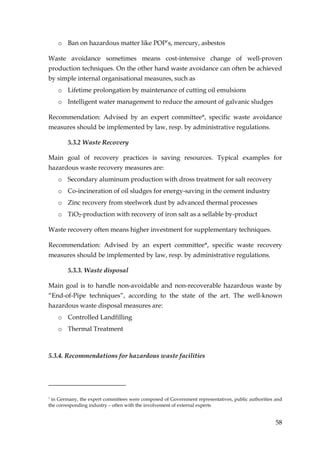
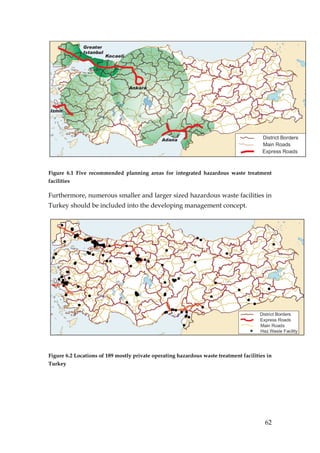
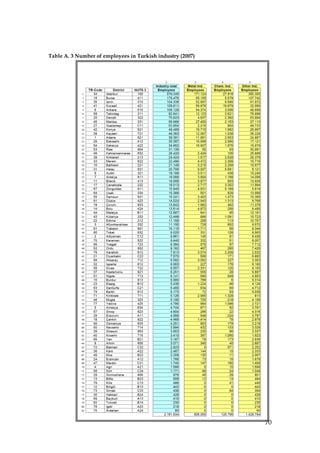
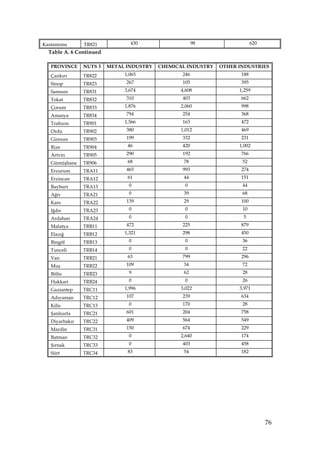
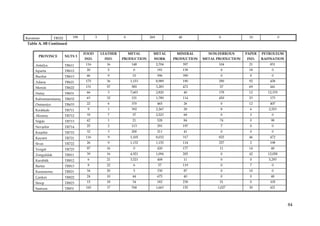
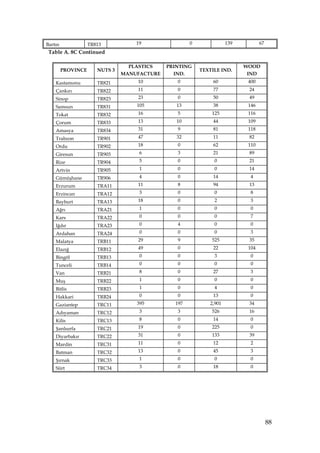
![hazardous waste amounts
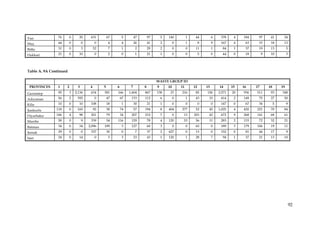
3.500
3.000
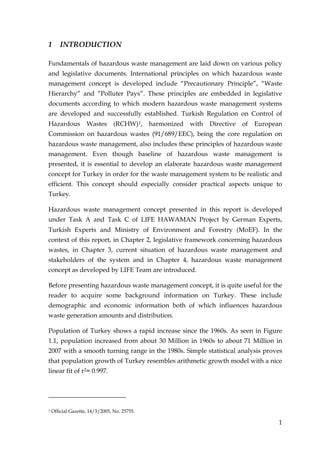
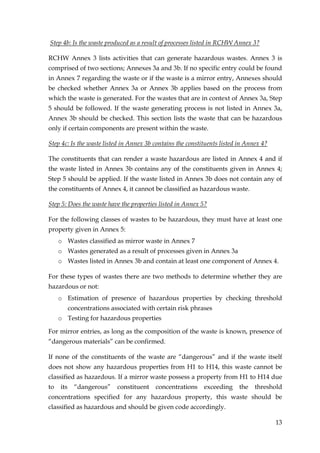
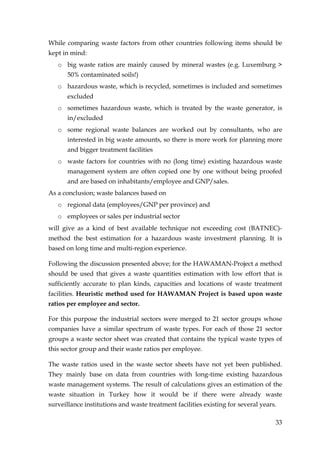
hazardous wastes [1.000 t/a]
Italy
2.500
UK
2.000
Turkey
1.500
Portugal
Taiwan
1.000 Netherlands
Belgium
Norway
Austria
500 Greece
0
0 200 400 600 800 1.000 1.200 1.400
GNP "power parity" [Bill. US$]
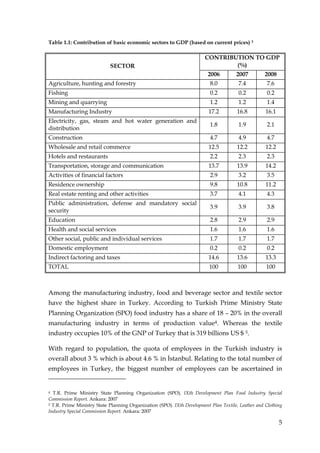
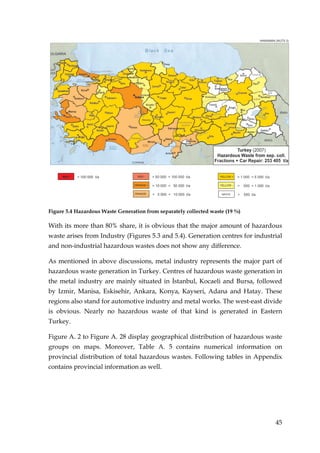
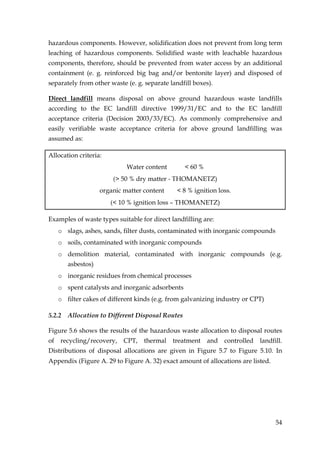
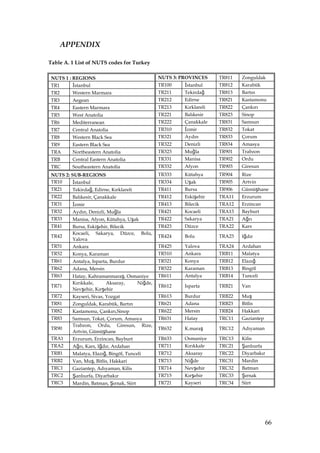
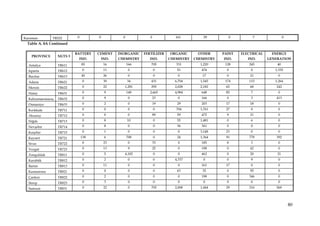
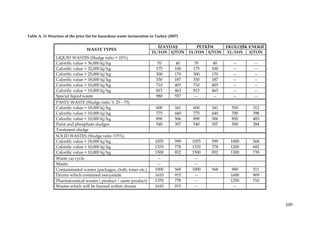
Figure 5.5 Hazardous waste amounts in several countries versus GNP “power parity”
48](https://image.slidesharecdn.com/a3conceptfinalversion-100414023006-phpapp01/85/A3-concept-final_version-54-320.jpg)
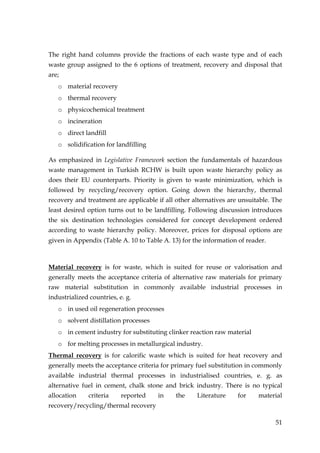
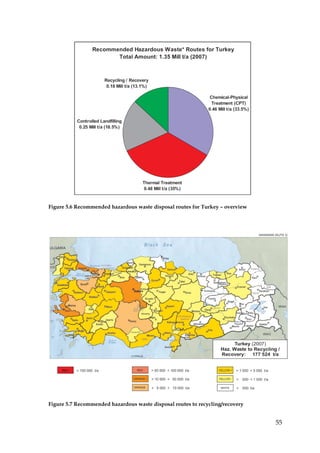
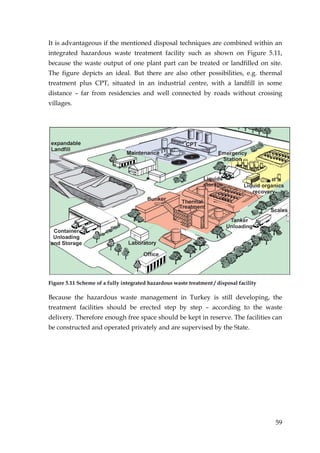
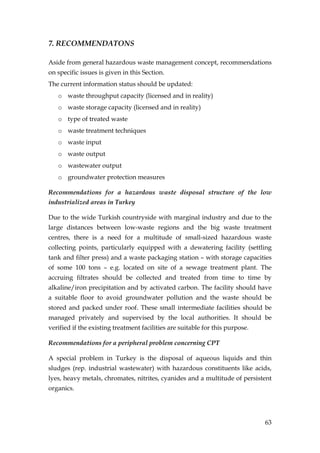
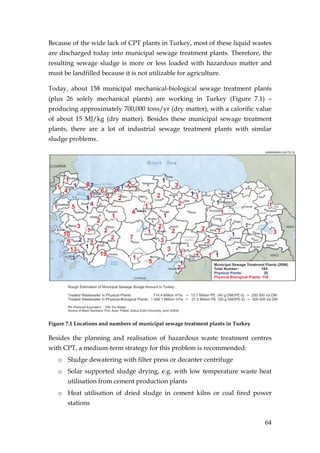
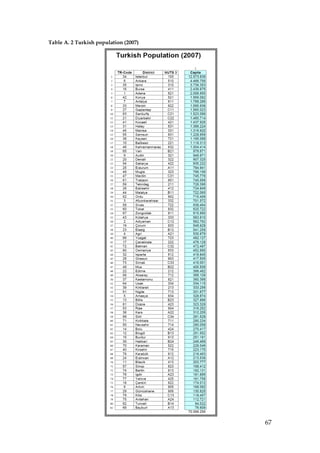
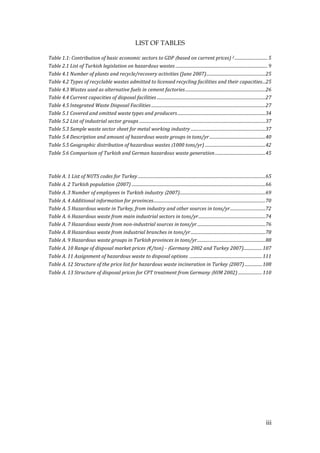
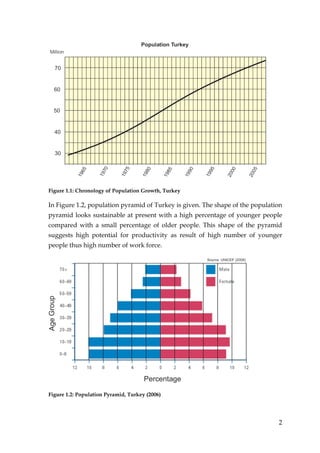
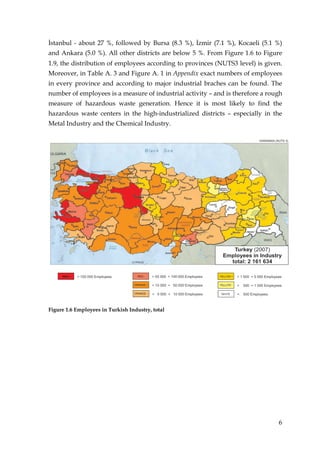
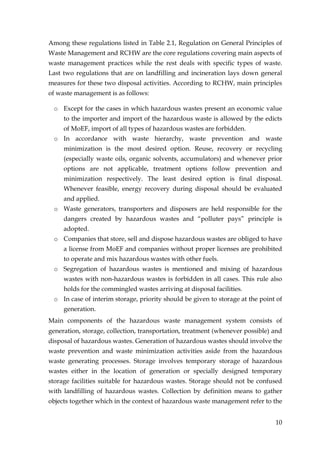
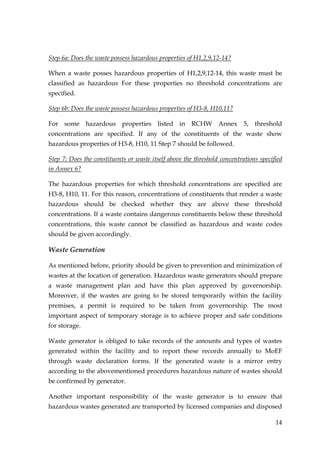
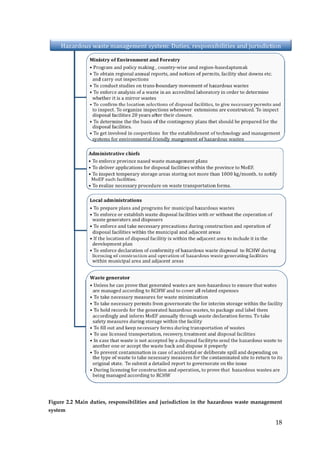
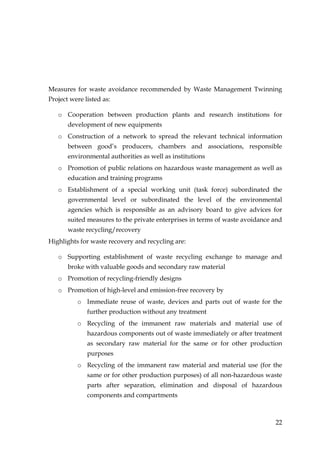
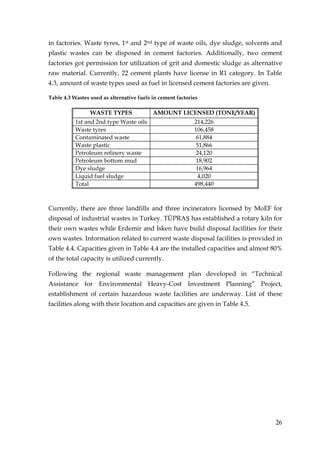
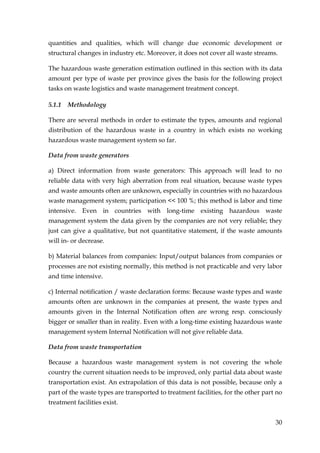
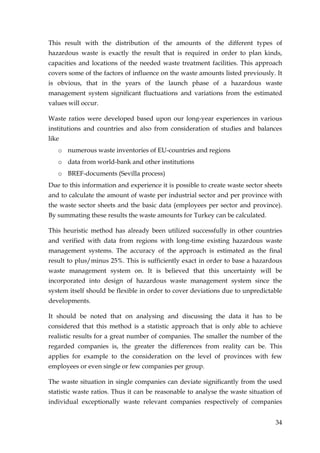
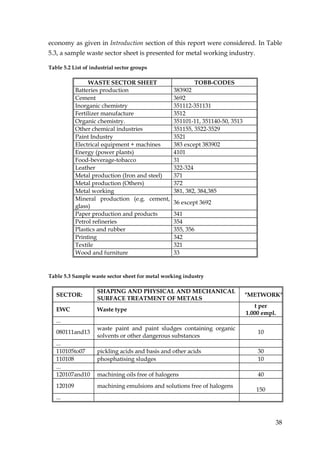
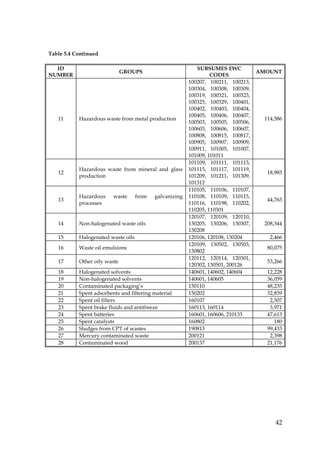
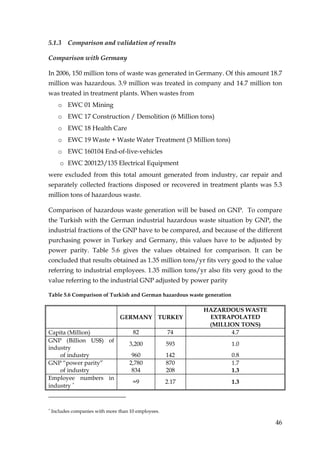
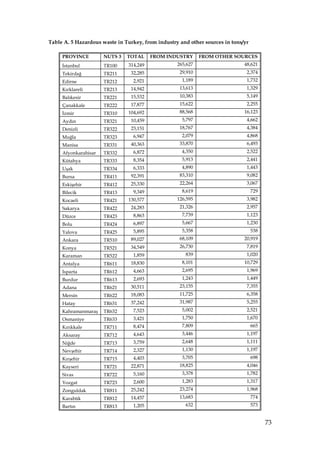
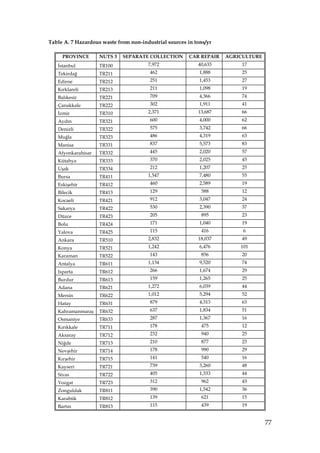
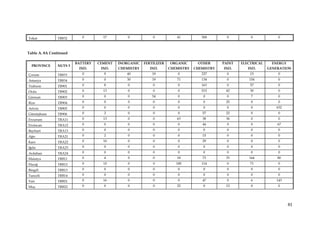
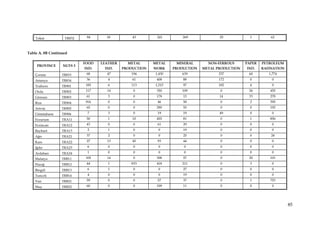
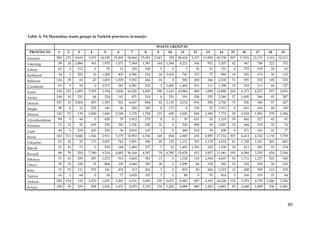
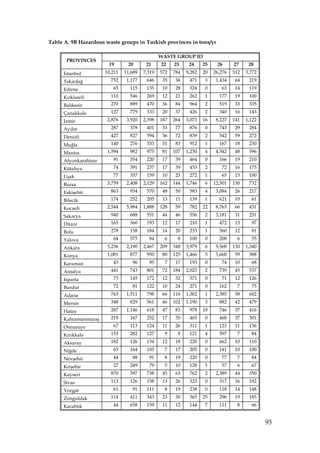
![Table A. 4 Additional information for provinces
EMPLOYEE
PROVINCE NUTS3 CAPITA VEHICLES GNP2001[%]
(AGRICULTURE)
Đstanbul TR100 12,573,836 2,612,379 30,279 21.30
Tekirdağ TR211 728,396 121,355 45,672 1.08
Edirne TR212 396,462 93,425 49,681 0.65
Kırklareli TR213 333,256 70,620 35,306 0.80
Balıkesir TR221 1,118,313 280,672 134,679 1.47
Çanakkale TR222 476,128 122,891 75,282 0.74
Đzmir TR310 3,739,353 879,957 119,157 7.50
Aydın TR321 946,971 257,138 112,105 1.31
Denizli TR322 907,325 240,595 120,367 1.23
Muğla TR323 766,156 277,692 115,346 1.64
Manisa TR331 1,319,920 358,306 150,970 2.11
Afyonkarahisar TR332 701,572 129,884 103,688 0.70
Kütahya TR333 583,910 130,192 82,396 0.81
Uşak TR334 334,115 77,577 44,754 0.32
Bursa TR411 2,439,876 480,896 99,586 3.65
Eskişehir TR412 724,849 166,424 33,814 1.21
Bilecik TR413 203,777 37,801 22,081 0.34
Kocaeli TR421 1,437,926 195,888 43,170 5.13
Sakarya TR422 835,222 153,659 67,199 1.07
Düzce TR423 323,328 57,570 41,810 0.25
Bolu TR424 270,417 66,843 33,845 0.77
Yalova TR425 181,758 26,760 10,991 0.40
Ankara TR510 4,466,756 1,159,660 89,724 7.59
Konya TR521 1,959,082 416,365 182,829 2.38
Karaman TR522 226,049 55,052 36,464 0.33
Antalya TR611 1,789,295 612,069 134,873 2.64
Isparta TR612 419,845 107,608 52,067 0.53
Burdur TR613 251,181 81,303 46,086 0.34
Adana TR621 2,006,650 388,269 80,207 2.98
Mersin TR622 1,595,938 340,355 95,445 2.82
Hatay TR631 1,386,224 277,293 114,813 1.48
Kahramanmaraş TR632 1,004,414 117,892 91,834 1.08
Osmaniye TR633 452,880 87,890 29,670 0.37
Kırıkkale TR711 280,234 30,546 21,897 0.71
Aksaray TR712 366,109 60,429 45,288 0.27
Niğde TR713 331,677 56,409 41,668 0.42
Nevşehir TR714 280,058 63,651 53,532 0.45
Kırşehir TR715 223,170 34,740 28,941 0.25
Kayseri TR721 1,165,088 209,592 86,814 1.31
Sivas TR722 638,464 85,733 79,584 0.71
Yozgat TR723 492,127 61,858 78,328 0.40
Zonguldak TR811 615,890 99,146 65,098 1.23
Karabük TR812 218,463 39,954 26,375 0.24
Bartın TR813 182,131 28,223 33,895 0.13
Kastamonu TR821 360,366 74,575 73,682 0.45
Çankırı TR822 174,012 24,293 29,456 0.21
Sinop TR823 198,412 30,789 43,723 0.22
Samsun TR831 1,228,959 201,755 132,988 1.37
Tokat TR832 620,722 105,556 79,741 0.78
Çorum TR833 549,828 107,075 80,064 0.67
71](https://image.slidesharecdn.com/a3conceptfinalversion-100414023006-phpapp01/85/A3-concept-final_version-77-320.jpg)
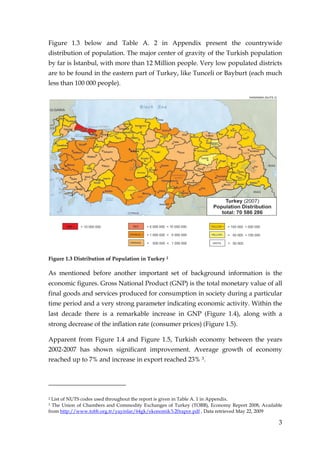
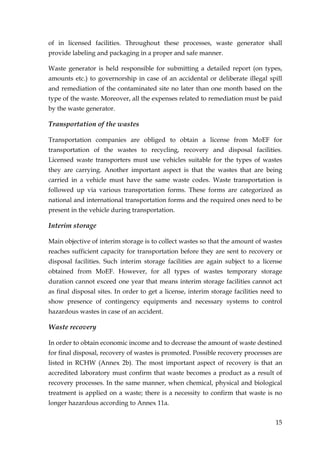
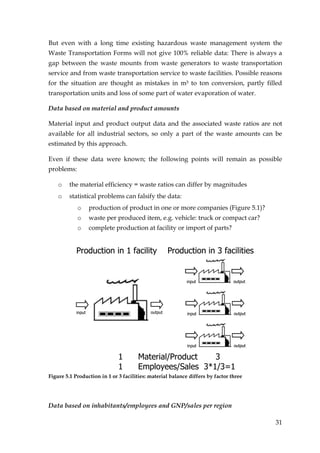
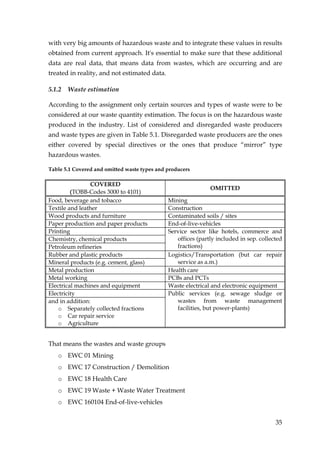
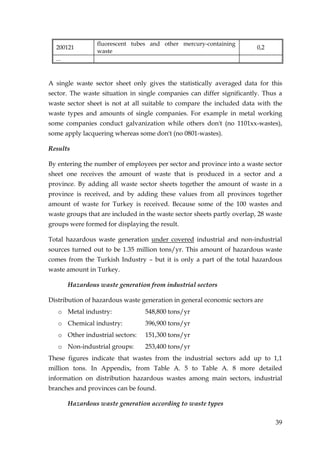
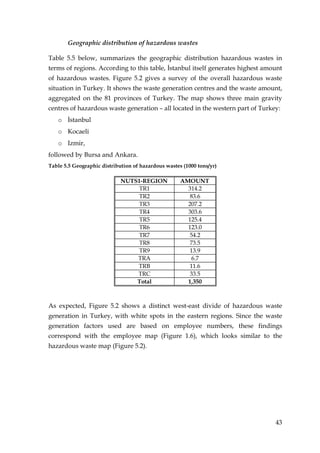
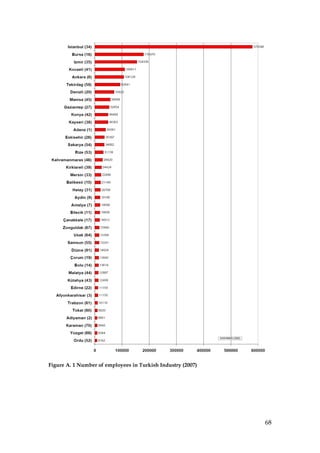
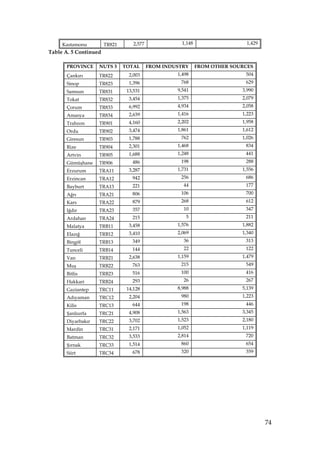
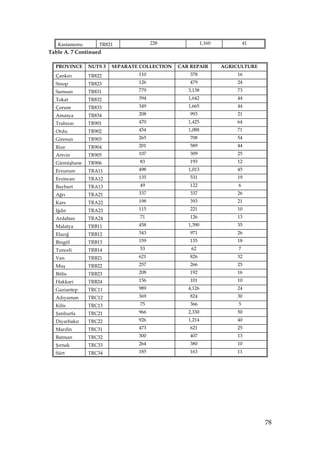
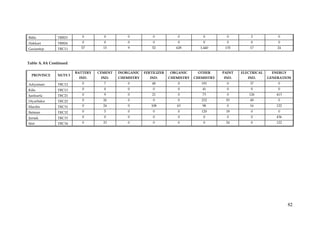
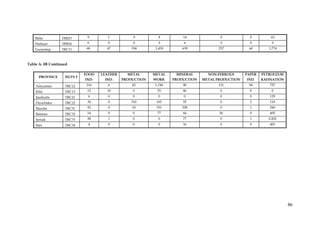
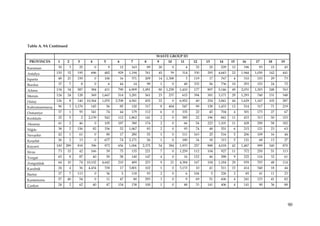
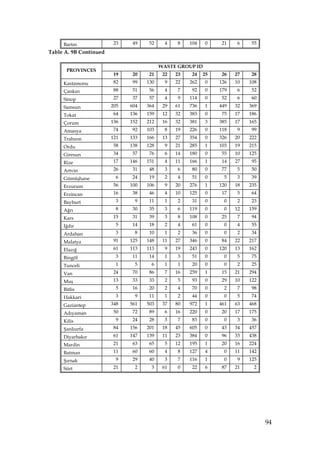
![Table A. 4 continued
EMPLOYEE
PROVINCE NUTS3 CAPITA VEHICLES GNP2001[%]
(AGRICULTURE)
Amasya TR834 328,674 63,846 39,023 0.36
Trabzon TR901 740,569 91,594 115,476 1.01
Ordu TR902 715,409 69,940 129,023 0.64
Giresun TR903 417,505 45,501 98,222 0.51
Rize TR904 316,252 37,854 80,800 0.47
Artvin TR905 168,092 19,871 45,297 0.28
Gümüşhane TR906 130,825 12,407 21,602 0.14
Erzurum TRA11 784,941 65,151 81,387 0.68
Erzincan TRA12 213,538 34,166 34,360 0.25
Bayburt TRA13 76,609 7,827 11,411 0.07
Ağrı TRA21 530,879 21,651 47,943 0.21
Kars TRA22 312,205 25,242 38,586 0.19
Iğdır TRA23 181,866 14,214 18,982 0.10
Ardahan TRA24 112,721 8,104 24,100 0.08
Malatya TRB11 722,065 89,354 63,033 0.83
Elazığ TRB12 541,258 62,420 47,497 0.66
Bingöl TRB13 251,552 8,669 33,537 0.14
Tunceli TRB14 84,022 3,974 12,171 0.10
Van TRB21 979,671 53,091 58,906 0.52
Muş TRB22 405,509 17,105 46,339 0.18
Bitlis TRB23 327,886 12,335 29,346 0.17
Hakkari TRB24 246,469 6,498 17,709 0.14
Gaziantep TRC11 1,560,023 265,241 44,361 1.42
Adıyaman TRC12 582,762 52,952 54,864 0.39
Kilis TRC13 118,457 23,518 9,245 0.14
Şanlıurfa TRC21 1,523,099 149,783 90,618 1.01
Diyarbakır TRC22 1,460,714 78,030 72,374 1.23
Mardin TRC31 745,778 39,950 44,911 0.48
Batman TRC32 472,487 26,182 23,232 0.38
Şırnak TRC33 416,001 24,440 18,133 0.16
Siirt TRC34 291,528 10,457 20,248 0.20
TOTAL 70,586,256 13,237,971 5,000,000 100.00
72](https://image.slidesharecdn.com/a3conceptfinalversion-100414023006-phpapp01/85/A3-concept-final_version-78-320.jpg)
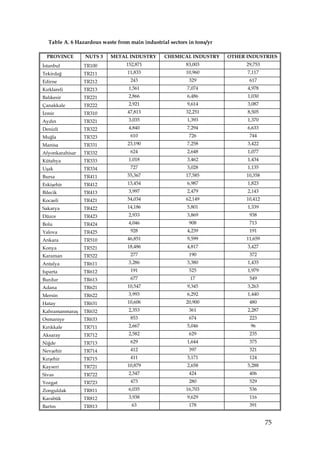
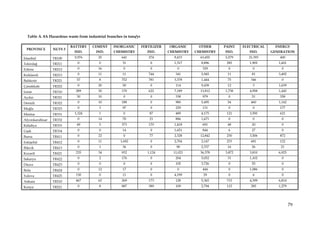
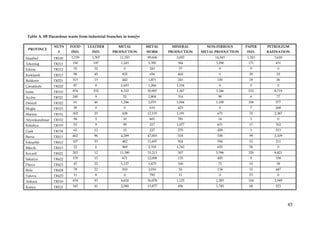
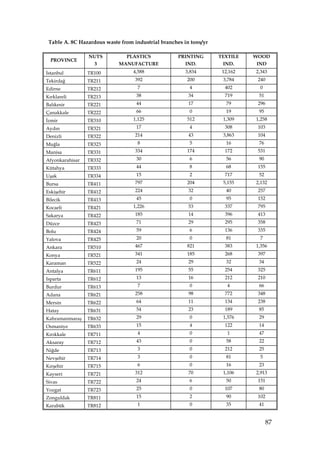
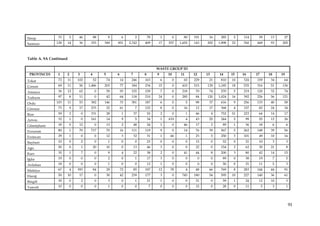

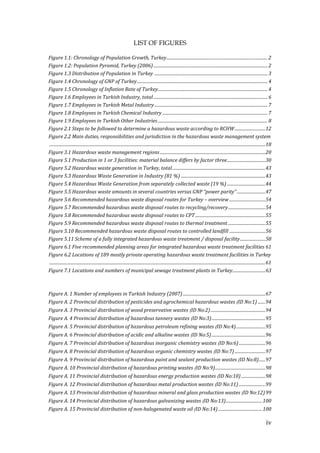
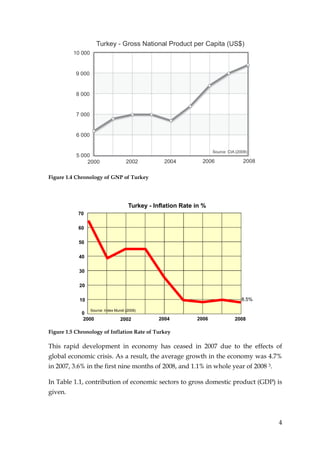
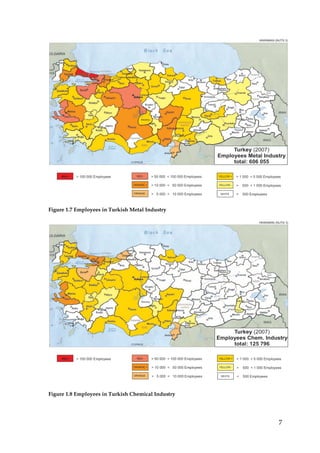
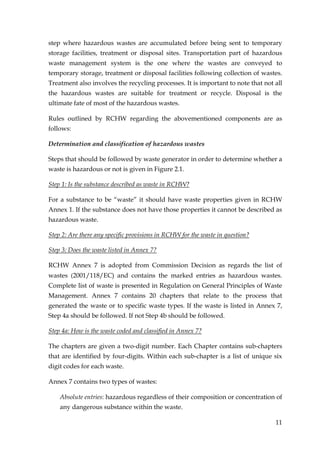
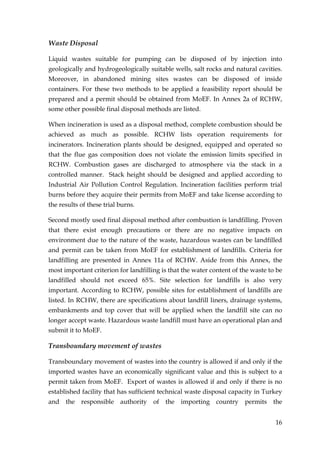
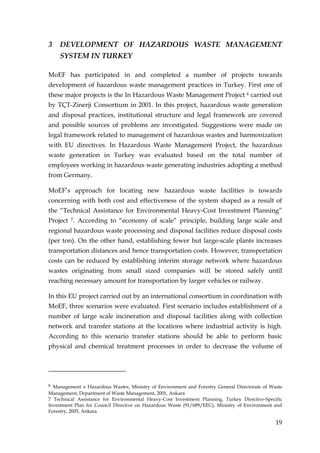
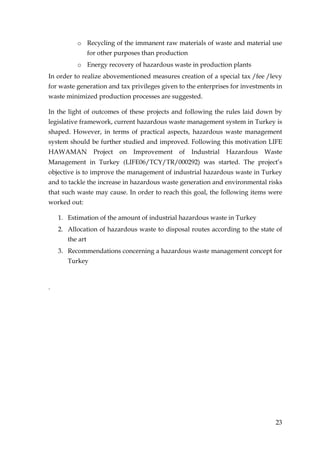
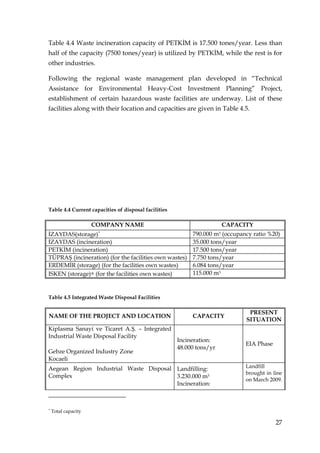
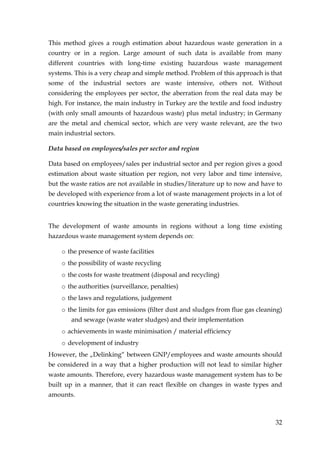
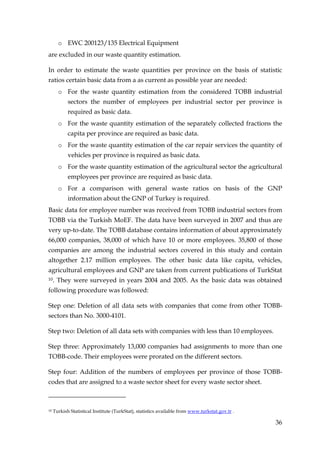
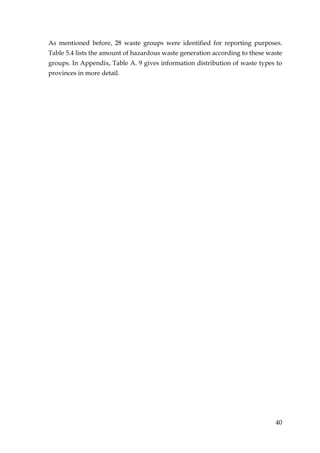
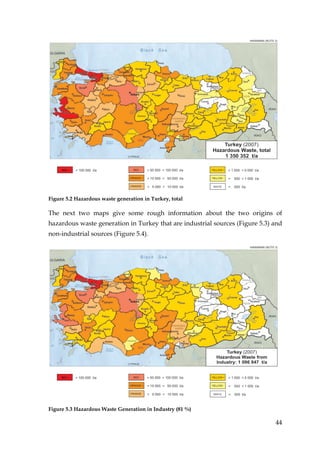
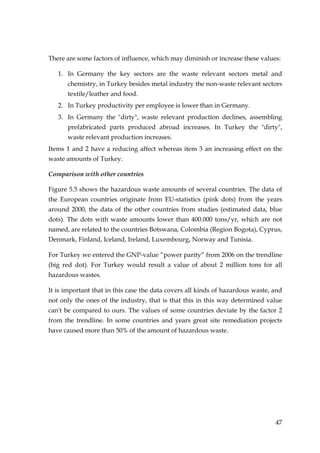
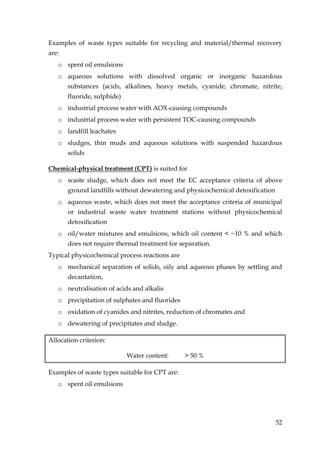
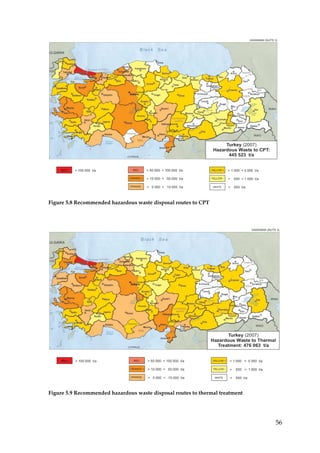
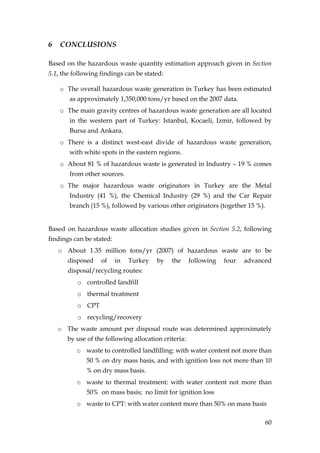
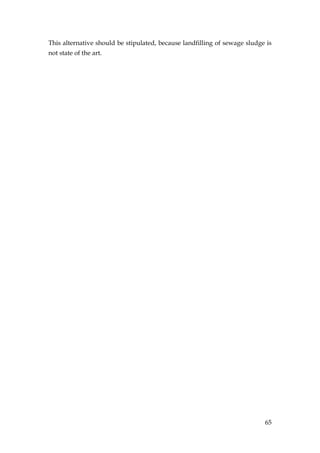
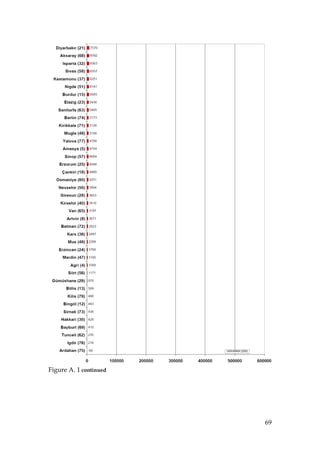
![Table A. 13 Assignment of hazardous waste to disposal options 11
HAZARDOUS WASTE DISPOSAL / RECOVERY OPTION [%]
Direct Solidification for Material Thermal
EWC Type of waste CPT Incineration
Landfill Landfilling Recovery Recovery
020108 agrochemical waste containing dangerous substances 10 0 0 90 0 0
030201to03 organic wood preservatives 0 0 0 100 0 0
030204 inorganic wood preservatives 0 0 100 0 0 0
degreasing wastes containing solvents without a liquid
040103 0 0 0 100 0
phase
040214 wastes from finishing containing organic solvents 0 0 0 50 0 50
040216 dyestuffs and pigments containing dangerous substances 0 0 0 50 0 50
sludges from on-site effluent treatment containing dangerous
040219 0 0 0 100 0 0
substances
050102to09 oil sludges from petroleum refining 0 0 50 50 0 0
050115 spent filter clays 20 0 0 80 0 0
060101 sulphuric acid and sulphurous acid 0 0 100 0 0 0
060404 wastes containing mercury 0 0 100 0 0 0
060405 wastes containing other heavy metals 0 0 100 0 0 0
sludges from on-site effluent treatment containing dangerous
060502 0 0 100 0 0 0
substances
Wastes from Inorganic Chemical Processes (without 060101
060xxx 15 20 60 5 0 0
and 060502)
061002 wastes containing dangerous substances 20 20 60 0 0 0
wastes from the manufacture, formulation, supply and use
070101to10 0 0 25 50 0 25
(MFSU) of basic organic chemicals
11 Destatis Federal Statistical Office of Germany and other sources.
112](https://image.slidesharecdn.com/a3conceptfinalversion-100414023006-phpapp01/85/A3-concept-final_version-118-320.jpg)
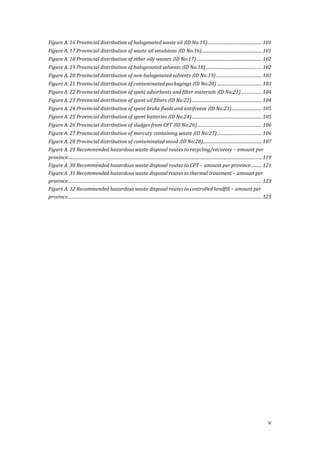
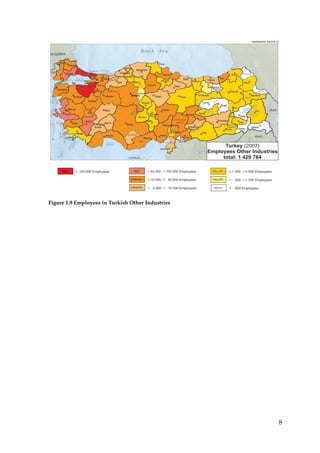
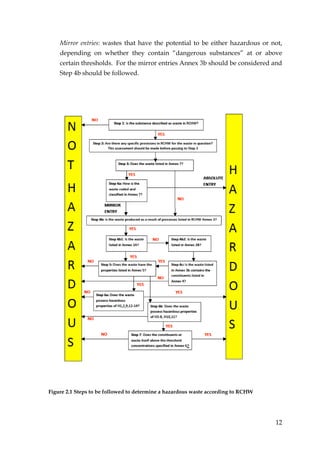
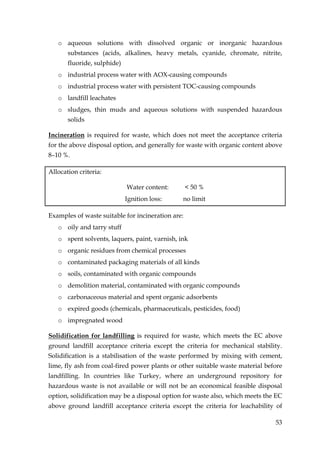
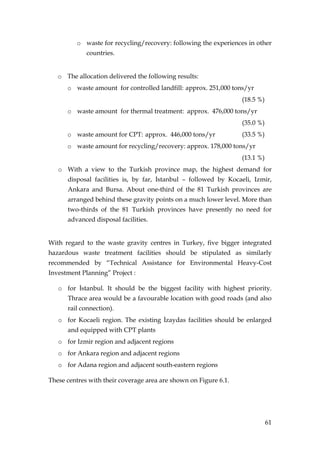
![sludges containing dangerous substances from other
070111 0 0 50 50 0 0
treatment of industrial waste water
Table A. 13 Continued
HAZARDOUS WASTE DISPOSAL / RECOVERY OPTION [%]
Direct Solidification for Material Thermal
EWC Type of waste CPT Incineration
Landfill Landfilling Recovery Recovery
0703nonhalog wastes from the MFSU of organic dyes and pigments (non halogenated) 0 0 50 50 0 0
070701 aqueous washing liquids and mother liquors 0 0 100 0 0 0
Wastes from Organic Chemical Processes: MFSU of plastics, synthetic
rubber, pharmaceuticals, fats, grease, soaps, detergents, disinfectants,
070x01to10 0 0 10 50 10 30
cosmetics, fine chemicals and chemical products not otherwise specified
(0702, 0704, 0705, 0706, 070701-10)
sludges containing dangerous substances from other treatment of
070x11 0 35 40 25 0 0
industrial waste water (0702, 0704, 0705, 0706, 070711)
waste paint and varnish containing organic solvents or other dangerous
080111 0 0 35 40 15 10
substances
sludges from paint or varnish containing organic solvents or other
080113 0 0 15 75 5 5
dangerous substances
wastes from paint or varnish removal containing organic solvents or
080117 0 0 60 25 10 5
other dangerous substances
080312 waste ink containing dangerous substances 0 0 50 35 10 5
080314 ink sludges containing dangerous substances 0 0 30 30 20 20
waste adhesives and sealants containing organic solvents or other
080409 0 0 30 40 15 15
dangerous substances
adhesive and sealant sludges containing organic solvents or other
080411 0 0 45 45 5 5
dangerous substances
090101 water-based developer and activator solutions 0 0 90 10 0 0
090102 water-based offset plate developer solutions 0 0 75 25 0 0
113](https://image.slidesharecdn.com/a3conceptfinalversion-100414023006-phpapp01/85/A3-concept-final_version-119-320.jpg)
![090103 solvent-based developer solutions 0 0 0 100 0 0
090104 fixer solutions 0 0 0 0 100 0
Table A. 13 Continued
HAZARDOUS WASTE DISPOSAL / RECOVERY OPTION [%]
Direct Solidification for Material Thermal
EWC Type of waste CPT Incineration
Landfill Landfilling Recovery Recovery
090105 bleach solutions and bleach fixer solutions 0 0 100 0 0 0
wastes containing silver from on-site treatment of
090106 0 0 0 0 100 0
photographic wastes
100104 oil fly ash and boiler dust 20 80 0 0 0 0
100109 sulphuric acid 0 0 100 0 0 0
bottom ash, slag and boiler dust from co-incineration
100114 100 0 0 0 0 0
containing dangerous substances
fly ash from co-incineration containing dangerous
100116 100 0 0 0 0 0
substances
wastes from gas cleaning containing dangerous
100118 100 0 0 0 0 0
substances
sludges from on-site effluent treatment containing
100120and22 0 50 50 0 0 0
dangerous substances
1002xx wastes from the iron and steel industry 40 30 30 0 0 0
1003xx wastes from aluminium thermal metallurgy 50 45 0 0 5 0
slags, dross and skimmings from primary and
100401to02 20 0 0 0 80 0
secondary production
100404 flue-gas dust 0 0 0 0 100 0
1004xx wastes from lead thermal metallurgy 20 0 0 0 80 0
1005xx wastes from zinc thermal metallurgy 100 0 0 0 0 0
1006xx wastes from copper thermal metallurgy 100 0 0 0 0 0
1007xx wastes from other non-ferrous thermal metallurgy 100 0 0 0 0 0
casting cores and moulds which have (not) undergone
100905,07and09 pouring containing 70 10 0 0 20 0
dangerous substances
114](https://image.slidesharecdn.com/a3conceptfinalversion-100414023006-phpapp01/85/A3-concept-final_version-120-320.jpg)
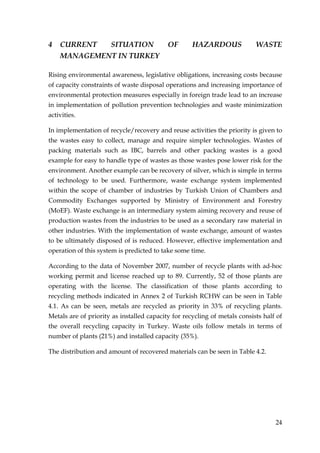
![casting cores and moulds which have (not) undergone
101005,07and09 pouring containing 100 0 0 0 0 0
dangerous substances
Table A. 13 Continued
HAZARDOUS WASTE DISPOSAL / RECOVERY OPTION [%]
Direct Solidification for Material Thermal
EWC Type of waste CPT Incineration
Landfill Landfilling Recovery Recovery
wastes from asbestos-cement manufacture containing
101309and12 100 0 0 0 0 0
asbestos and solid wastes from gas treatment
110105to07 pickling acids and basis and other acids 0 0 100 0 0 0
110108 phosphatising sludges 5 80 15 0 0 0
110109 sludges and filter cakes containing dangerous substances 5 80 15 0 0 0
sludges from zinc hydrometallurgy (including jarosite,
110202 90 10 0 0 0 0
goethite)
wastes from copper hydrometallurgical processes containing
110205 50 0 0 0 50 0
dangerous substances
110301 wastes containing cyanide 80 0 20 0 0 0
mineral-based machining oils containing halogens (except
120106 0 0 50 30 20 0
emulsions and solutions)
mineral-based machining oils free of halogens (except
120107 0 0 0 0 50 50
emulsions and solutions)
120108 machining emulsions and solutions containing halogens
120109 machining emulsions and solutions free of halogens 0 0 100 0 0 0
120110 synthetic machining oils 0 0 0 0 50 50
120112 spent waxes and fats 0 0 0 50 0 50
120114 machining sludges containing dangerous substances 5 25 25 25 0 20
120301 aqueous washing liquids 0 0 100 0 0 0
120302 steam degreasing wastes 0 0 100 0 0 0
13 01 01 hydraulic oils, containing PCBs 0 0 0 70 30 0
13 01 04 chlorinated emulsions 0 0 0 70 30 0
115](https://image.slidesharecdn.com/a3conceptfinalversion-100414023006-phpapp01/85/A3-concept-final_version-121-320.jpg)
![13 01 05 non-chlorinated emulsions 0 0 0 0 50 50
13 01 09 mineral-based chlorinated hydraulic oils 0 0 0 70 30 0
13 01 10 mineral based non-chlorinated hydraulic oils 0 0 0 0 50 50
Table A. 13 Continued
HAZARDOUS WASTE DISPOSAL / RECOVERY OPTION [%]
Direct Solidification for Material Thermal
EWC Type of waste CPT Incineration
Landfill Landfilling Recovery Recovery
13 01 11 synthetic hydraulic oils 0 0 0 0 50 50
13 01 12 readily biodegradable hydraulic oils 0 0 0 0 50 50
13 01 13 other hydraulic oils 0 0 0 0 50 50
13 02 04 mineral-based chlorinated engine, gear and lubricating oils 0 0 0 70 30 0
mineral-based non-chlorinated, synthetic, readily biodegradable
130205to08 0 0 10 0 50 40
and other engine, gear and lubricating oils
13 03 01 insulating or heat transmission oils containing PCBs 0 0 0 70 30 0
mineral-based chlorinated insulating and heat transmission oils
13 03 06 0 0 0 70 30 0
other than those mentioned in 13 03 01
mineral-based, synthetic, readily biodegradable and other non-
13 03 07to 10 0 0 0 0 50 50
chlorinated insulating and heat transmission oils
bilge oils from inland navigation, jetty sewers and from other
13 04 01to 03 0 0 0 0 50 50
navigation
130501 solids from grit chambers and oil/water separators 15 0 85 0 0 0
130502to03 sludges from oil/water separators and interceptor sludges 0 0 100 0 0 0
oil and oily water from oil/water separators, mixtures of wastes
13 05 06to08 0 0 0 0 50 50
from grit chambers and oil/water separators
13 07 01to 03 fuel oil, diesel, petrol and other fuels (including mixtures) 0 0 0 0 50 50
130802 other emulsions 0 0 100 0 0 0
140601 chlorofluorocarbons, HCFC, HFC 0 0 0 10 90 0
140602 other halogenated solvents and solvent mixtures 0 0 0 50 50 0
116](https://image.slidesharecdn.com/a3conceptfinalversion-100414023006-phpapp01/85/A3-concept-final_version-122-320.jpg)
![140603 other solvents and solvent mixtures 0 0 0 20 30 50
140604 sludges or solid wastes containing halogenated solvents 0 0 0 70 30 0
140605 sludges or solid wastes containing other solvents 0 0 0 70 0 30
Table A. 13 Continued
HAZARDOUS WASTE DISPOSAL / RECOVERY OPTION [%]
Direct Solidification for Material Thermal
EWC Type of waste CPT Incineration
Landfill Landfilling Recovery Recovery
packaging containing residues of or contaminated by dangerous
150110 10 0 0 80 10 0
substances
absorbents, filter materials (including oil filters not otherwise specified),
150202 wiping cloths, protective clothing contaminated by dangerous 10 0 0 90 0 0
substances
160107 oil filters 0 0 0 0 100 0
160113 brake fluids 0 0 0 0 100 0
160114 antifreeze fluids containing dangerous substances 0 0 0 0 100 0
laboratory chemicals, consisting of or containing dangerous substances,
160506 0 0 30 70 0 0
including mixtures of laboratory chemicals
160601 lead batteries 0 0 0 0 100 0
160606 separately collected electrolyte from batteries and accumulators 0 0 100 0 0 0
spent catalysts containing dangerous transition metals or dangerous
160802 10 0 0 5 85 0
transition metal compounds
sludges containing dangerous substances from other treatment of
190813 20 50 0 30 0 0
industrial waste water
200113 solvents 0 0 0 100 0 0
200114 acids 0 0 100 0 0 0
200115 alkalines 0 0 100 0 0 0
200117 photochemicals 0 0 100 0 0 0
200119 pesticides 0 0 0 100 0 0
200121 fluorescent tubes and other mercury-containing waste 0 0 0 0 100 0
117](https://image.slidesharecdn.com/a3conceptfinalversion-100414023006-phpapp01/85/A3-concept-final_version-123-320.jpg)
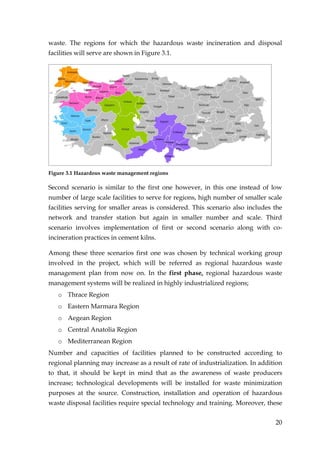
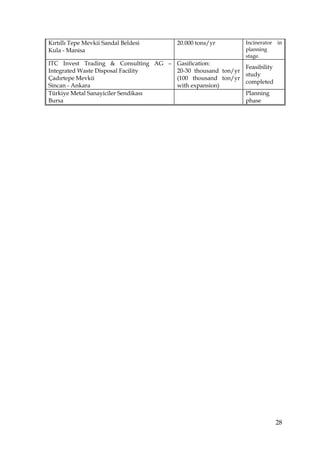
![200123 discarded equipment containing chlorofluorocarbons 0 0 0 0 100 0
200126 oil and fat other than those mentioned in 20 01 25 0 0 0 0 50 50
200127 paint, inks, adhesives and resins containing dangerous substances 0 0 0 100 0 0
Table A. 13 Continued
HAZARDOUS WASTE DISPOSAL / RECOVERY OPTION [%]
Direct Solidification for Material Thermal
EWC Type of waste CPT Incineration
Landfill Landfilling Recovery Recovery
200129 detergents containing dangerous substances 0 0 0 100 0 0
200131 cytotoxic and cytostatic medicines 0 0 0 100 0 0
batteries and accumulators included in 16 06 01, 16 06 02 or 16 06 03
200133 50 0 0 0 50 0
and unsorted batteries and accumulators containing these batteries
discarded electrical and electronic equipment other than those
200135 0 0 0 0 0 0
mentioned in 20 01 21 and 20 01 23 containing hazardous components
200137 wood containing dangerous substances 0 0 0 0 0 100
118](https://image.slidesharecdn.com/a3conceptfinalversion-100414023006-phpapp01/85/A3-concept-final_version-124-320.jpg)