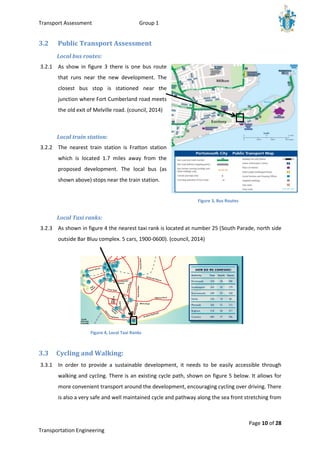
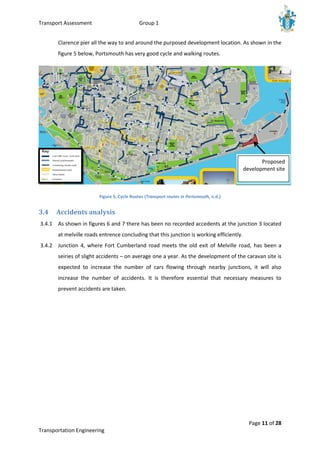
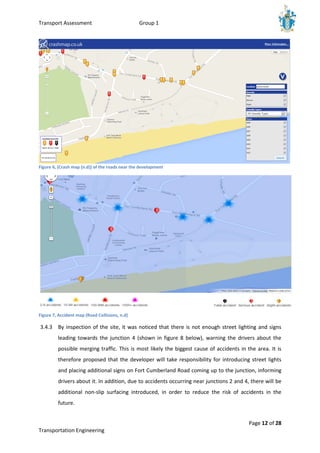
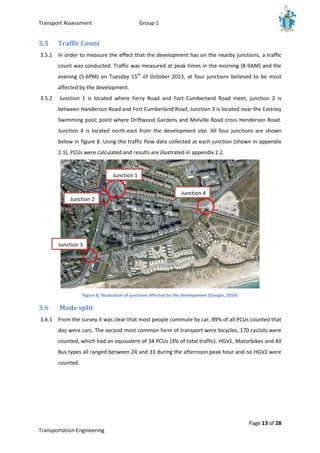
This document provides a transport assessment for a proposed redevelopment of a leisure park site in Southsea, Portsmouth into residential and office uses. It summarizes the existing transport conditions around the site, including public transport access, walking and cycling routes, and accident rates. It then describes the proposed development and assesses the impact on transport, including trip generation, access, parking, and drainage. The assessment concludes that the development would not adversely impact the local road network.
2. Transport Assessment Group 1
Page 1 of 28
Transportation Engineering
Contents
List of Figures.......................................................................................................................................... 2
List of Tables ........................................................................................................................................... 2
List of Abbreviations ............................................................................................................................... 3
1.0 Introduction................................................................................................................................ 4
1.1 Background............................................................................................................................... 4
1.2 Report Outline.......................................................................................................................... 5
2.0 Policies........................................................................................................................................... 6
2.1 National Policies....................................................................................................................... 6
2.2 Local Policies. ........................................................................................................................... 7
3.0 Existing Environment, Community and Site Conditions................................................................ 9
3.1 Existing Site. .............................................................................................................................. 9
3.2 Public Transport Assessment .................................................................................................10
3.3 Cycling and Walking: ...............................................................................................................10
3.4 Accidents analysis ...................................................................................................................11
3.5 Traffic Count...........................................................................................................................13
3.6 Mode split..............................................................................................................................13
4.0 Proposed Development ..............................................................................................................16
4.1 Road Access............................................................................................................................16
4.2 Parking Provision....................................................................................................................17
4.3 Character of the design..........................................................................................................18
4.4 Trip generation.......................................................................................................................18
4.5 Trips Distribution....................................................................................................................19
4.6 Alternate route “Rat Run”.......................................................................................................20
4.7 Junctions.................................................................................................................................21
4.8 Drainage .................................................................................................................................21
4.9 Pavement design....................................................................................................................23
5.0 Appraising the Impact of the Proposed Development...............................................................24
5.1 Environmental........................................................................................................................24
5.2 Economy.................................................................................................................................24
5.3 Safety......................................................................................................................................24
5.4 Accessibility............................................................................................................................25
5.5 Integration..............................................................................................................................25
6.0 Conclusion...................................................................................................................................26
Bibliography..........................................................................................................................................27
Appendices .............................................................................................. Error! Bookmark not defined.
1.0 Drawings ...................................................................................... Error! Bookmark not defined.
1.1 Site layout and General Arraingment...................................... Error! Bookmark not defined.
3. Transport Assessment Group 1
Page 2 of 28
Transportation Engineering
1.2 Drainage................................................................................... Error! Bookmark not defined.
2.0 Traffic Count ................................................................................ Error! Bookmark not defined.
2.1 Traffic Count ............................................................................ Error! Bookmark not defined.
2.2 Initial Traffic Count .................................................................. Error! Bookmark not defined.
2.3 Effect of Development on each junction................................. Error! Bookmark not defined.
2.4 Total Traffic Flow at each junction after 5 years (with the development)....Error! Bookmark
not defined.
2.5 AADT with the development for each junction....................... Error! Bookmark not defined.
2.6 Trips generated by similar developments ............................... Error! Bookmark not defined.
2.7 Ratio of trips generated at each junction due to the development.......Error! Bookmark not
defined.
2.8 AADT through the development.............................................. Error! Bookmark not defined.
3.0 Calculations.................................................................................. Error! Bookmark not defined.
3.1 Junction Calculations ............................................................... Error! Bookmark not defined.
3.2 Drainage Calulations................................................................ Error! Bookmark not defined.
3.3 Pavement Calculations ............................................................ Error! Bookmark not defined.
3.4 Horisontal Allingnment Calculations ....................................... Error! Bookmark not defined.
List of Figures
Figure 1, Road Assessment 1 .................................................................................................................. 9
Figure 2, Road Assessment 2 .................................................................................................................. 9
Figure 3, Bus Routes .............................................................................................................................10
Figure 4, Local Taxi Ranks .....................................................................................................................10
Figure 5, Cycle Routes (Transport routes in Portsmouth, n.d.).............................................................11
Figure 6, (Crash map (n.d)) of the roads near the development..........................................................12
Figure 7, Accident map (Road Collisions, n.d) ......................................................................................12
Figure 8, Illustration of junctions affected by the development (Google, 2014) .................................13
Figure 9, Mode split for PM peak flow .................................................................................................14
Figure 10, Chart illustrating the most preferred mode of transport to work (values from Population
Statistics, 2013).....................................................................................................................................14
Figure 11 Melville Road Realignment...................................................................................................16
Figure 12, Sites used to estimate trips generated by houses and flats (Google, 2014) .......................18
Figure 13, possible rat run route .........................................................................................................20
Figure 14 Sustainable Drainage ............................................................................................................22
Figure 15, Pavement Design .................................................................................................................23
List of Tables
Table 1, Information about means of transport to work, by people in Portsmouth (Population
Statistics, 2013).....................................................................................................................................14
4. Transport Assessment Group 1
Page 3 of 28
Transportation Engineering
List of Abbreviations
BRT - Bus Rapid Transport
CBR - California Baring Ration
EHDC - East Hampshire District Council
HDM - Heavy Duty Macadam
HGV - Heavy Goods Vehicle
HRA - Hot Rolled Asphalt
MfS2 - Manual for Streets 2
NPPF - National Planning Policy Framework
PCC - Portsmouth City Council
PCU - Passenger Car Unit
TFL - Transport for London
5. Transport Assessment Group 1
Page 4 of 28
Transportation Engineering
1.0 Introduction
1.0.1 This transport assessment has been prepared by a group of undergraduate civil engineers on
behalf of the University of Portsmouth.
1.0.2 A property developer has recently acquired the Southsea leisure park off Melville road. The
client’s intention is to develop the land for residential and office use only. The assessment
will include a redesign of the land and a travel plan to support the clients planning
application to Portsmouth City Council.
1.0.3 A transport assessment is an inclusive process that should cover all aspects of movement by
people and vehicles. It should be able to demonstrate how developments affect demands
for travel and how all travel demands and servicing requirements will be met (TFL, 2010).
The new development change of land will have some form of transport implication. This
assessment seeks to provide a better practise guide to help identify and deal with the likely
impacts.
1.0.4 Who should read this assessment?
1.0.5 This transport assessment is intended to ensure the satisfactory requirements are in place to
specify, assess, implement, monitor and review the impacts that development will have on
the local transport system. The target audience to read this assessment are as follows;
The developer
Local authority officers and councillors with responsibilities for development management
Portsmouth City Council
Public transport providers
Local residents
1.1 Background
1.1.1 The land is currently used as a caravan site, holding under 60 caravans. The development is
located south east of Portsmouth off Melville Road. Early considerations to take into account
is the visual aspect, the land offers an attractive view looking across the English Channel.
1.1.2 The client wants to develop the land according to the following requirements:
1. 8000m2
Offices blocks (8 blocks of 1000)
2. 40 (2 bed flats)
3. 50 (3 bed detached) houses
4. Pavement design
5. Outline of drainage design
6. Transport Assessment Group 1
Page 5 of 28
Transportation Engineering
1.2 Report Outline
1.2.1 This report is structured into the following chapters:
Chapter 2 provides an overview of the relevant national and local transport policies
Chapter 3 describes the existing conditions around the site including traffic flows, road
safety and provision for walking, cycling, public transport and accident analysis. It also
includes the traffic count and mode split.
Chapter 4 describes the proposed development, including parking provision, road access,
character of the design, trip generation, pavement and drainage design.
Chapter 5 appraising the impact of the proposed development, including the environmental,
economy, safety accessibility and integration.
Chapter 6 concludes that the proposed development would not have an adverse impact on
the local road network.
7. Transport Assessment Group 1
Page 6 of 28
Transportation Engineering
2.0 Policies.
2.0.1 This section will look into the policies in which this assessment has adhered to.
2.1 National Policies.
2.1.1 The main policy that has effected this assessment is the National Planning Policy Framework
(NPPF) (March 2012), stating; “All developments that generate significant amounts of
movement should be supported by a transport statement or transport assessment”. Below
are some of the key points of the policy (Communities and local Government, 2012);
2.1.2 The core of this policy revolves around sustainable development (economic role, social role
and environmental role), further stating this in paragraph 29.
2.1.3 One way in which this policy achieves these goals is through “actively manage patterns of
growth to make the fullest possible use of public transport, walking and cycling, and focus
significant development in locations which are or can be made sustainable.” As reflected
throughout this assessment.
2.1.4 From the section “Delivering sustainable development” within the NPPF. The government
concludes that meeting the twin challenges of global competition and of a low carbon future
should be at the forefront of the planning system. As shown within this assessment these
challenges have been encouraged through the use of public transport, cycling and walking
reducing carbon emissions. The introduction of new houses and offices will help develop the
economic growth within the local area.
2.1.5 Paragraph 35 of the NPPF has implemented that plans should protect and exploit
opportunities for the use of sustainable transport;
Accommodating the efficient delivery of goods and supplies. (turning circles and road
layouts)
Give priority to pedestrian and cycle movements and have access to high quality public
transport facilities.
Create safe and secure layouts which minimise conflicts between traffic and cyclists or
pedestrians, avoiding street clutter and where appropriate establishing home zones.
Incorporate facilities for charging plug-in and other ultralow emission vehicles.
Consider the needs of people with disabilities by all modes of transport. (Disabled parking
etc.)
2.1.6 Paragraph 69 of the NPPF states that a development should promote, “safe and accessible
developments, containing clear and legible pedestrian routes, and high quality public space,
which encourage the active and continual use of public areas.”
8. Transport Assessment Group 1
Page 7 of 28
Transportation Engineering
2.2 Local Policies.
2.2.1 The Portsmouth Plan is a document in which this assessments criterion is closely linked to
the policies within.
2.2.2 Portsmouth’s plan policy PCS17 “Transport” states that; the council will work with its
partners to deliver a strategy that will reduce the need to travel and provide a sustainable
and integrated transport network, which will include (Portsmouth City Council, 2012):
Encouraging development in areas around public transport hubs and along corridors where
there is good access not only to public transport but also to goods and services. Locating
development where there is the potential to improve accessibility for all through walking, cycling
and by public transport;
Continue partnership working within the sub region as part of Transport for South Hampshire to
enable the challenges affecting the sub region to be addressed effectively;
Safeguarding land for:
o A new interchange facility at Portsmouth & Southsea station (to be delivered as part of
Station Square development)
o Improved interchange facilities at The Hard
o Land for future stations at Farlington and Paulsgrove
o Land for Park and Ride facilities at Tipner, including a new junction on the M275 for access,
and Farlington
o All modes bridge between Tipner and Horsea Island
o A new road layout for north of the city centre.
Implementing highway improvements associated with the strategic sites;
Promoting walking and cycling and improved integration with other modes;
Creation of Bus Rapid Transit (BRT) routes in the short to medium term, with support for the
implementation of a sub-regional BRT linking Gosport, Fareham, North Fareham SDA and
Portsmouth (including Port Solent and Queen Alexandra Hospital) in the longer term;
Requiring travel plans from major new residential, business and retail development and schools.
2.2.3 This assessment is also closely linked to policies produced by the East Hampshire District
Local Plan, policies displayed below (East Hampshire (EHDC), 2006);
“Public Transport Provision and Improvement”
2.2.4 T2: Planning permission will not be granted for development likely to generate a significant
level of travel demand unless:
A It is, or arrangement are made for it to be, well-served public transport; and
9. Transport Assessment Group 1
Page 8 of 28
Transportation Engineering
B Its layout is designed to ensure that existing and/or future bus routes lie within easy walking
distance of the entire scheme with conveniently sited bus stops with shelters.
“Road Schemes”
2.2.5 T7: Planning permission will be granted for a road proposal only where it would mitigate or
overcome environmental problems, improve safety and/or convenience on the public
highway or provide access to a new development.
“Highway Issues – New Development”
2.2.6 T9: Planning permission for development requiring a new or improved access will be
permitted provided that it would not:
A. Cause danger or inconvenience on the public highway; or
B. Harm the character and appearance of the surroundings or cause any other environmental
damage.
2.2.7 T10: Development will only be permitted if:
A. The internal road layout is appropriate to the locality; and
B. Measures are incorporated to achieve safe traffic speeds which are in keeping with the
surrounding area and, where appropriate, provide for public transport.
“Parking Standards”
2.2.8 T12: Planning permission will not be granted for a proposal unless any parking of vehicles,
including cycles, is provided in accordance with adopted parking standards.
10. Transport Assessment Group 1
Page 9 of 28
Transportation Engineering
3.0 Existing Environment, Community and Site Conditions.
3.1 Existing Site.
3.1.1 The development site is located in Southsea, Portsmouth. It is bounded by Melville Road to
the north, Fort Cumberland to the east, sea to the south and Henderson Road to the west.
3.1.2 The site is currently located near Southsea Leisure Park just off Melville road.
3.1.3 The Leisure Park is mainly open planned with a few existing permanent structures. It has
sufficient parking and catering facilities for the guests. There is also an existing cycle path
that runs between Melville road and the junction on Fort Cumberland road.
3.1.4 The majority of the site has a sea view (increasing the properties prospects).
3.1.5 This site is situated near two schools within walking distance. Milton park Pre School
(0.8miles) and Milton Park Federated Primary School (0.9miles), giving sufficient schooling
options to any new families moving into the development. Other local facilities include
Bransbury Park (0.3 miles), Cockleshell community centre (0.1 miles) and Eastney swimming
pool (located adjacent to the existing site – on Melville Road).
3.1.6 The Road situated off Fort Cumberland is in need of repairs and is not suitable for the influx
of traffic that will occur due to the introduction of the new development (details shown in
figures 1 and 2)
3.1.7 It is suggested that the road be reconstructed with the development in accordance with T7
policy of the East Hampshire Local Plan (East Hampshire (EHDC), 2006).
Figure 1, Road Assessment 1 Figure 2, Road Assessment 2
11. Transport Assessment Group 1
Page 10 of 28
Transportation Engineering
3.2 Public Transport Assessment
Local bus routes:
3.2.1 As show in figure 3 there is one bus route
that runs near the new development. The
closest bus stop is stationed near the
junction where Fort Cumberland road meets
the old exit of Melville road. (council, 2014)
Local train station:
3.2.2 The nearest train station is Fratton station
which is located 1.7 miles away from the
proposed development. The local bus (as
shown above) stops near the train station.
Local Taxi ranks:
3.2.3 As shown in figure 4 the nearest taxi rank is located at number 25 (South Parade, north side
outside Bar Bluu complex. 5 cars, 1900-0600). (council, 2014)
3.3 Cycling and Walking:
3.3.1 In order to provide a sustainable development, it needs to be easily accessible through
walking and cycling. There is an existing cycle path, shown on figure 5 below. It allows for
more convenient transport around the development, encouraging cycling over driving. There
is also a very safe and well maintained cycle and pathway along the sea front stretching from
Figure 3, Bus Routes
Figure 4, Local Taxi Ranks
12. Transport Assessment Group 1
Page 11 of 28
Transportation Engineering
Clarence pier all the way to and around the purposed development location. As shown in the
figure 5 below, Portsmouth has very good cycle and walking routes.
Figure 5, Cycle Routes (Transport routes in Portsmouth, n.d.)
3.4 Accidents analysis
3.4.1 As shown in figures 6 and 7 there has been no recorded accedents at the junction 3 located
at melville roads entrence concluding that this junction is working efficiently.
3.4.2 Junction 4, where Fort Cumberland road meets the old exit of Melville road, has been a
seiries of slight accidents – on average one a year. As the development of the caravan site is
expected to increase the number of cars flowing through nearby junctions, it will also
increase the number of accidents. It is therefore essential that necessary measures to
prevent accidents are taken.
Proposed
development site
13. Transport Assessment Group 1
Page 12 of 28
Transportation Engineering
Figure 6, (Crash map (n.d)) of the roads near the development
Figure 7, Accident map (Road Collisions, n.d)
3.4.3 By inspection of the site, it was noticed that there is not enough street lighting and signs
leading towards the junction 4 (shown in figure 8 below), warning the drivers about the
possible merging traffic. This is most likely the biggest cause of accidents in the area. It is
therefore proposed that the developer will take responsibility for introducing street lights
and placing additional signs on Fort Cumberland Road coming up to the junction, informing
drivers about it. In addition, due to accidents occurring near junctions 2 and 4, there will be
additional non-slip surfacing introduced, in order to reduce the risk of accidents in the
future.
14. Transport Assessment Group 1
Page 13 of 28
Transportation Engineering
3.5 Traffic Count
3.5.1 In order to measure the effect that the development has on the nearby junctions, a traffic
count was conducted. Traffic was measured at peak times in the morning (8-9AM) and the
evening (5-6PM) on Tuesday 15th
of October 2013, at four junctions believed to be most
affected by the development.
3.5.2 Junction 1 is located where Ferry Road and Fort Cumberland Road meet, junction 2 is
between Handerson Road and Fort Cumberland Road, Junction 3 is located near the Eastney
Swimming pool; point where Driftwood Gardens and Melville Road cross Henderson Road.
Junction 4 is located north-east from the development site. All four junctions are shown
below in figure 8. Using the traffic flow data collected at each junction (shown in appendix
2.1), PCUs were calculated and results are illustrated in appendix 2.2.
Figure 8, Illustration of junctions affected by the development (Google, 2014)
3.6 Mode split
3.6.1 From the survey it was clear that most people commute by car, 89% of all PCUs counted that
day were cars. The second most common form of transport were bicycles, 170 cyclists were
counted, which had an equivalent of 34 PCUs (3% of total traffic). HGV1, Motorbikes and All
Bus types all ranged between 24 and 33 during the afternoon peak hour and no HGV2 were
counted.
Junction 1
Junction 2
Junction 3
Junction 4
15. Transport Assessment Group 1
Page 14 of 28
Transportation Engineering
Figure 9, Mode split for PM peak flow
3.6.2 A Census was conducted in 2013 by Hampshire City Council (Population Statistics, 2013). It
shows that 55% of people use cars and vans to travel to work, which is the highest out of all
other means of transport. Walking to work is second most preferred option, chosen by 18%
of employees. Cycling to work and using public transport are chosen with the same
frequency of 8%. Mopeds are the most rarely used, by only 1% of the workers. All results are
shown in table 1 and figure 10 below:
Means of transport 2013 (%)
Train 4
Bus, Mini Bus or Coach 8
Motorcycle, Scooter or Moped 1
Car or Van 55
Taxi or Minicab 6
Bicycle 8
On foot 18
Table 1, Information about means of transport to work, by people in Portsmouth (Population Statistics, 2013)
Figure 10, Chart illustrating the most preferred mode of transport to work (values from Population Statistics, 2013)
3.6.3 These findings suggest that although cars are the preferred method of transport for the
majority of employees in Portsmouth; walking, cycling and using public transport are very
important to the council’s agenda. By comparing these findings to results of current modes
13% 2%
81%
2% 2%
3% 1%
89%
3%
4%
Cyclists
Morotbikes
Cars
HGV 1
HGV 2
All Bus types
4%
8%
1%
55%
6%
8%
18%
Train
Bus, Mini Bus or Coach
Motorcycle, Scooter or Moped
Car or Van
Taxi or Minicab
Bicycle
On foot
PCUCount
16. Transport Assessment Group 1
Page 15 of 28
Transportation Engineering
of transport near the development (figure 9), it can be seen that the area is not as balanced
as the rest of Portsmouth.
3.6.4 This development will therefore aim to encourage other means of transport such as walking,
cycling and public transport through different means stated in the ‘Travel Plan’ section of
this report (Appendix 4).
17. Transport Assessment Group 1
Page 16 of 28
Transportation Engineering
4.0 Proposed Development
4.0.1 The overall layout of the proposed development is displayed in the drawings found in
appendix 1.1. The site has an area of 50,000m2
(5 hectares), the land uses as outlined by the
client include;
1. Office blocks: The site contains five office blocks, making a total floor space of 8000m2
.
2. 2 -bed flats: There are five blocks of flats containing 40 dwellings of 2 bed flats each.
3. 3-bed detached: the site contains 50 detached dwellings comprising 3 bedrooms.
4.0.2 The access to this site is presently situated on Melville road. A preliminary discussion with
PCC coupled with an earlier scoping study concluded that the realignment of Melville Road is
the appropriate access and egress solution.
4.0.3 The site will be in operation between 16 - 24 hours daily; this is due to the nature of the
development plan for a site which includes housing development (Department for
Transport, 2007).
Figure 11 Melville Road Realignment
4.1 Road Access
4.1.1 The access into the site will be the proposed realignment of Melville Road, which will serve
as the main through road within the development. The road will link Fort Cumberland (north
of the development) to Henderson (west of the development). The site layout drawing is
shown in appendix 1.1.
4.1.2 The development will consist of minor roads as well as the realigned Melville Road which
will serve as the main link road to all the other minor roads within the development. These
roads will be designed to achieve a 20mph speed limit. The access road horizontal alignment
is designed to meet the manual for streets standard and the horizontal alignment
calculations which can be found in appendix 3.4. The width of the main access road is 7.3m,
Melville Road Realignment
18. Transport Assessment Group 1
Page 17 of 28
Transportation Engineering
in order to meet the design criteria for a 20mph speed limit in keeping with policy T10 (East
Hampshire (EHDC), 2006), the following have been introduced:
1. On-street parking (2m by 6m on both sides of the road)
2. A bus stop on both approaches conforming to the T2 policy from the East Hampshire Local
Plan (East Hampshire (EHDC), 2006).
3. Straights and bends meets manual for street 2 horizontal alignment standard for a 20mph
road.
4.1.3 Because a new priority junction will be introduced at each end of the new Melville Road,
visibility splays (x=2.4m and y=25) (MfS2) at both ends of the road is designed to meet the
manual for streets standards. All roads within the development will have adequate
provisions for pedestrians and cyclists in accordance with paragraph 35 of the NPPF
(Communities and local Government, 2012); all roads will be designed to have a minimum
footway width of 2.0m, (a cross fall of 1:40 or 2.5%), cyclists are encouraged to cycle on the
road (this is also aimed at keeping vehicle speed to the required limit), design of shared use
path will be provided wherever possible (although most of the minor roads are designed to
be quiet, therefore making it safe for pedestrians and cyclists). A bus stop will be provided
within the development to encourage a more sustainable mode of travel. (Cordwell, 2010)
4.1.4 All these provision will be designed in a way that integrates them into the existing and
surrounding transport infrastructure.
4.2 Parking Provision
4.2.1 The general arrangement drawing in appendix 1.1 shows 150 off street car parking spaces
(including disabled parking) with minimal on street car parking space. There will be more
emphases on sustainable modes of travel by providing cycle parking in accordance with T12
of the East Hampshire Local Plan (East Hampshire (EHDC), 2006). Each house within the
development will be allocated one car parking space. Offices will be provided with car
parking close to their office block with a limited amount of spaces, making it a requirement
for offices to encourage their staff to choose other modes of travel (such as cycling, public
transport and car pulling) for work (thereby reducing congestion within the development).
4.2.2 Safe parking and well lit spaces are also provided for cyclists and motorcyclists within the
development, this is aimed at encouraging residents to travel by sustainable transport
modes.
19. Transport Assessment Group 1
Page 18 of 28
Transportation Engineering
4.3 Character of the design
4.3.1 The local area around the site mainly consists of new build properties for domestic use;
housing, flats, community centre etc. This project has adopted the basic architecture of the
surrounding houses and flat complexes to help integrate the new development into the
surrounding area (Policy T9 (East Hampshire (EHDC), 2006)).
4.3.2 The existing sites location is situated next to the beach. Taking advantage of this natural
entity the location of most of the high rise buildings have been placed further away from the
beach or in a place that does not obstruct any smaller buildings giving the majority of the
new properties a sea view.
4.3.3 Already located on this site is a functioning cycle lane which has been integrated into the
proposed development.
4.3.4 This plan gives the local populace a clear layout of the network of streets. It also highlights
the natural assets of the development, such as the small park surrounding the sustainable
urban drainage pond and the beach giving the new development a welcoming and people
friendly environment.
4.4 Trip generation
4.4.1 In order to predict the amount of traffic introduced into the junctions by the development, a
count of trips from similar sites was conducted and scaled accordingly to match the size of
the development, results for which can be seen in appendix 2.6.
4.4.2 Sites used to estimate the trip generation of houses and flats were 24 detached houses on
Driftwood Gardens and 32 flats on Centurion Gate, shown in figure 12. Offices used to
estimate the trip generation were located on the corner of Kingston Crescent and Heathfield
Road and had floor area of 1800 m2
. The survey was conducted on Tuesday 29th
of October
2013, weekday during a peak month to represent the worst case scenario where traffic
movements are at their greatest.
Figure 12, Sites used to estimate trips generated by houses and flats (Google, 2014)
Detached houses
Flats
Development
20. Transport Assessment Group 1
Page 19 of 28
Transportation Engineering
4.4.3 The detached houses and flats were located within close proximity to the proposed
development and both were recently built. The offices had the most comparable attributes
to the offices proposed by the development. This means that trips calculated were a good
representation of what can be expected from the new site.
4.5 Trips Distribution
4.5.1 The proposed development has exits at two junctions; 3 and 4 (shown in figure 8). The ratio
of trips generated at each junction was assumed from the placement of buildings in the
development and can be seen in appendix 2.7.
4.5.2 Most houses are placed near junction 3 (can be seen from “site layout”, appendix 1.1),
hence it is expected that the trips generated at that junction caused by detached houses will
be higher. Ratio of 7:3 was therefore assumed. Similarly most flats are distributed near
junction 4; hence a ratio of 3:7 was adopted. As offices are scattered evenly throughout the
development, it is expected that they will generate equal number of trips at each junction.
By inspecting the ratio at which each junction distributes its’ flow, the additional trips
generated by the development were distributed consequently. The amount of trips
generated in each direction at each junction is shown in appendix 2.3.
4.5.3 To calculate the increase in traffic flow in 5 years, a factor of 1.043 for AM and 1.0442 for
PM (obtained using TEMPro (Department of Transport, 2013)) was applied to each value
(results shown in appendix 2.4). In order to calculate AADT, the PM values were multiplied
by 24 and divided by 2.63 (MacKay, 1997). The new development is expected to generate
the AADT at each junction, shown in appendix 2.5.
4.5.4 To accurately assume the AADT through the development, a number of cars going in at one
junction and out at the other has been calculated. There were four possible values for this,
as shown in appendix 2.8, and the highest value has been chosen as the design value to
ensure the design is viable at the highest flows.
4.5.5 The most traffic flow occurred during the afternoon peak flow, and the most traffic (AADT
equivalent of 913 PCUs) will travel through the development from junction 3 to 4 (west to
east).
21. Transport Assessment Group 1
Page 20 of 28
Transportation Engineering
4.6 Alternate route “Rat Run”
Figure 13, possible rat run route
4.6.1. Initial concerns were raised about the development being used as a shortcut to cut through
from Henderson road (A) to Fort Cumberland road (B). During traffic counts it has been
noted that around 37 PCUs use route 1 to travel from A to B during the evening peak time.
This gives an approximate 400 PCUs daily flow.
4.6.2. The risk of vehicles using route 2 as a shortcut was assessed by comparing the distance and
the speed limit of both routes. Route 1 has a distance of 4.9 km and speed limits of 30 mph
and 20 mph respectively, route 2 has a greater distance of 5.5 km and a constant speed limit
of 20 mph, which makes the development much less appealing to use as a “rat run”.
4.6.3. Additional factors discouraging drivers to use route 2 is the width of the road and number of
bends required to be executed. Due to on-road parking, the effective width of the road is
reduced to 3.3m, forcing the vehicles to stop in order to pass one another. Route 2 also
includes more bends and requires cars to stop at junctions 3 and 4 (A and B in figure 13).
This in effect lengthens the journey time of the route, and makes it very unappealing to non-
residents.
4.6.4. The risk of route 2 being used as a rat run is therefore very unlikely as it would increase the
journey time greatly as well as require additional stops and concentration throughout the
development.
A
B
1
2
22. Transport Assessment Group 1
Page 21 of 28
Transportation Engineering
4.7 Junctions
4.7.1 Due to increase in traffic flow, each of the 4 junctions was tested for flow capacity. They
were all modelled as T-junctions for simplicity of calculations, which can be seen in appendix
3.1. All junctions passed the requirements presented by the development and no further
action is required in order to increase their capacity.
4.8 Drainage
4.8.1 The city of Portsmouth is situated in a low lying area directly on the coastline off the English
Channel, where it faces a severe flood risk. The site has a detailed drainage system to ensure
a safe and habitable environment to live. Appendix 1.2 holds the overall layout of the storm
water drainage system showing the details of manholes, pipe levels and gulley positions. The
underground pipe network allows all the rainfall to run freely down the pipes into a SUDS
pond that retains the volume of water (situated south east of the development). If by
chance a freak flooding occurs, the SUDS pond includes a tidal flap which allows overflowing
water to transfer into the sea. This drainage method is aimed to provide an environmentally
friendly emergency procedure.
4.8.2 The idea of using the SUDS pond is to create a natural system that is cost effective with low
environmental impacts. The pond includes three vortex chambers allowing free flowing dirty
water to be collected through this unique design that controls and cleans the water whilst
transferring it into a pond. The vortex chamber has no moving parts so no maintenance is
needed, whilst the large cross-sectional area reduces the risk of blockage. The pond is one
metre deep preventing little risk of drowning for the local residents, with a sloped entry the
hazard is deemed nil with no boundary fence needed, however signs will be put in place not
to enter. The pond will also be decorated with reeves to create a wildlife habitat as well as
producing a pleasant asset for the development, encouraging the use of public areas as
stated in paragraph 69 of the NPPF (Communities and local Government, 2012).
4.8.3 The development has gully pots either side of the road and spaced no more than 25 metres
allowing the roads to be safe to walk, cycle and transport around without the risk of
flooding. The roads are constructed with a camber allowing a 1 in 40 cross fall directing the
rainwater into the closest gully where it connects into the main line.
4.8.4 Consideration of alternate drainage mechanisms was taken into account. The use of a
French drainage system also known as a filtration drain will be constructed in the car parks,
no kerbs surrounding the parking areas allows the cross fall camber to direct the rainwater
into the drains that link into the main line, shown in the drainage layout drawing in appendix
1.2. This drainage system is cost effective and low maintenance complimenting the
23. Transport Assessment Group 1
Page 22 of 28
Transportation Engineering
environmental aspect of this transport assessment. Both offices and flats will include green
roofs that are designed to create a free habitat for wildlife and clean the rainwater that will
transfer down the gully pipes into the underground pipe network. Whilst the office and flat
car parks have alternative drainage, the housing complex will use a forced system with the
use of swales, the grassed area depression which guides surface run-off overland from the
house towards the road where it falls into a nearby gully.
4.8.5 Appendix 3.2 holds the calculations and drainage specification using the Lloyd Davies
method. Each pipe run includes different gradients and pipe sizes to minimise costs for the
client.
Sustainable Drainage
Houses
Swales filter and transfer the
drainage systems around the
housing complex to the main
line
Offices
Green roofs are designed to
create a disturbance free habitat
for birds.
Car Park
French Drainage system
Filters water and low
maintenance
SUDS
SUDS pond with a max volume
of 440m3
.
Installed tidal flap to allow
overflowing water to transfer
into the sea.
Clean and filtered water
Includes area for recreation and
disturbance free for wildlife
Figure 14 Sustainable Drainage
24. Transport Assessment Group 1
Page 23 of 28
Transportation Engineering
4.9 Pavement design
4.9.1 As discussed with the client a pavement design has been produced in order to help with
coasting. Below is the suggested pavement option;
4.9.2 The pavement consists of a HRA surface course with a standard thickness of 50mm
(Assuming the use of a HDM base and an optional binder course). The binder course should
be at least 50mm thick and must be of the same material as the base, the remainder is made
up of a 150mm HDM base (category A) and a 200mm class 2 foundation (200MPa stiffness)
over a subgrade with a 5% CBR. (Figure 15).
4.9.3 Due to the calculated msa equalling zero throughout the development this option is the
suggested solution for any road pavement design throughout the design.
4.9.4 For further details on the calculations and design of this pavement see appendix 3.3 and
drawing 1.1.
Subgrade (5% CBR)
200mm Class 2 Foundation (200MPa Stiffness)
150mm HBM base, Category A
50mm Asphalt, HDM binder course
50mm Asphalt, HRA surface course
Figure 15, Pavement Design
25. Transport Assessment Group 1
Page 24 of 28
Transportation Engineering
5.0 Appraising the Impact of the Proposed Development.
5.0.1 The government’s five objectives (Department for Transport, 2007) for transport include the
following:
5.1 Environmental
5.1.1 The development has been designed to be environmentally friendly. The development
encourages the use of sustainable mode of transport e.g. public transport, walking & cycling,
car sharing (Policy PCS17 (Portsmouth City Council, 2012)). It is hoped that this will have a
positive impact on the environment by reducing traffic noise and greenhouse gas emissions
resulting from car use. This will also improve local air quality and street liveability.
5.1.2 The newly realignment Melville road has been designed to (manual for street 2) standard
and does not encourage external traffic except traffic going in and out of the development.
The provision of on street parking on both sides of the road, bus services and tight
carriageway width will ensure that motorist do not consider this route as a ‘rat run’. This will
ensure that the development does not experience congestion from external traffic.
5.2 Economy
5.2.1 As part of the travel plan, the development will encourage the businesses and offices to
encourage their staffs & employees to travel to work in a more sustainable way e.g. cycling,
using public transport and car-sharing. It is hoped that this will improve the economic
efficiency of transport facilities within the development.
5.2.2 The development will invariably create employment for local residents. This should improve
the wider economy in Portsmouth. Public transport and taxies will be allowed to access the
side, this will form part of the travel plan to encourage the use of other transport modes.
5.3 Safety
5.3.1 The issue of safety is well addressed within the development. Road within the development
is well overlooked by houses. The entire development is designed to eliminate any obscure
areas. Street lights will be installed within the development to (MfS2) street lighting
standards. This should invariably improve security and eliminate perception of insecurity.
5.3.2 Road safety concerns as been significantly mitigated by proper design of road alignment to
(MfS) standards. The road design will achieve its design speed limit of 20mph; this will be
achieved through the different feature dotted along the highway. This should invariable
keep all road users safe and eliminate fears of accident (Policy T10 (East Hampshire (EHDC),
2006).
26. Transport Assessment Group 1
Page 25 of 28
Transportation Engineering
5.4 Accessibility
5.4.1 The development is well accessible for both pedestrians and cyclists. The development
consists of pedestrian footpaths (2.0m wide), quiet minor roads and shared use path (3.0m
wide). This can be found in the general arrangement drawing (appendix 1.1).
5.4.2 There are bus stops within the development which could be served by the first bus service
(No 15). The closest bus stop is located just off the Fort Cumberland road junction. The
closest train station is 1.7miles from the development, which is also accessible from the
development by bus services to Portsmouth City Centre. The development is also accessible
by cars & taxis for those who have essential use for automobiles.
5.5 Integration
5.5.1 The design of the development will address any integration issue by promoting integration
between all stakeholders within the development e.g. businesses, offices, motorists, non-
motorists etc.
5.5.2 The proposed development is well integrated into the wider National Planning Policy
Framework and the local policies. This ensures that this is a sustainable development.
5.5.3 The development streetscape also encourages social inclusivity, as the roads, houses and
other facilities are compactly positioned, all roads are properly linked together and are all
within reach. The grassed area within the development creates an atmosphere for social
inclusivity, where people of all ages can socialise. It is hoped that this will address any
integration issues within the development.
27. Transport Assessment Group 1
Page 26 of 28
Transportation Engineering
6.0 Conclusion
6.0.1 The development of the Southsea Leisure Park consists of residential housing and office
blocks provided with efficient parking.
6.0.2 The proposed development encourages smarter choices to travel into the development.
Influencing members of the public to use public transport by marketing transport
information of local bus routes, facilitating bike storage and shared car travel.
6.0.3 The development includes sufficient junctions that will not increase traffic flow proven in the
junction capacity calculations, plus junction 2 and 4 (shown in section 3.5.2, figure 8) with
new improved lighting and skid resistant surfaces and sign posts leading onto the junction
creating a safe approach into the new development. Using these methods is a cost effective
way to improve the safety of the existing junction.
6.0.4 The Road situated off Fort Cumberland is in need of repairs and is not suitable for the influx
of traffic that will occur due to the introduction of the new development. It is therefore
proposed that the developer will reconstruct the road to the pavement specifications
designated in this developments’ design.
6.0.5 The vision of this assessment is to provide a safe and sustainable environment for the
community to travel in and out with easy, efficient and cost effective methods of transport
with the use of well-designed streets and junctions to provide an easily navigated
development.
6.0.6 This transport assessment has been carried out thoroughly and it can be concluded that this
development will have a positive impact on the surrounding highway network.
28. Transport Assessment Group 1
Page 27 of 28
Transportation Engineering
Bibliography
Communities and local Government. (2012). National Planning Policy Framework. London:
Department for Communities and local Government.
Cordwell, J. (2010). Manual for streets 2. London: Chartered Institution of Highways and
Transportation .
Council, P. c. (2014, April). Public transport information. Retrieved April 3, 2014, from Portsmouth
city council: http://www.portsmouth.gov.uk/living/592.html
Crash Map. (n.d.). Crash Map. Retrieved from crashmap: www.crashmap.co.uk
Department for Transport. (2007). Guidance on Transport. London: TSO.
Department of Transport. (2013, January 18). Traffic Groath Estimates. Retrieved from Department
of Transport Website: https://www.gov.uk/government/organisations/department-for-
transport
East Hampshire (EHDC). (2006, August 1). Chapter 4 - Transport, Energy and Pollution. Retrieved
from East Hampshire EHDC Partners: http://localplan.easthants.gov.uk/written/cpt4.htm
Google. (2014). Google Maps. Retrieved from Google: www.google.co.uk/maps
MacKay, W. (1997). Transport in the Urban Environment. 1st ed. Institution of Highways &
Transportation.
Population Statistics, 2001. Summary table. Hampshire City Council. Retrieved from Hampshire City
Council Website: http://www3.hants.gov.uk/factsandfigures/population-
statistics/census_pages/census_information/pop_travel_to_work.htm
Portsmouth City Council. (2012). The Portsmouth Plan - Portsmouth's core strategy. Portsmouth:
Portsmouth City Council.
PCC. (2012). Park and Ride scheme. Available: http://www.visitportsmouth.co.uk/visitor-
information/travel/by-car. Last accessed 01/05/2014.
Road Collisions. (n.d.). Retrieved from Road Collisions: www.road-collisions.dft.gov.uk
TFL. (2010). Transport assessment best practice. Retrieved from Transport for London Website:
http://www.tfl.gov.uk/assets/downloads/transport-assessment-best-practice-guidance.pdf
The Highways Agency. (1995). Geometric Design of Major/Minor Priority Junctions. London: The
Highways Agency.
Transport routes in Portsmouth (n.d.). Retrieved from Portsmouth City Council Website:
www.portsmouth.gov.uk