Download to read offline
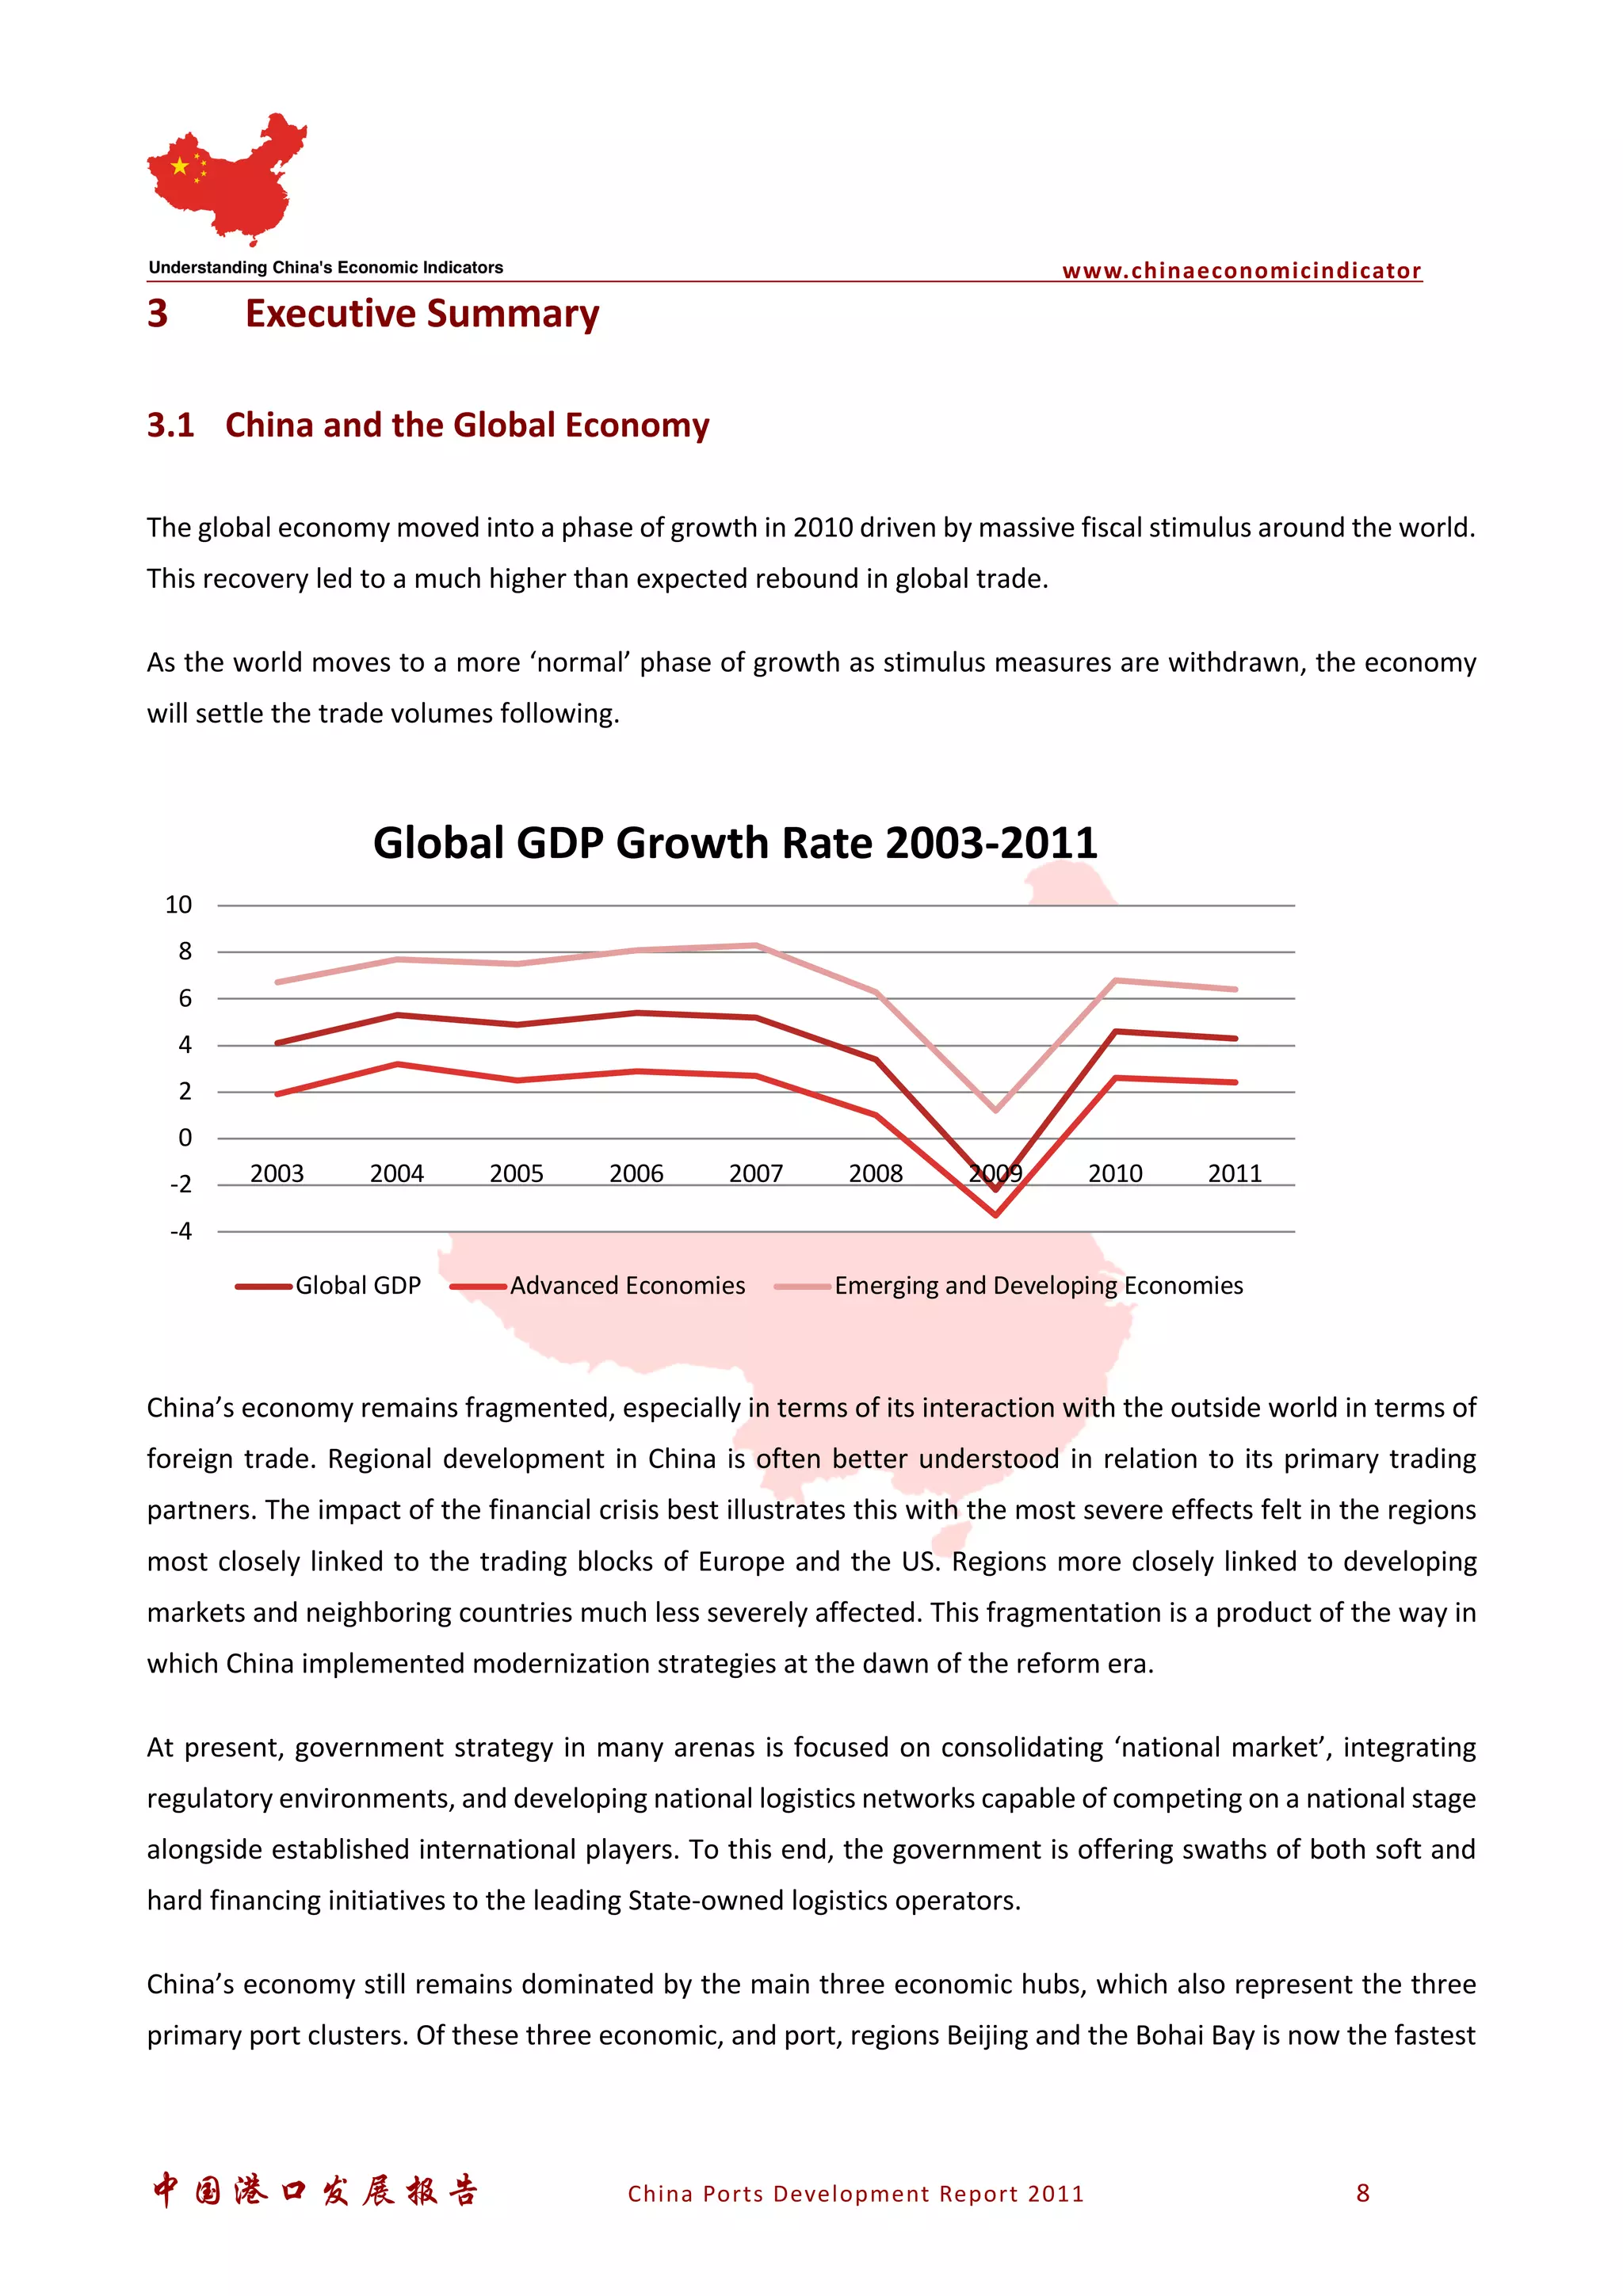
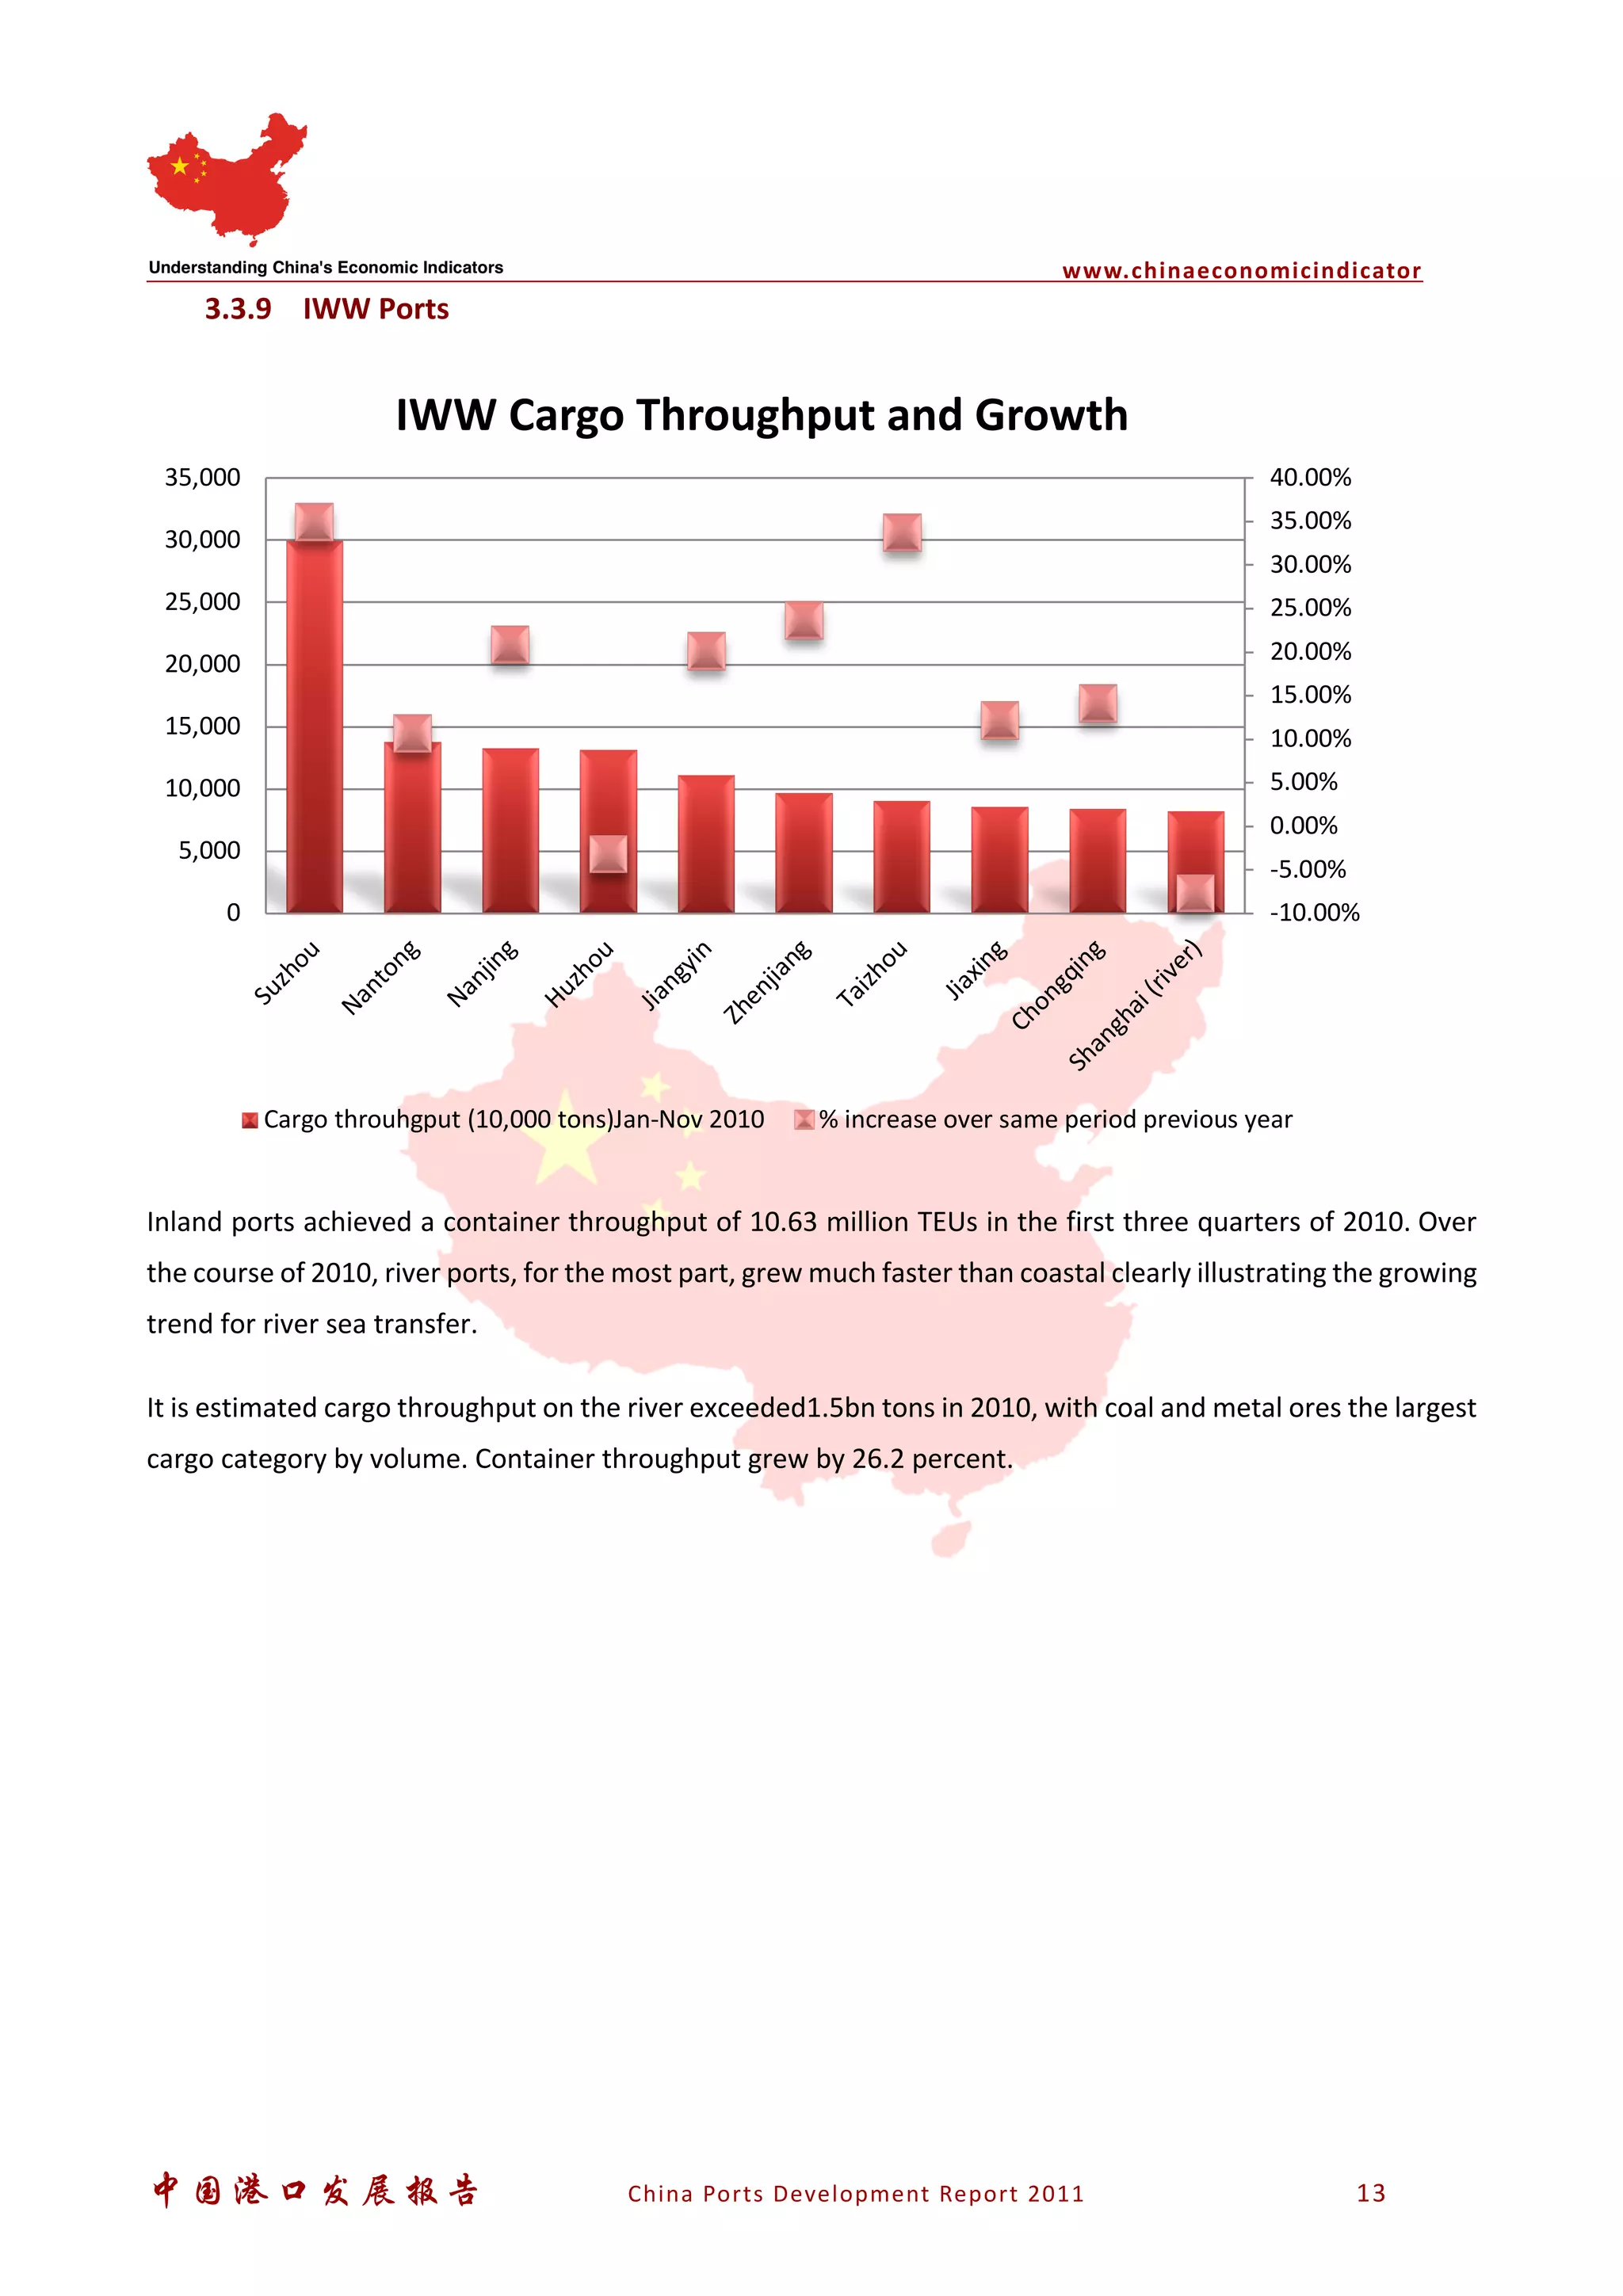
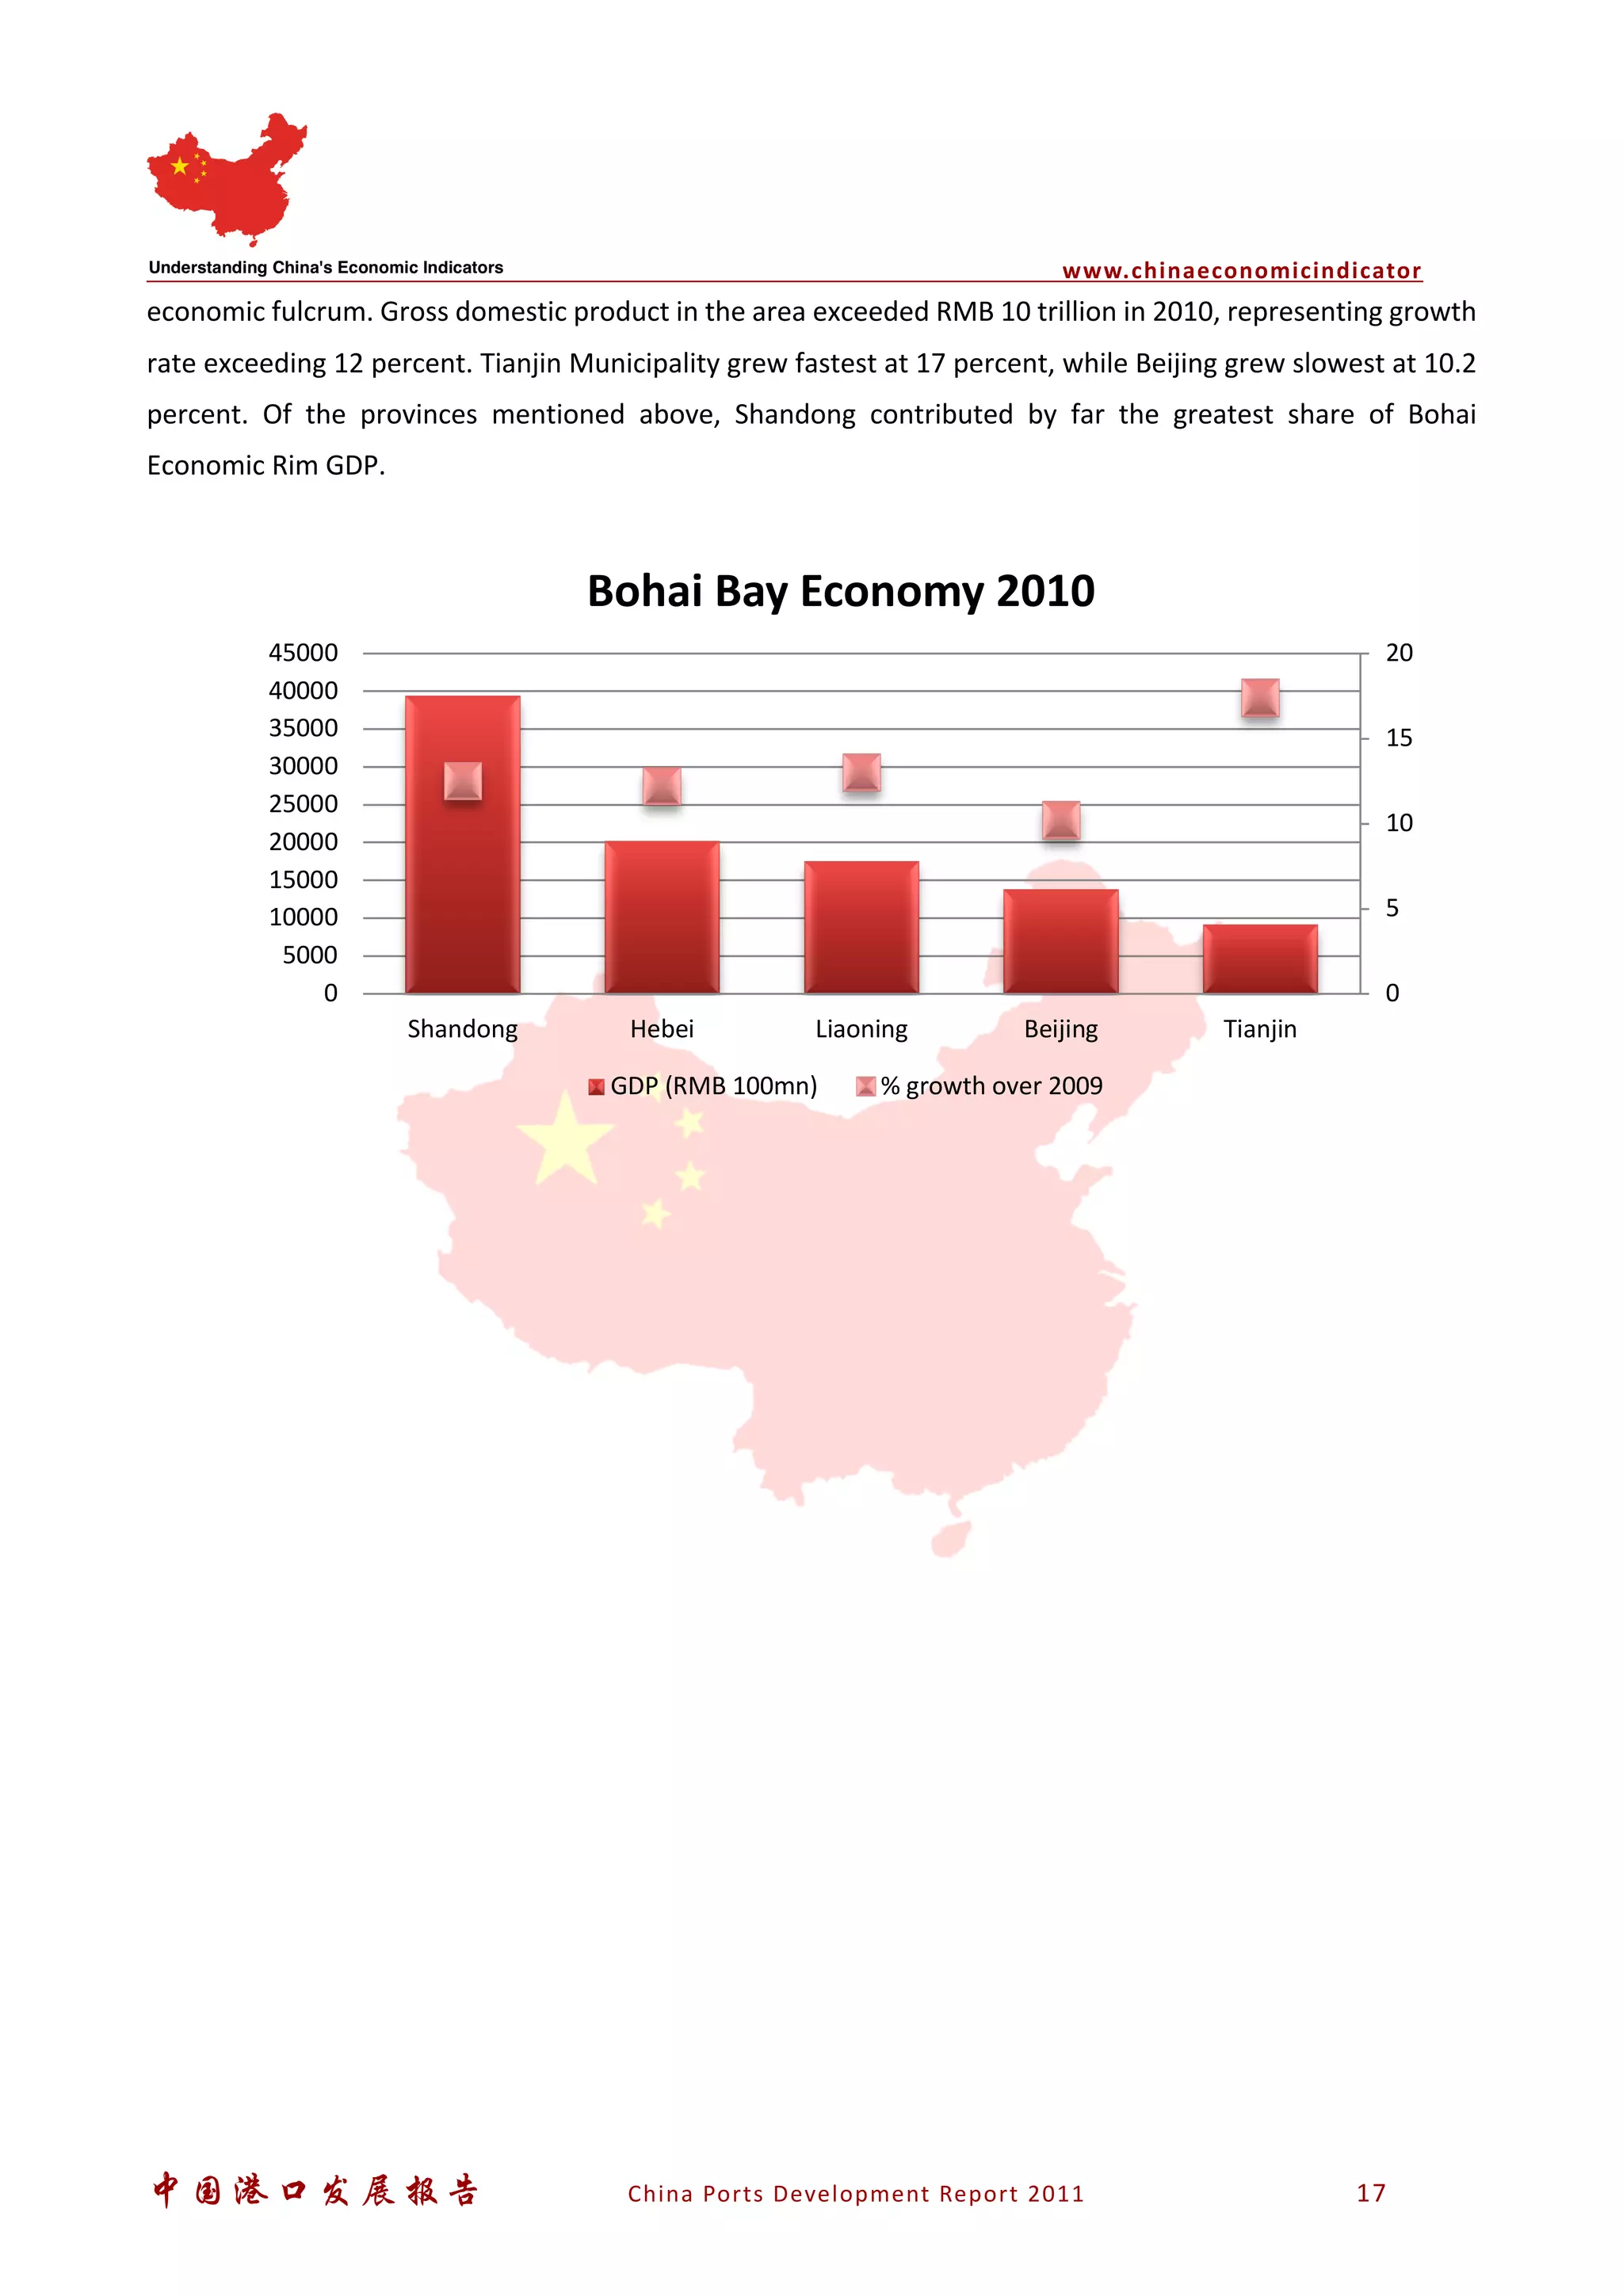


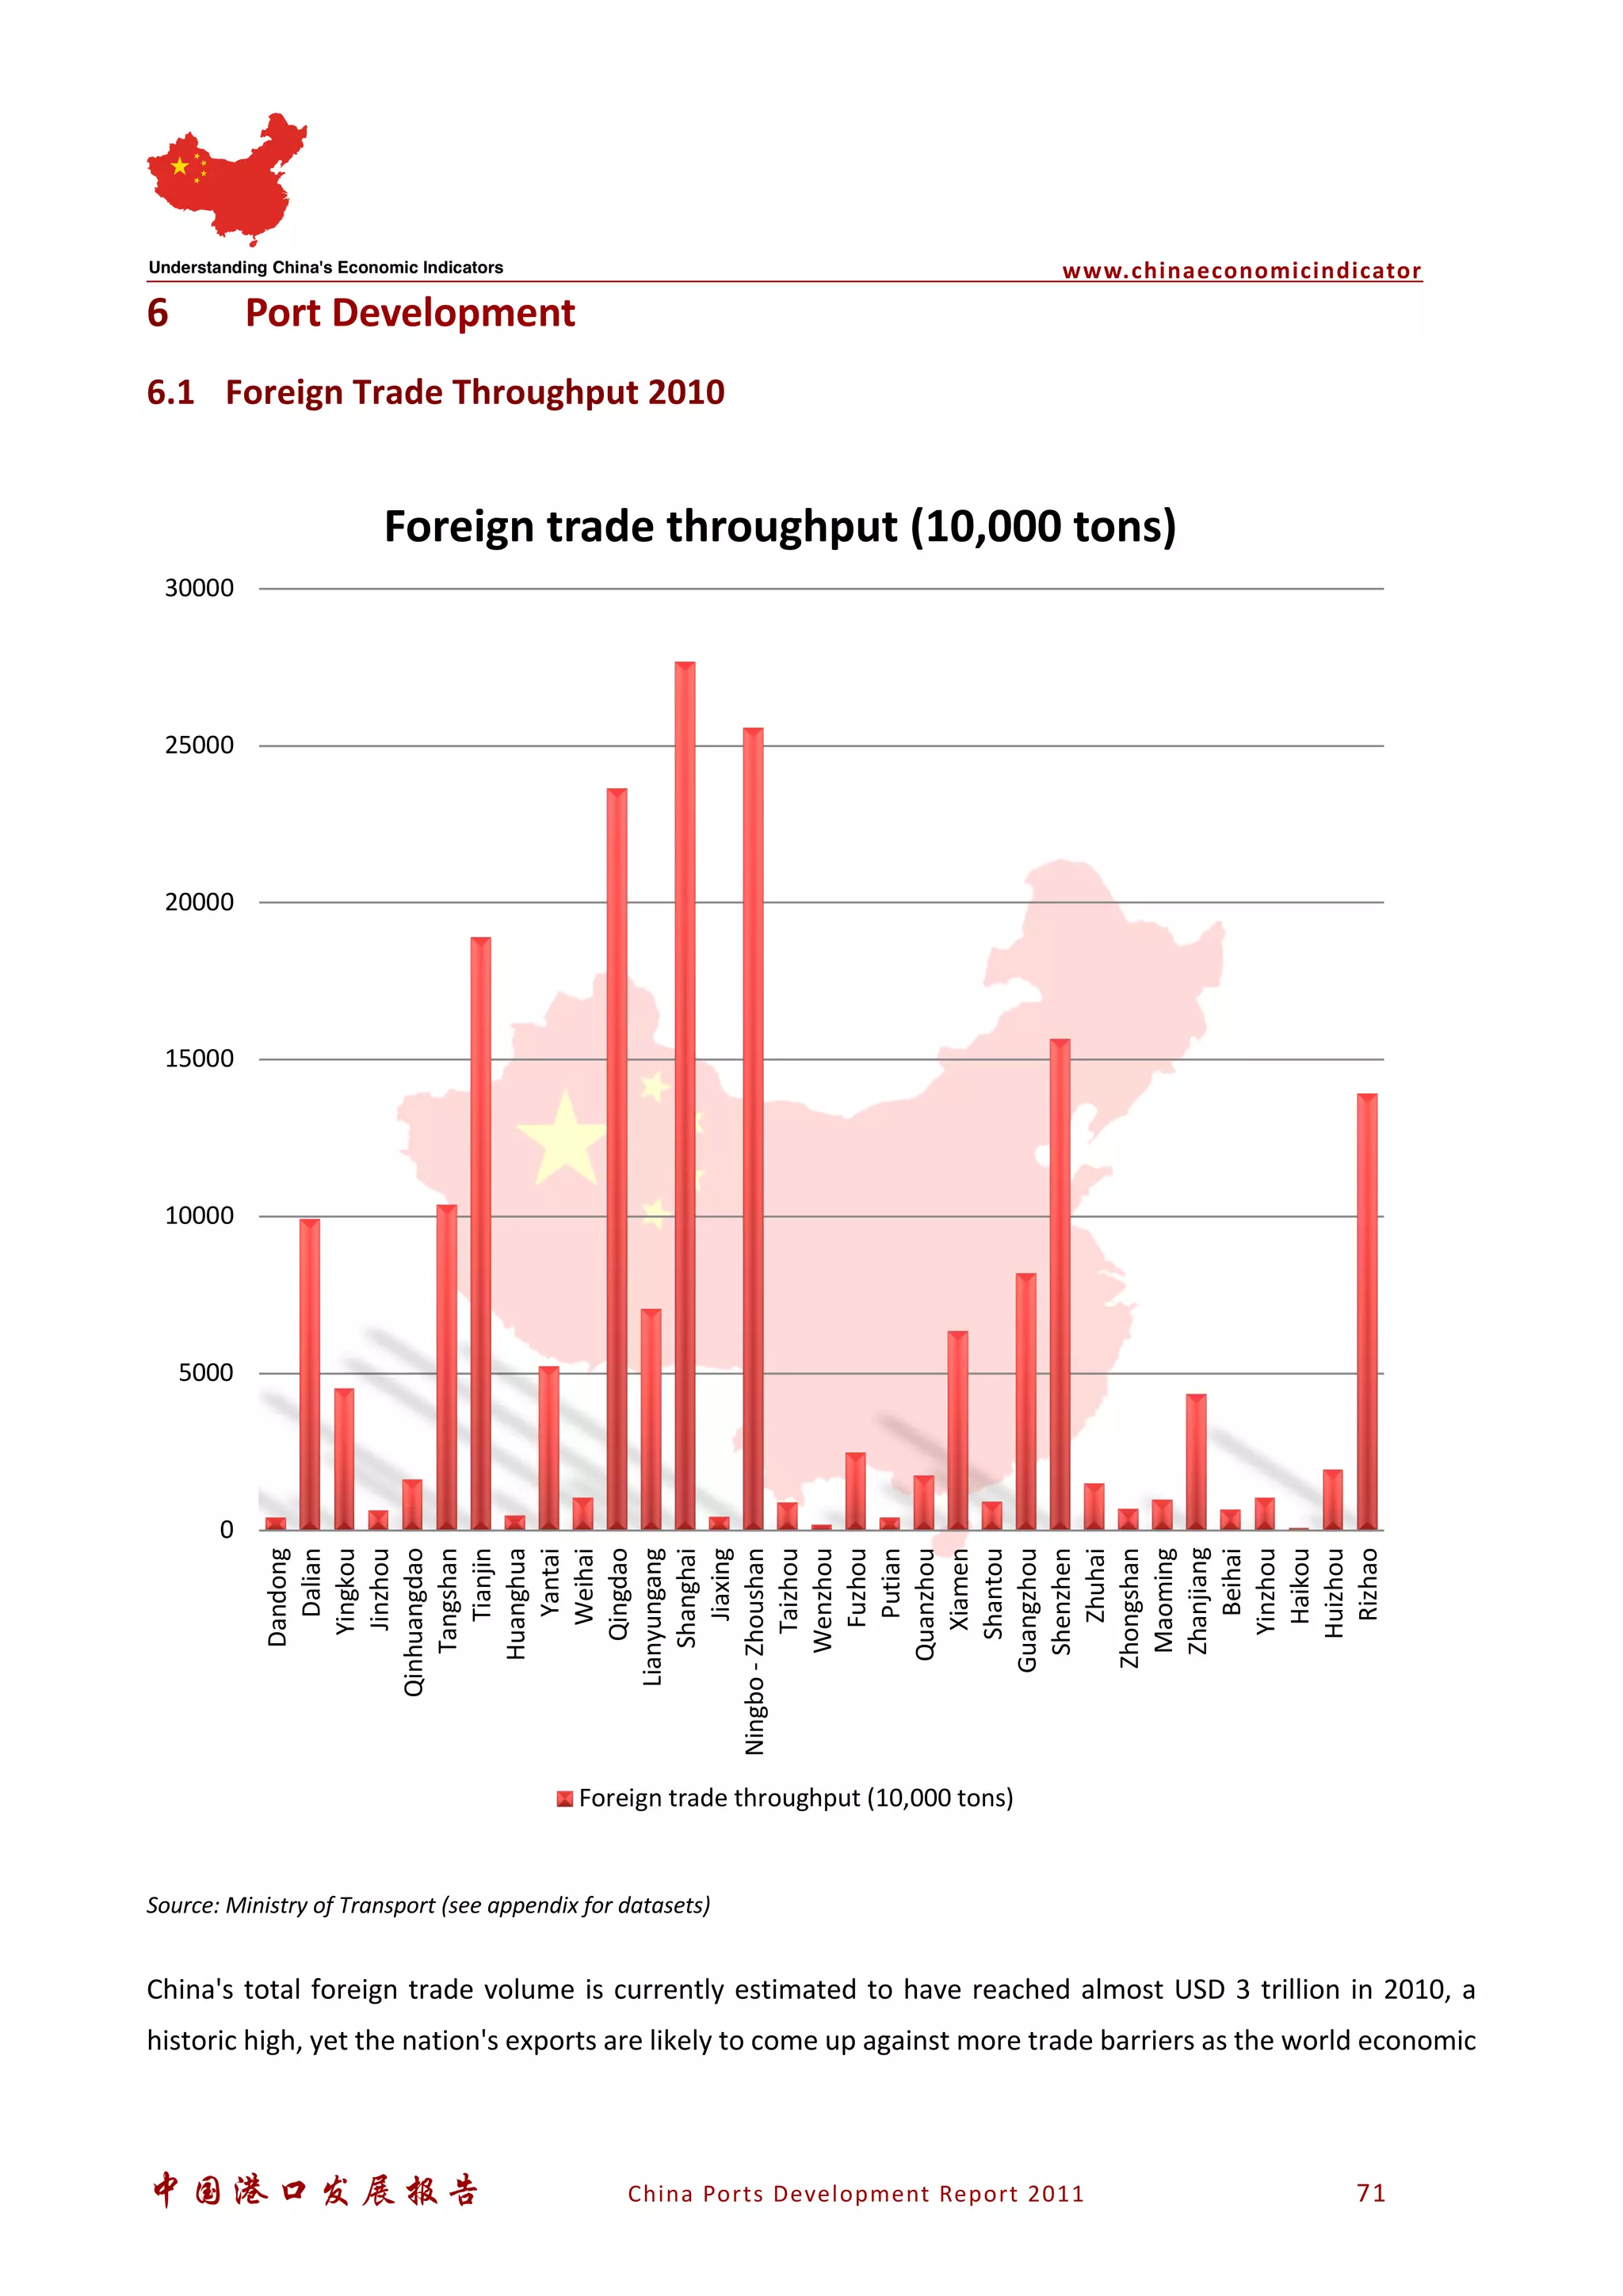
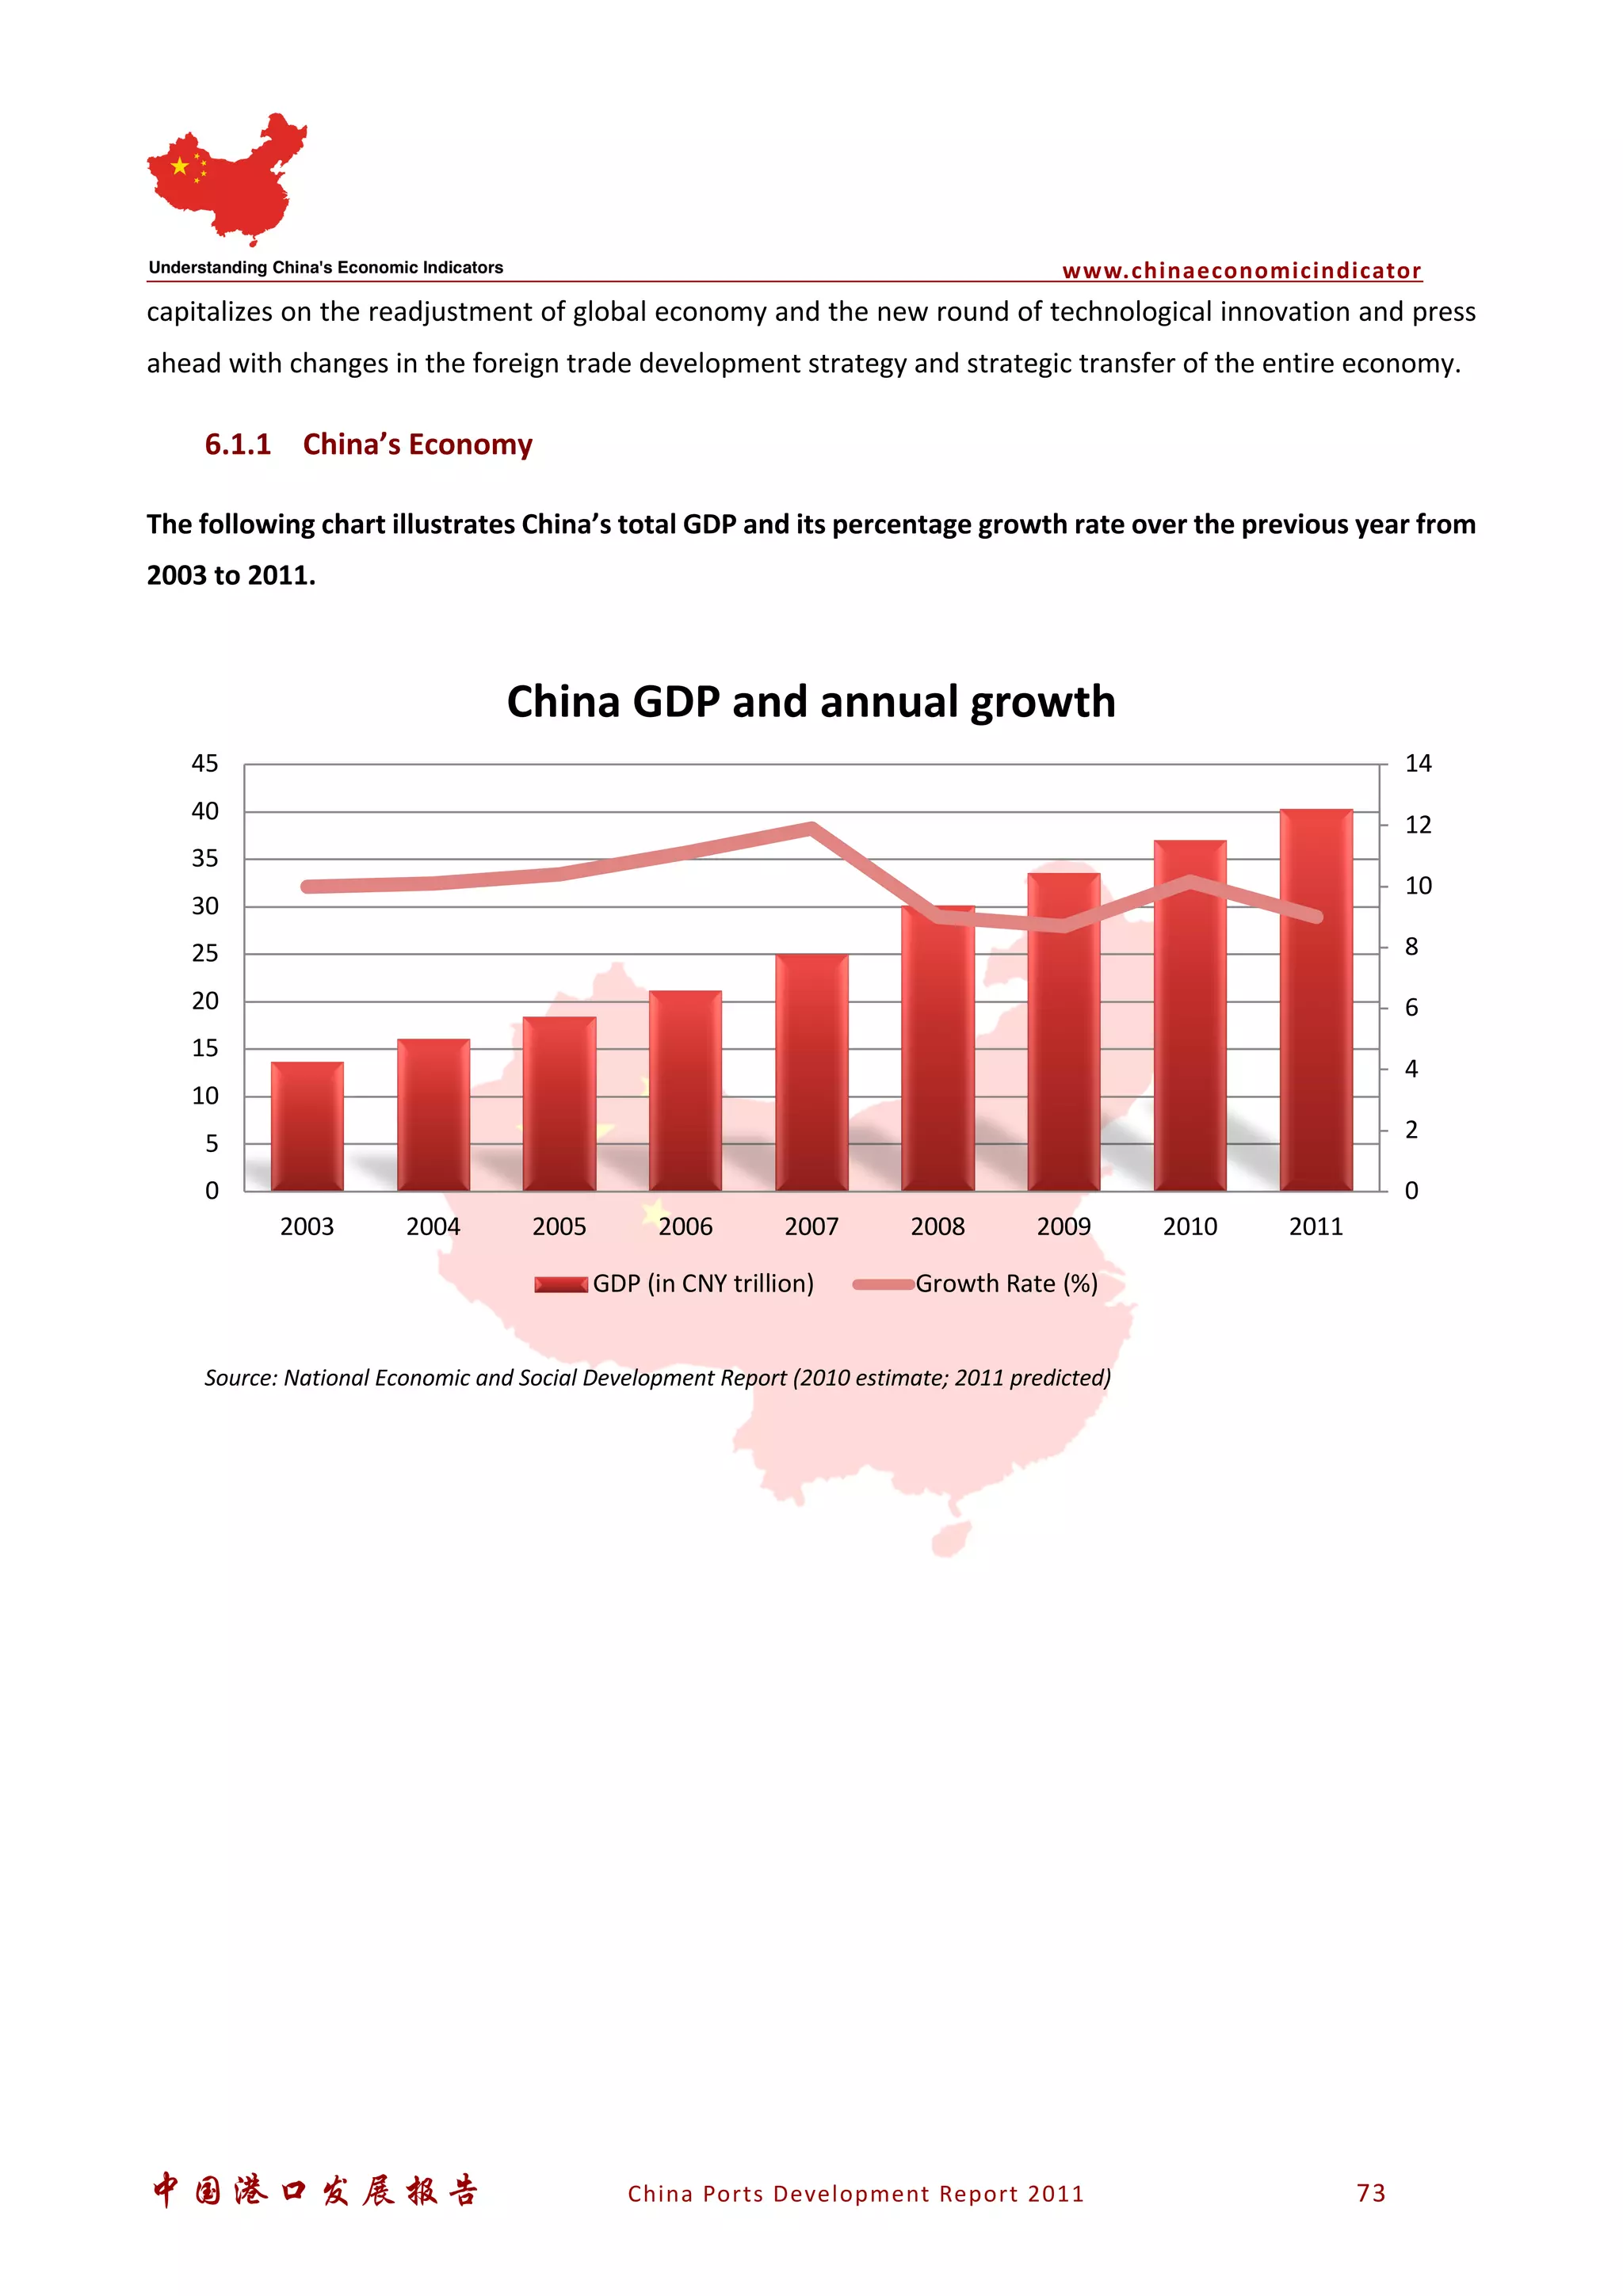
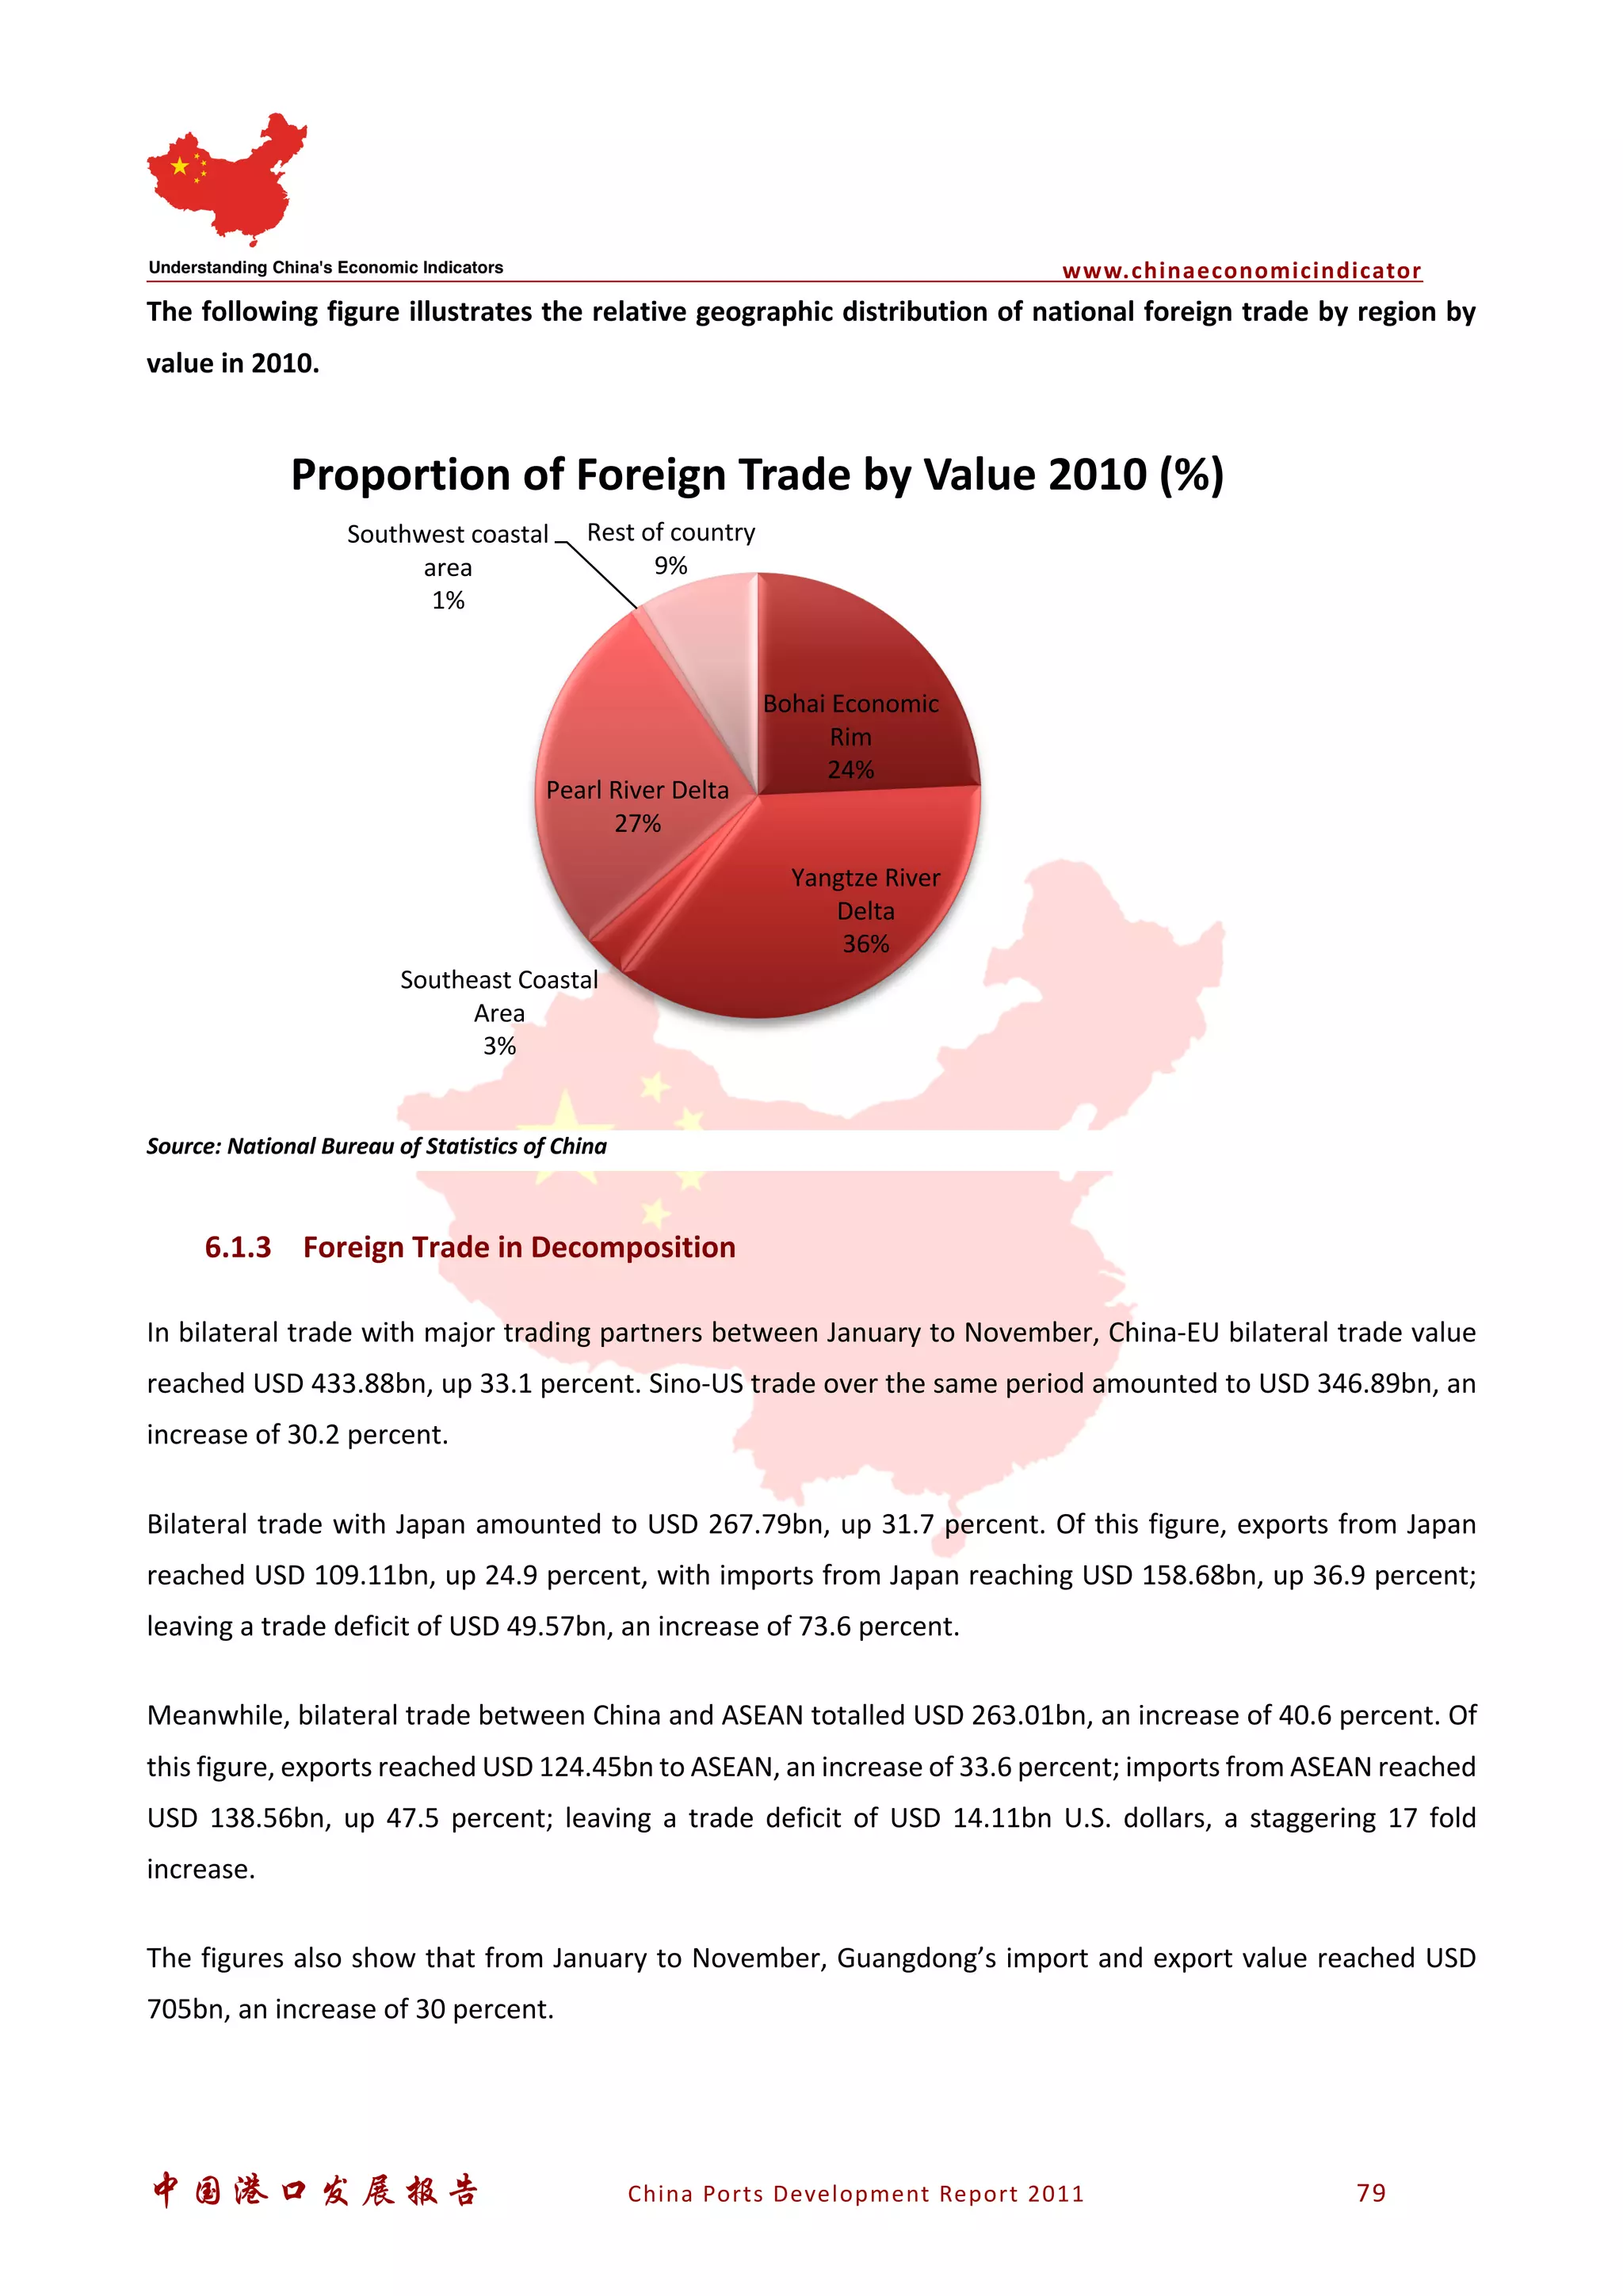
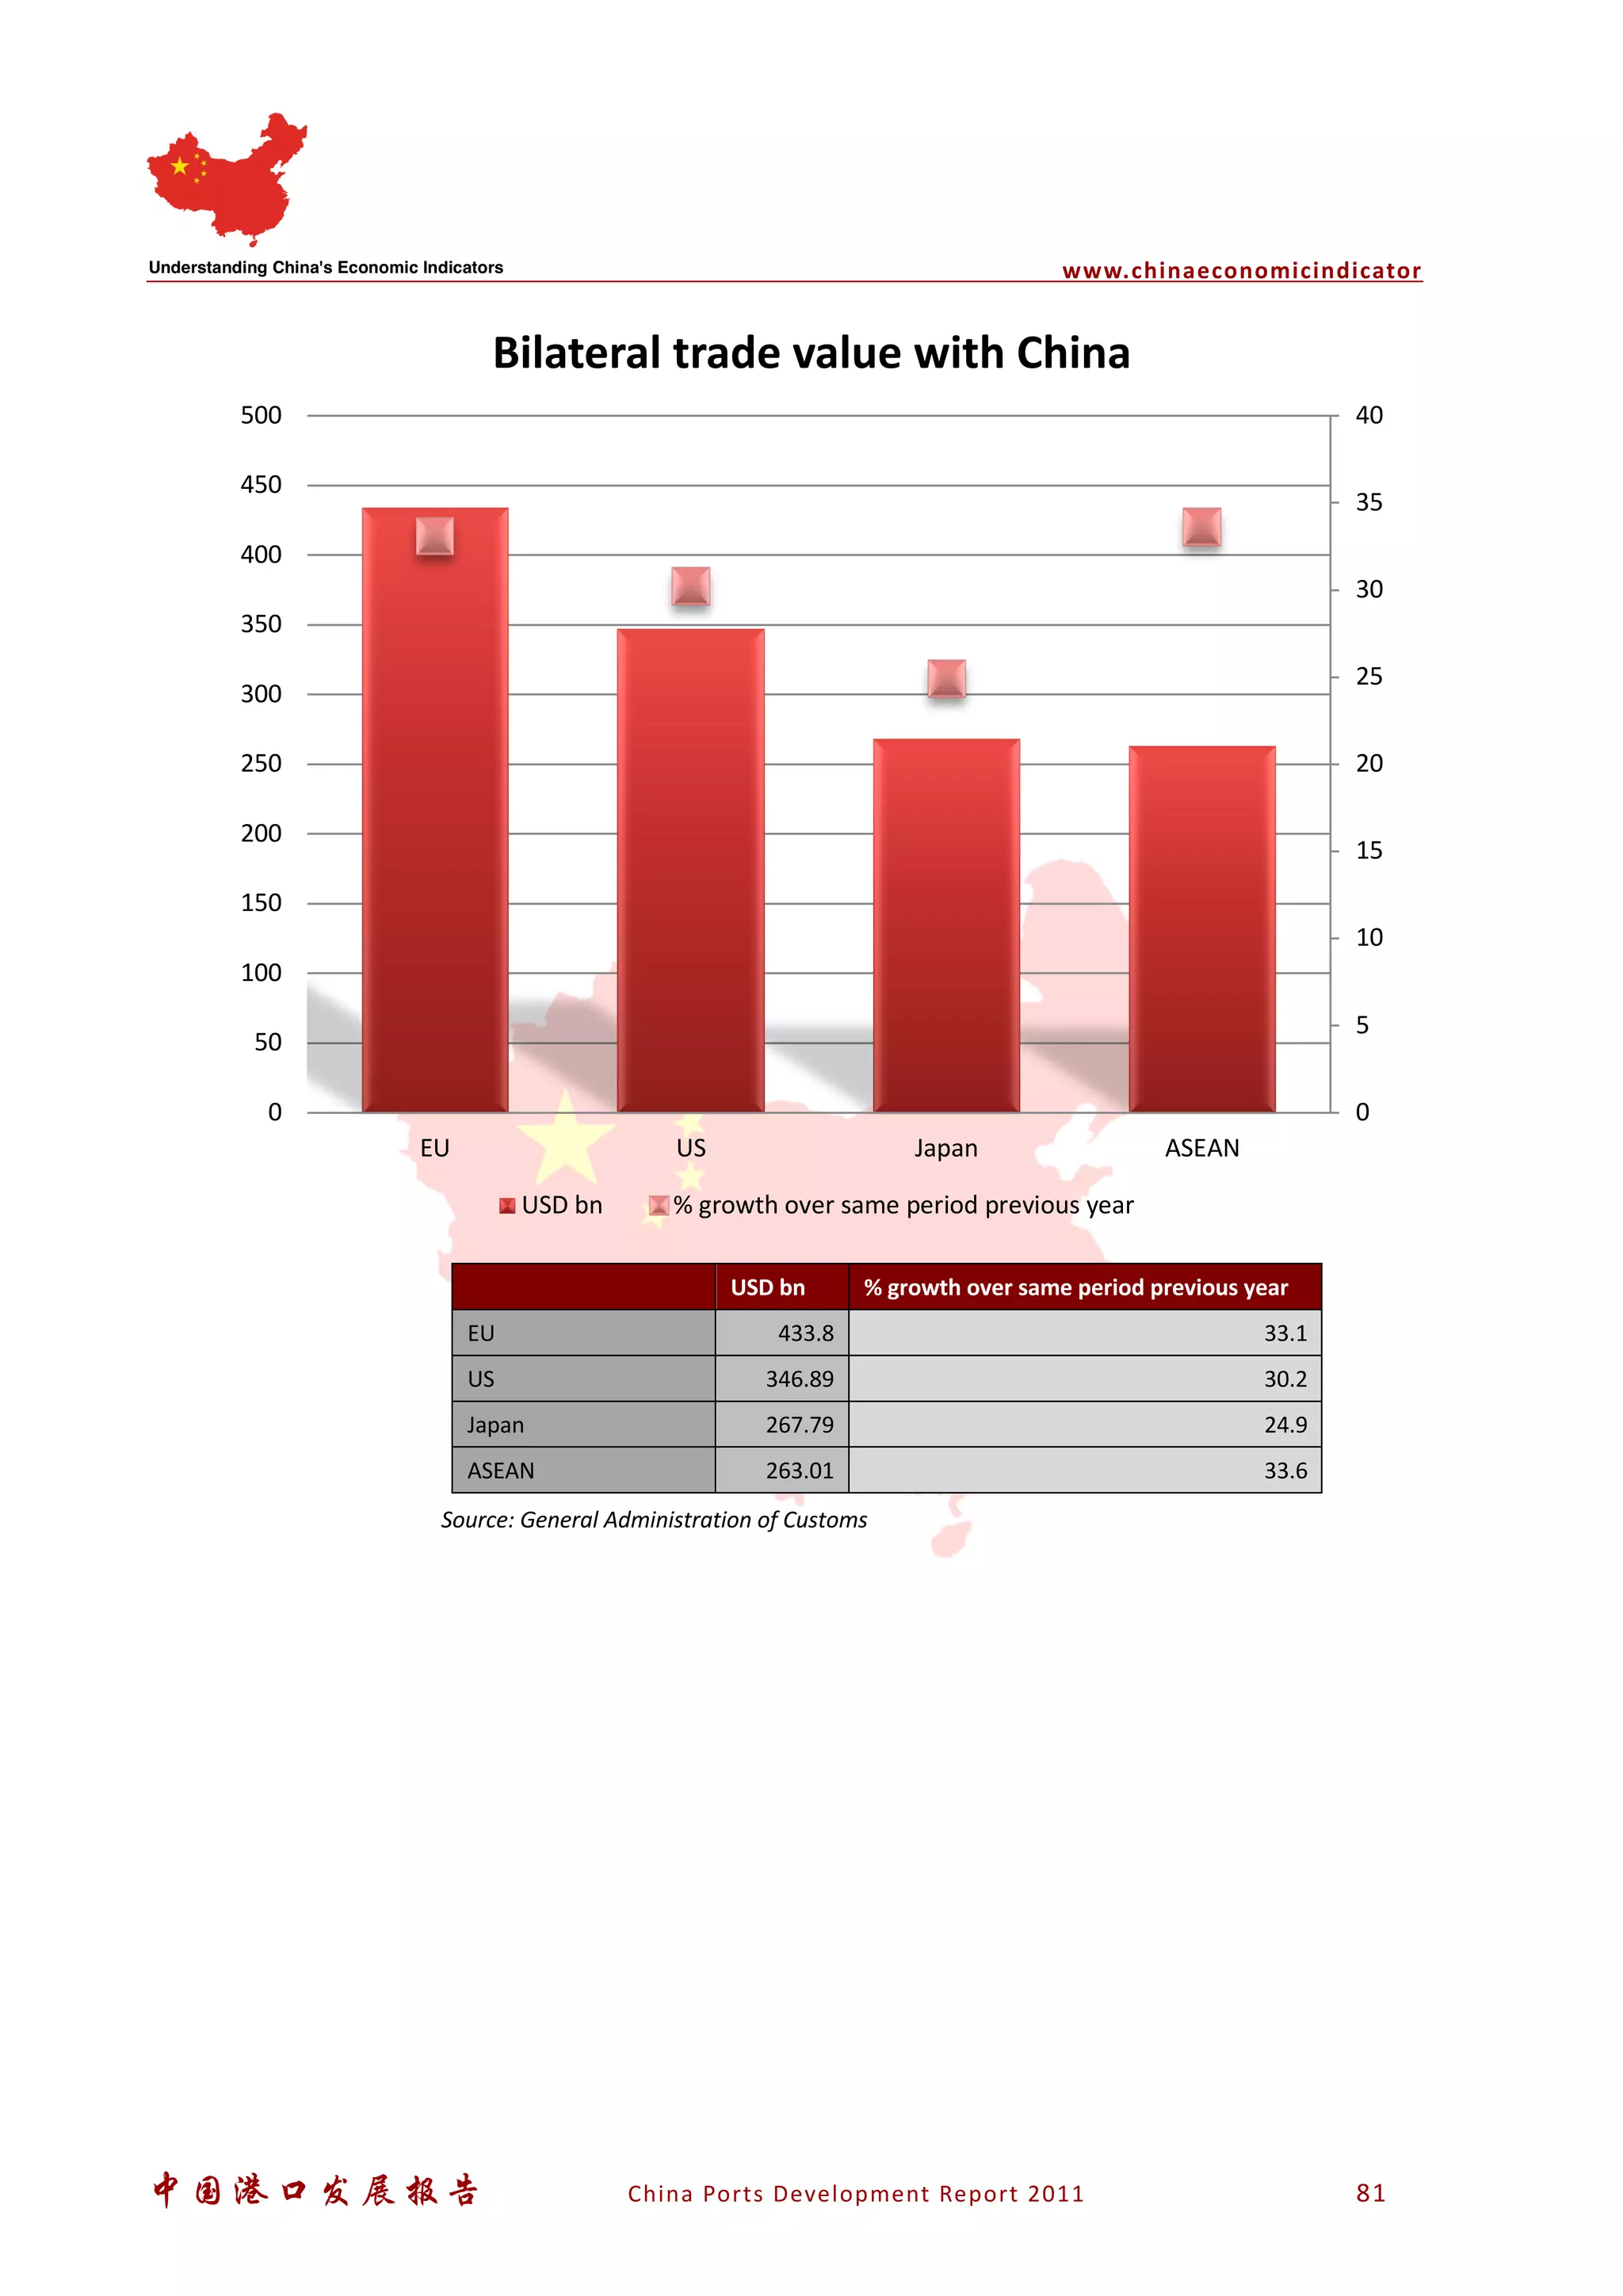


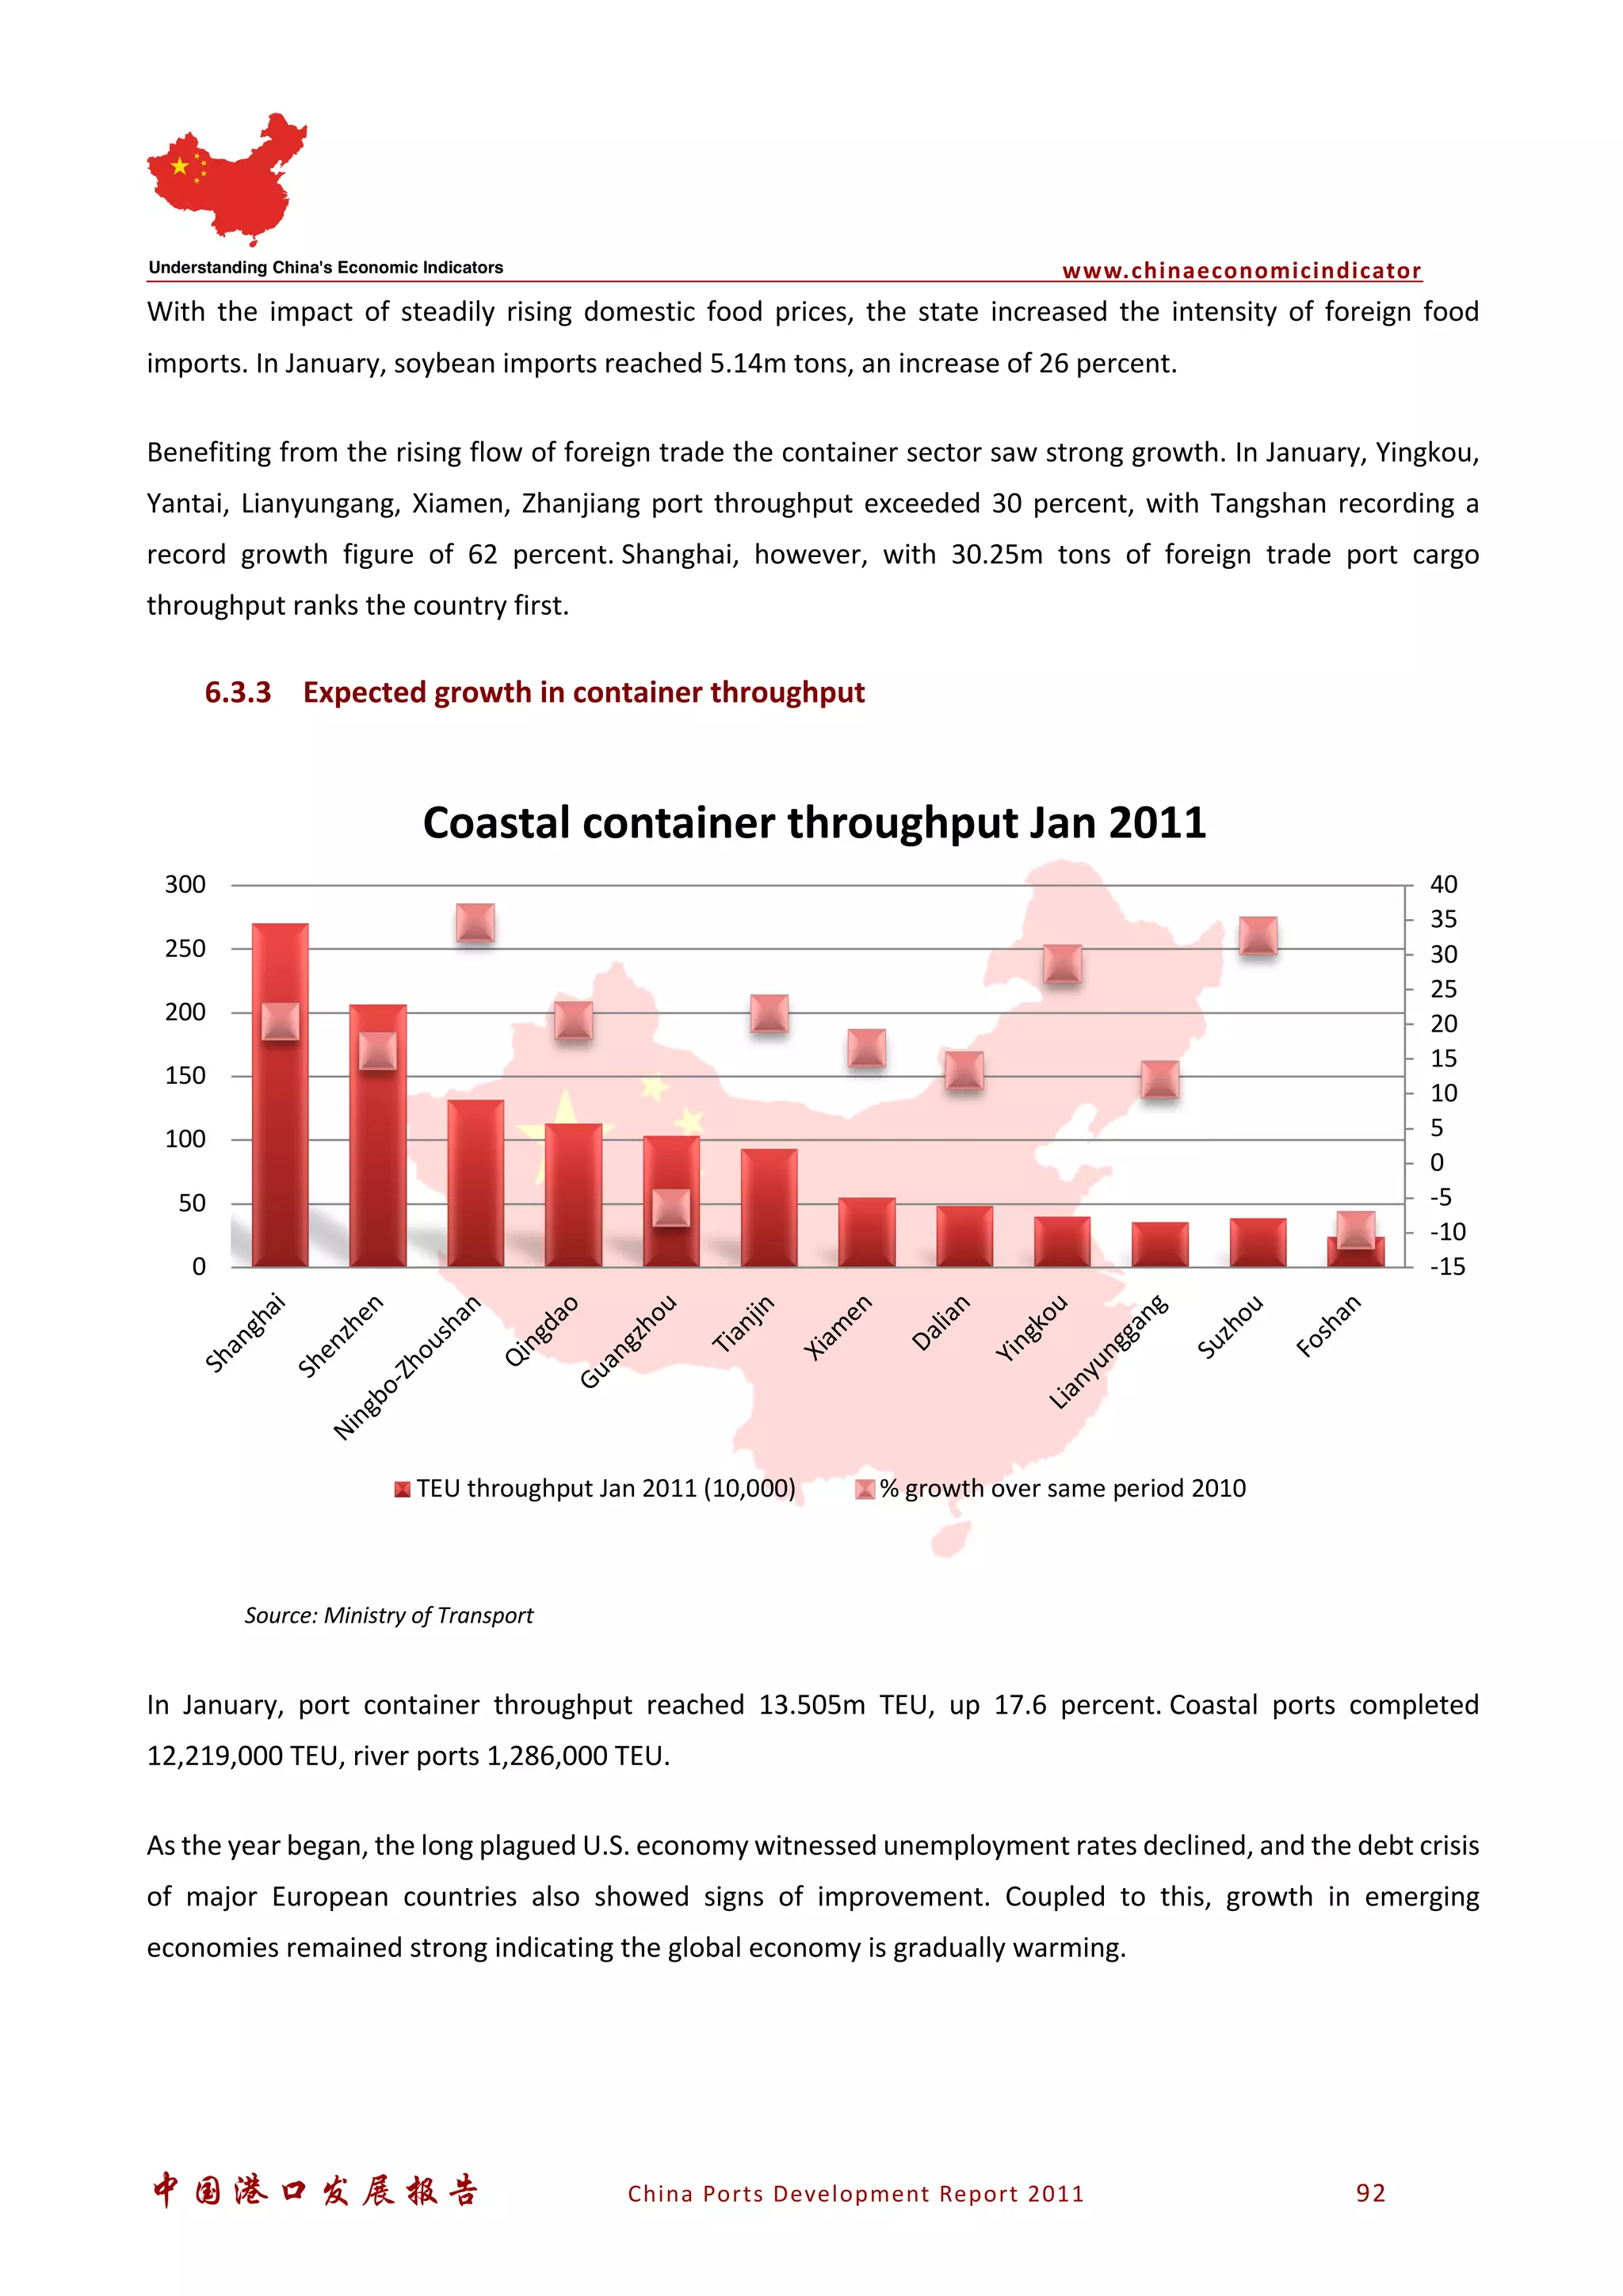


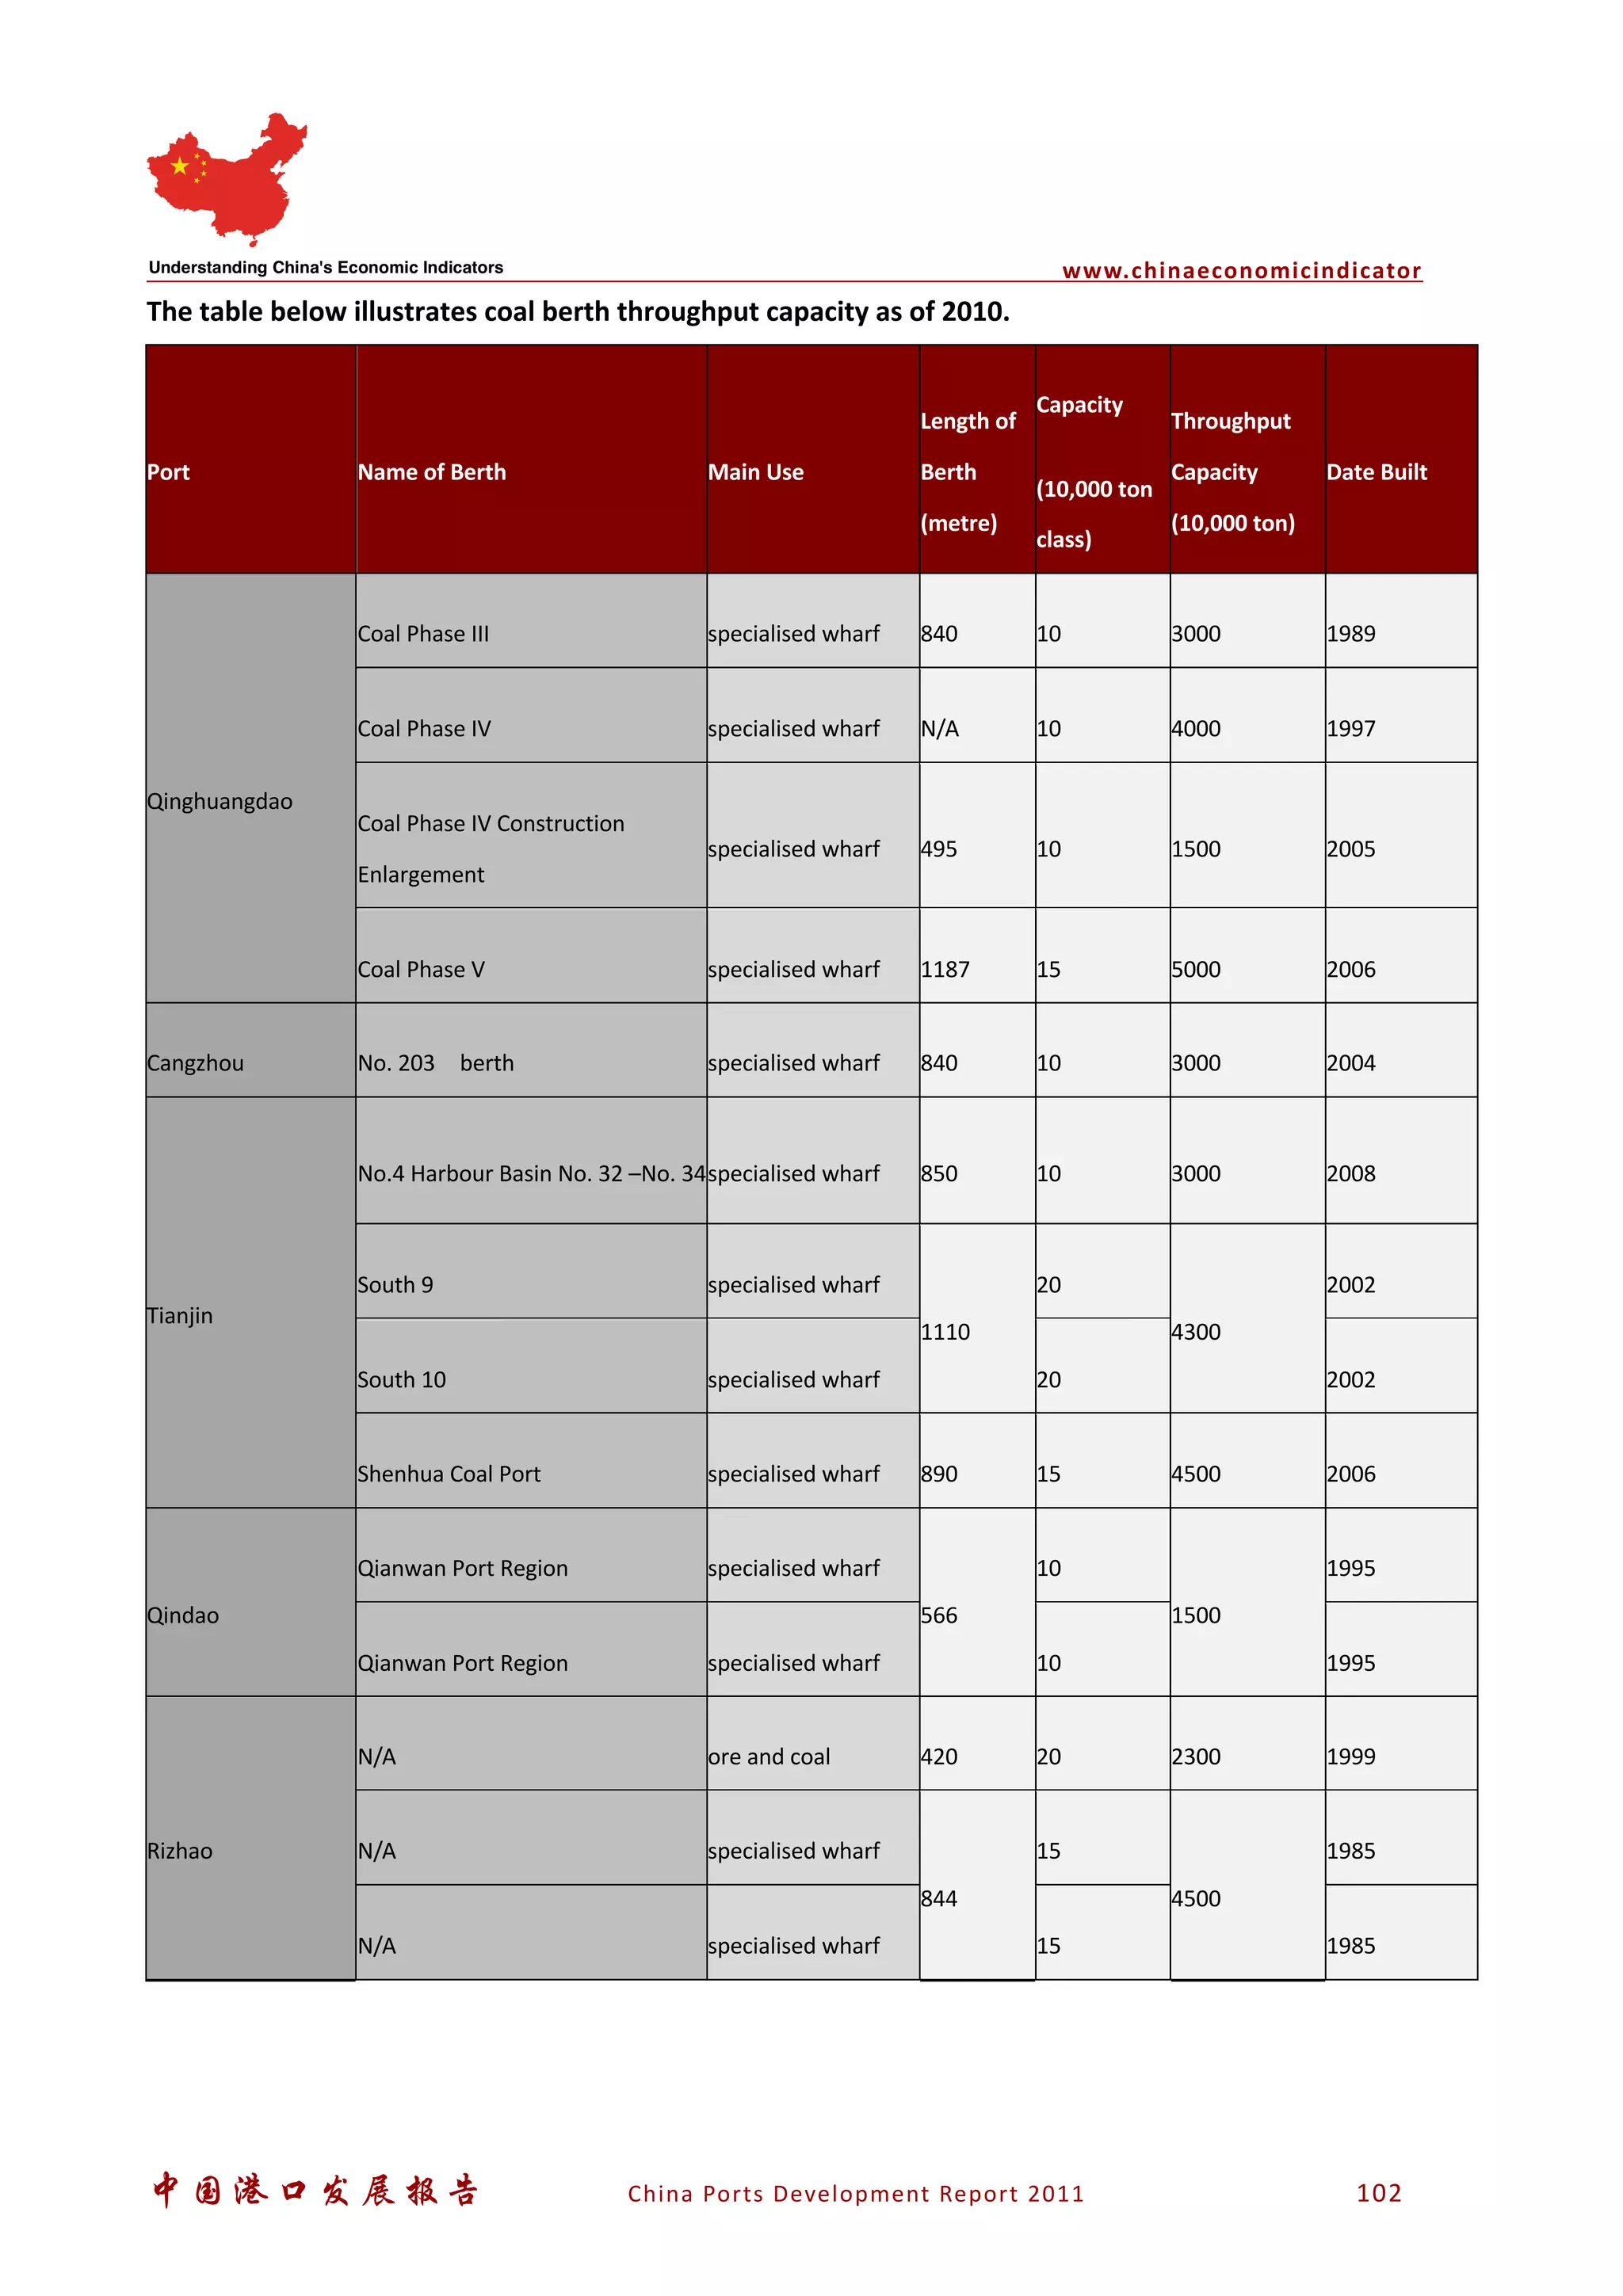


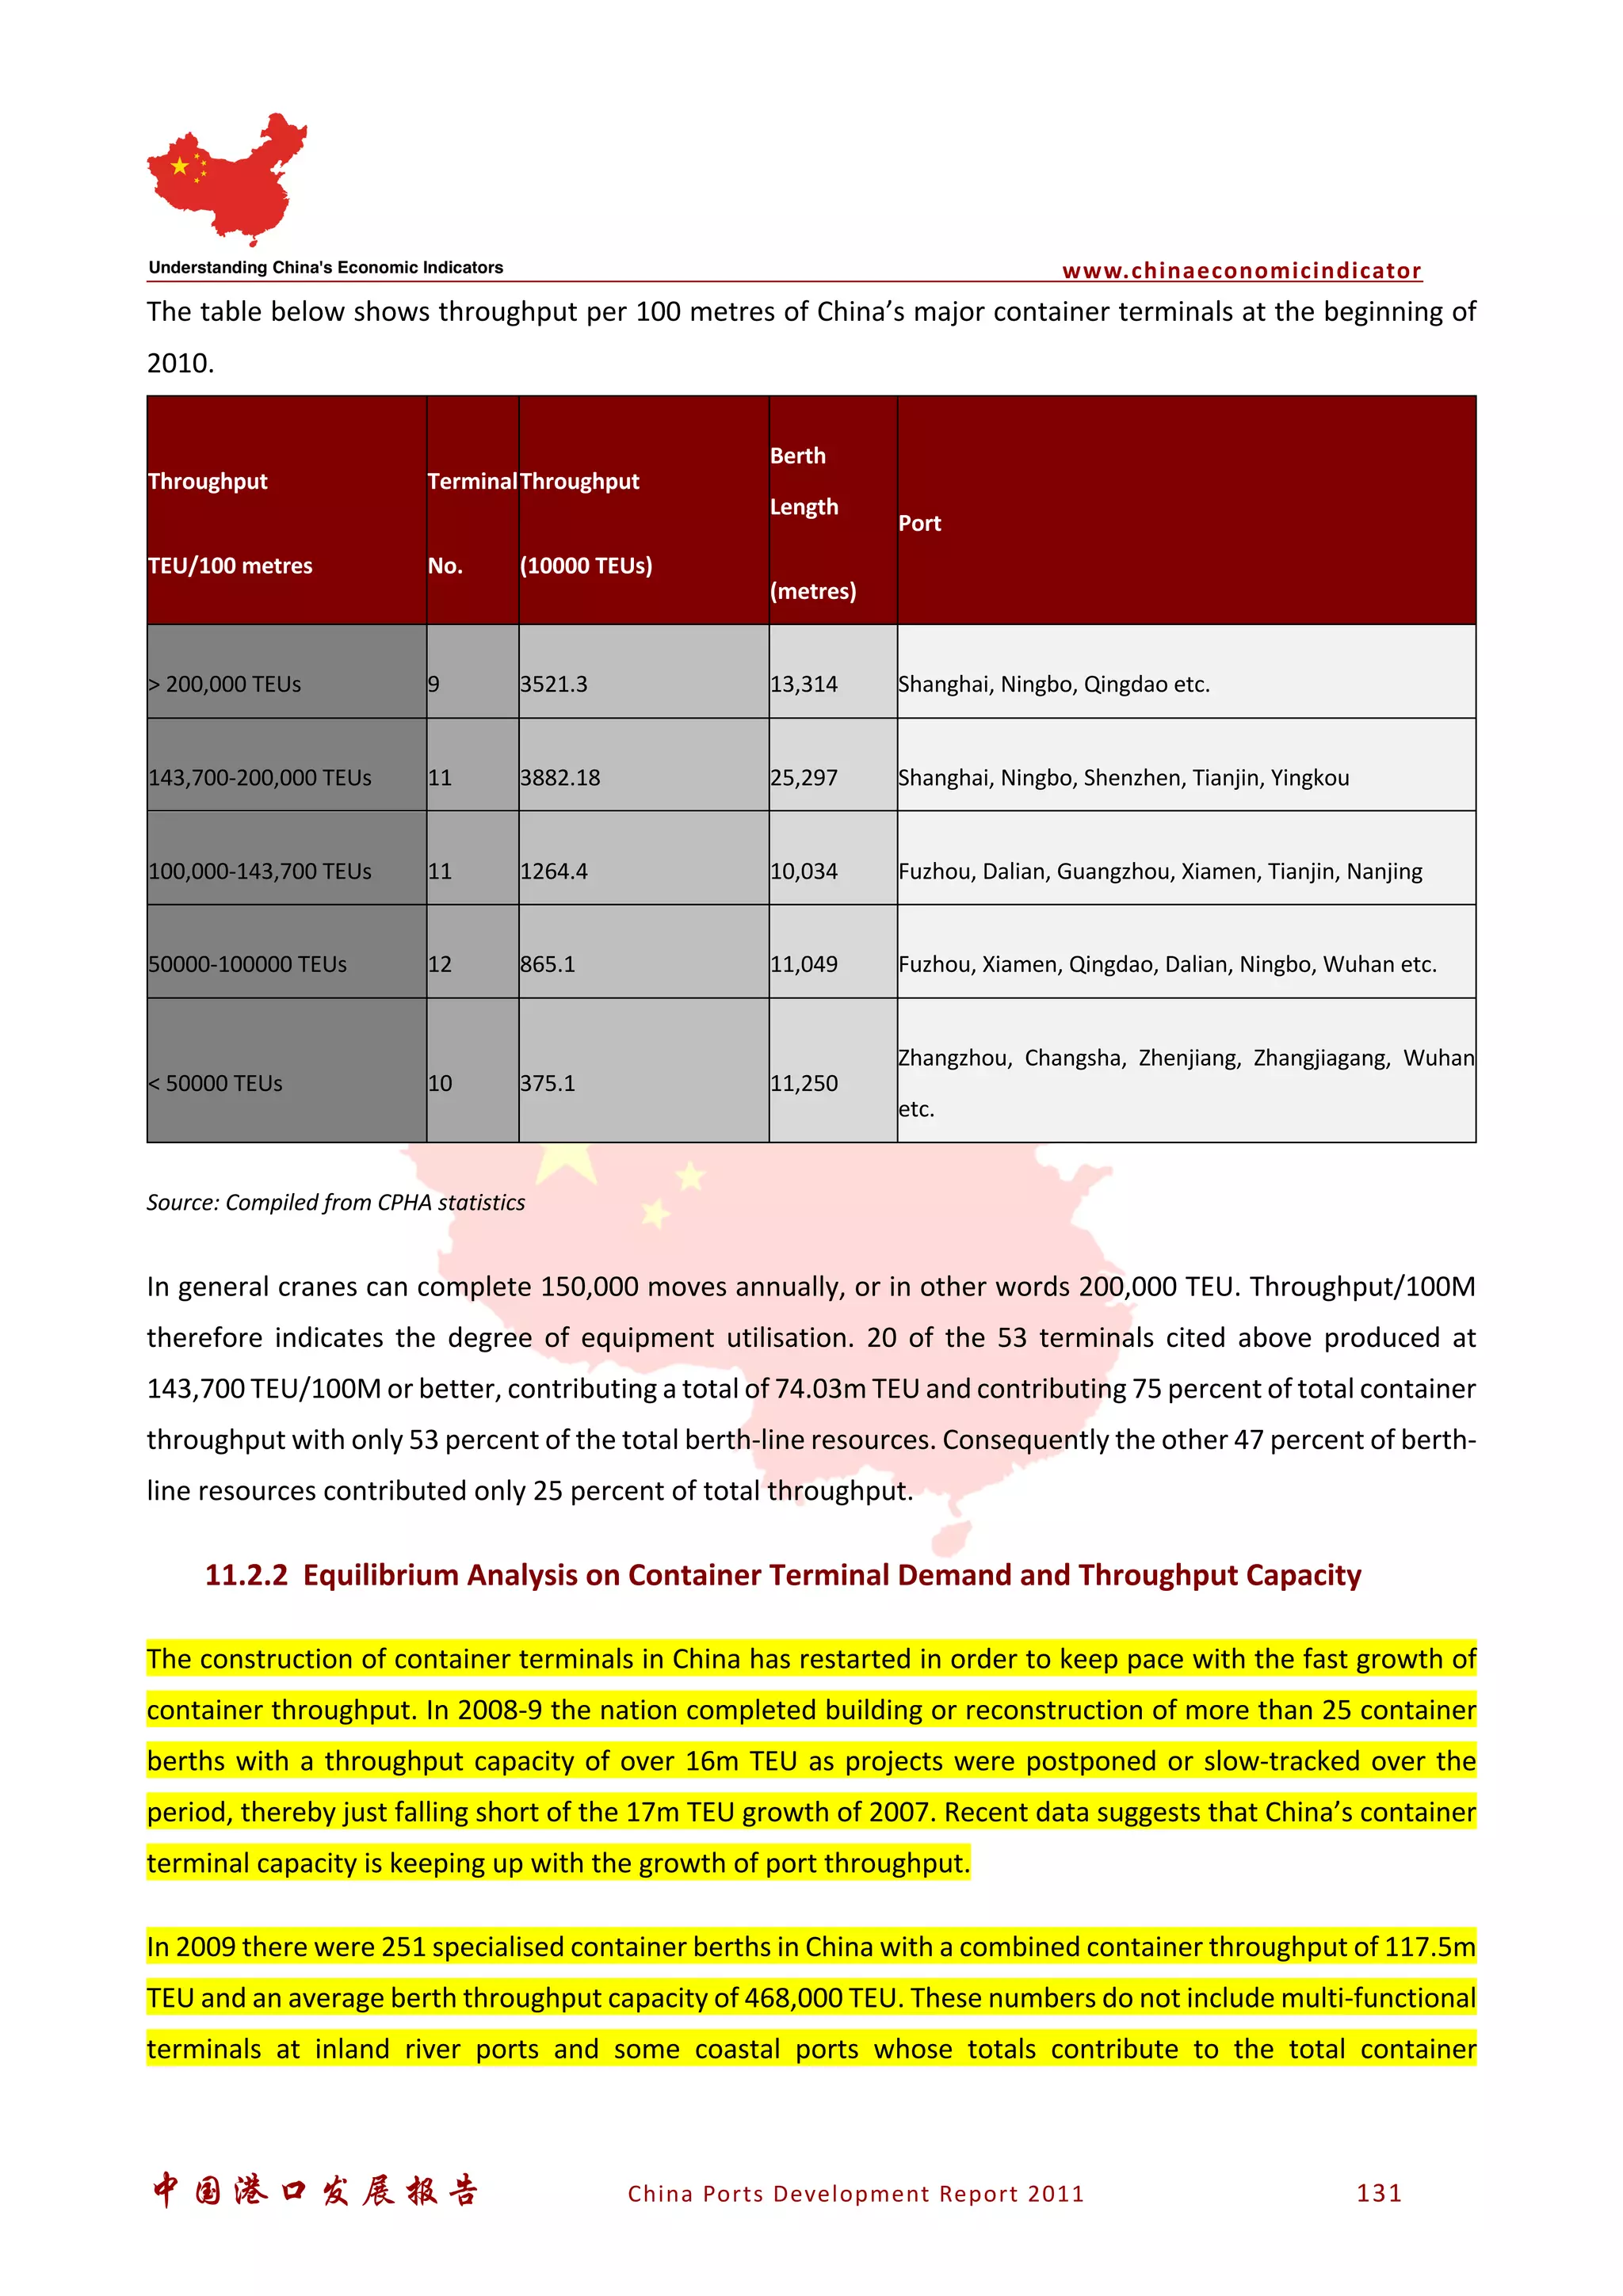
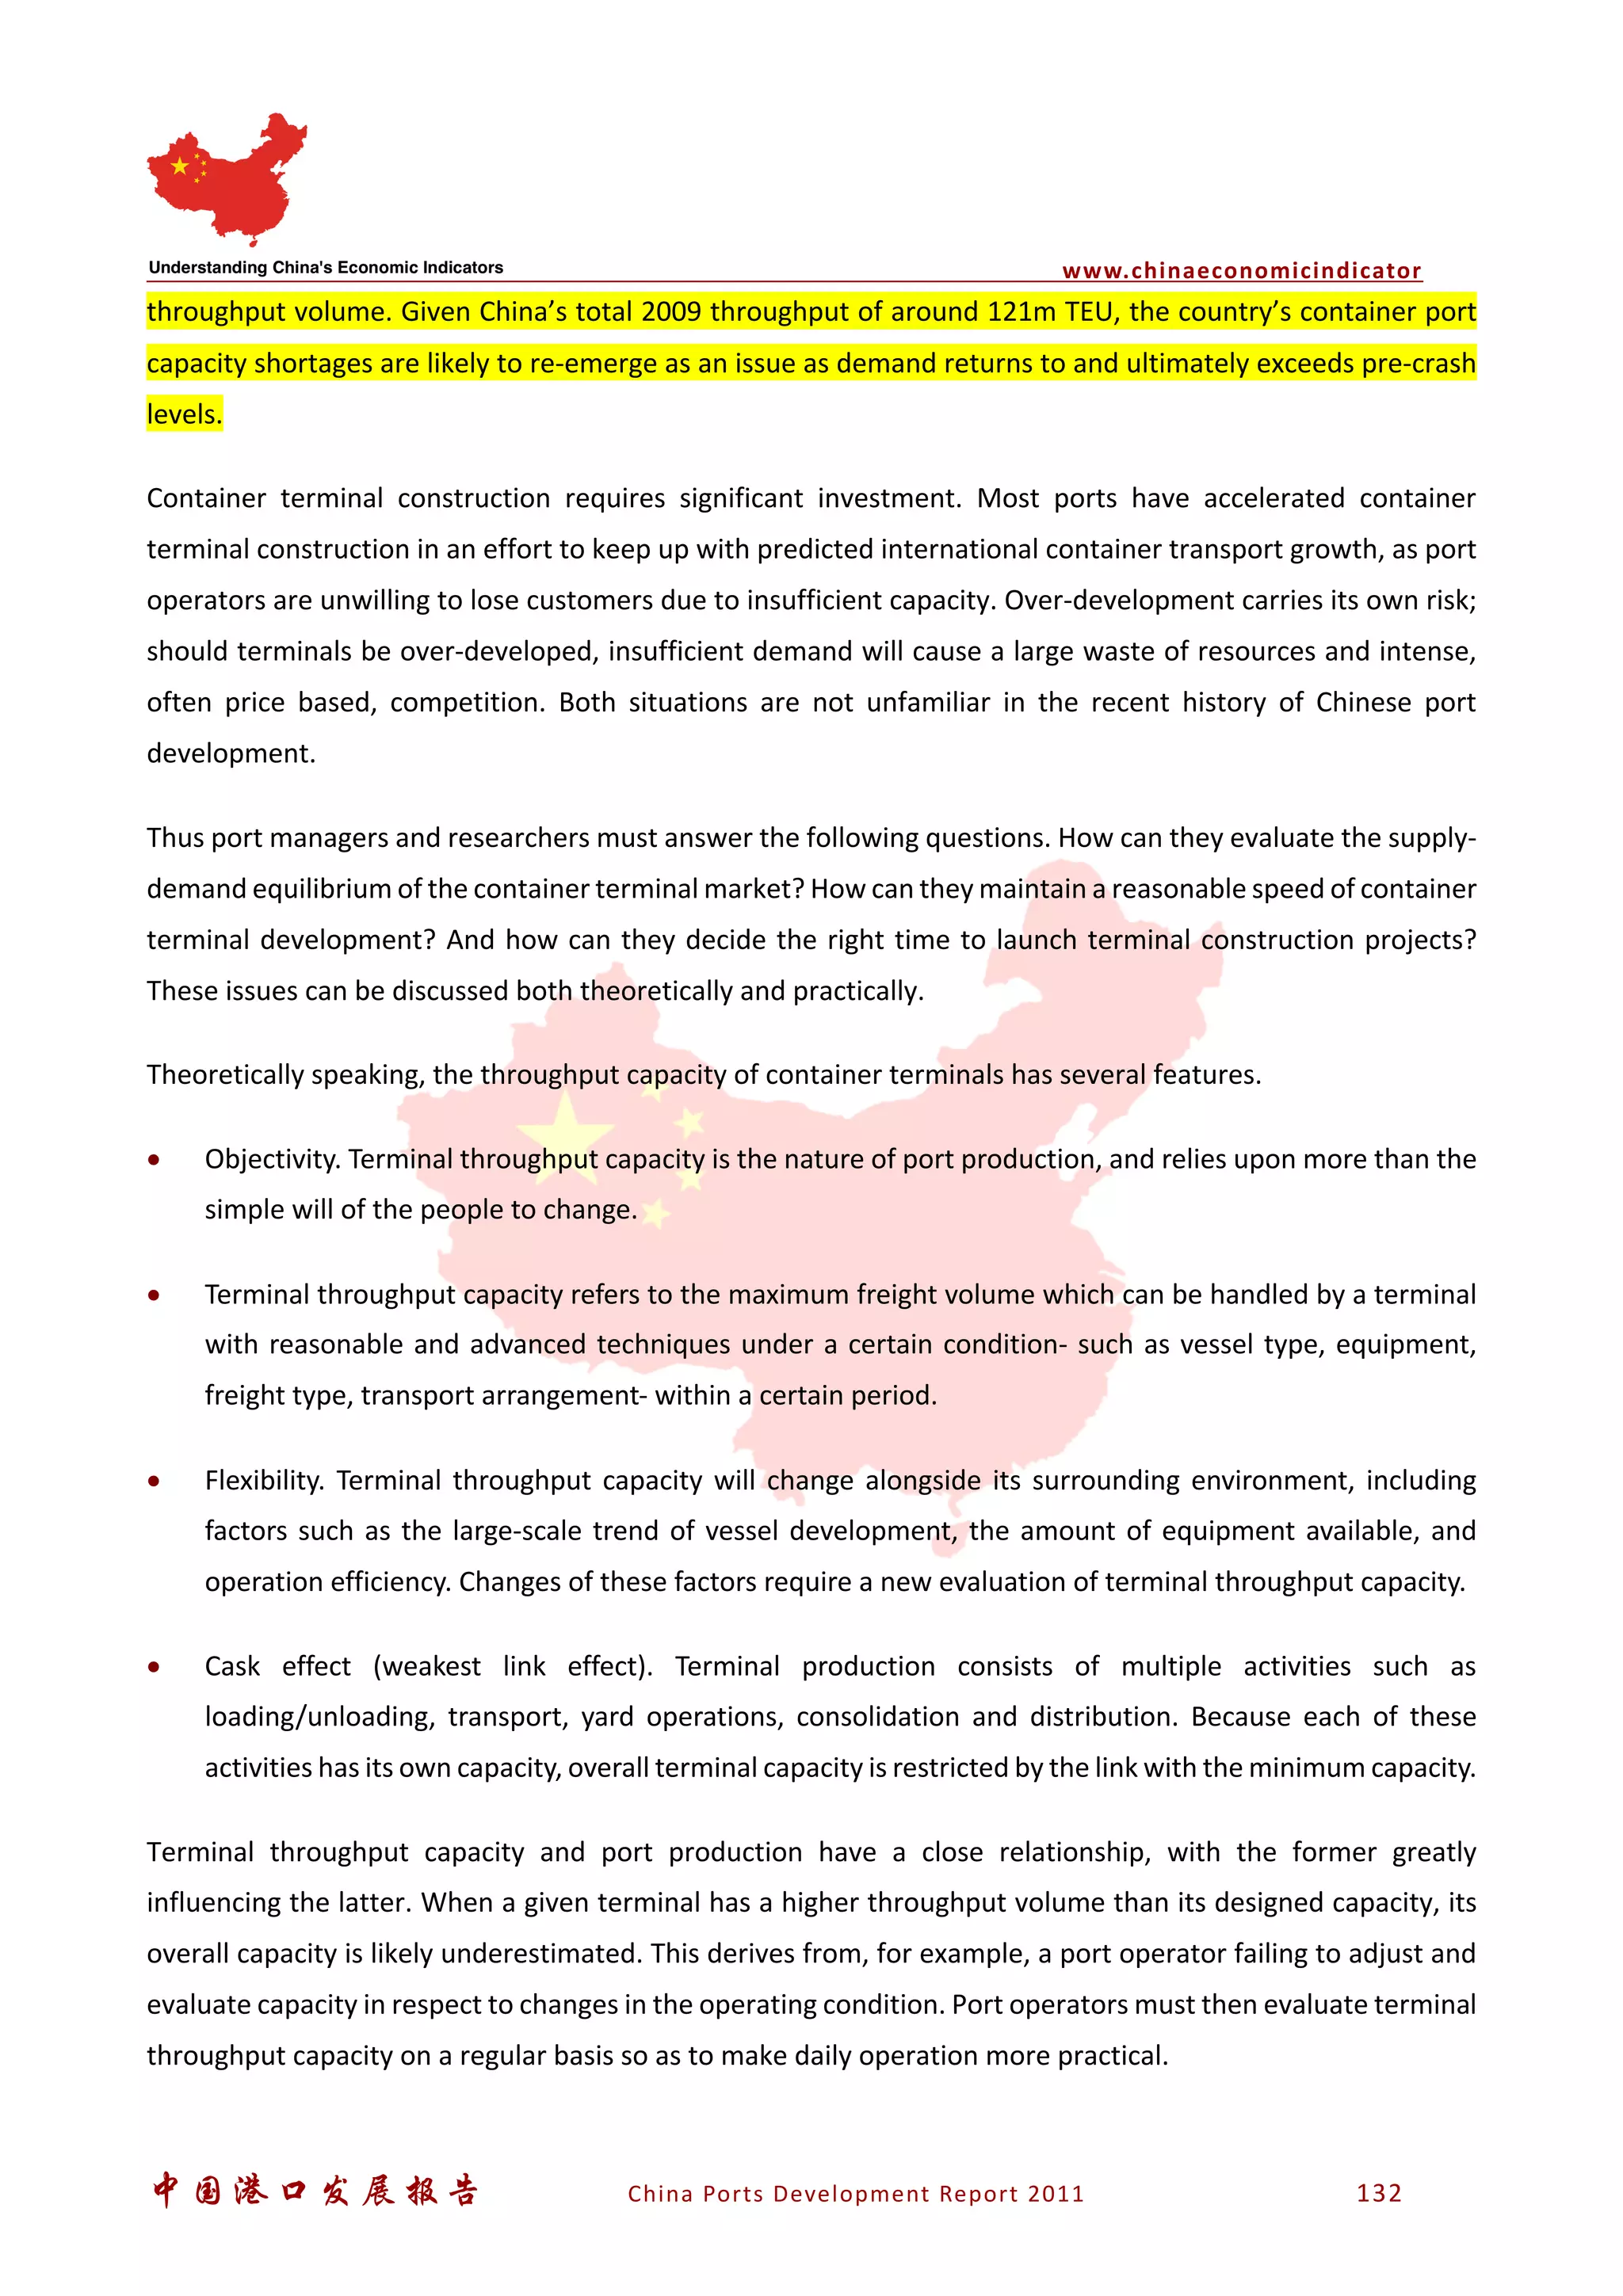
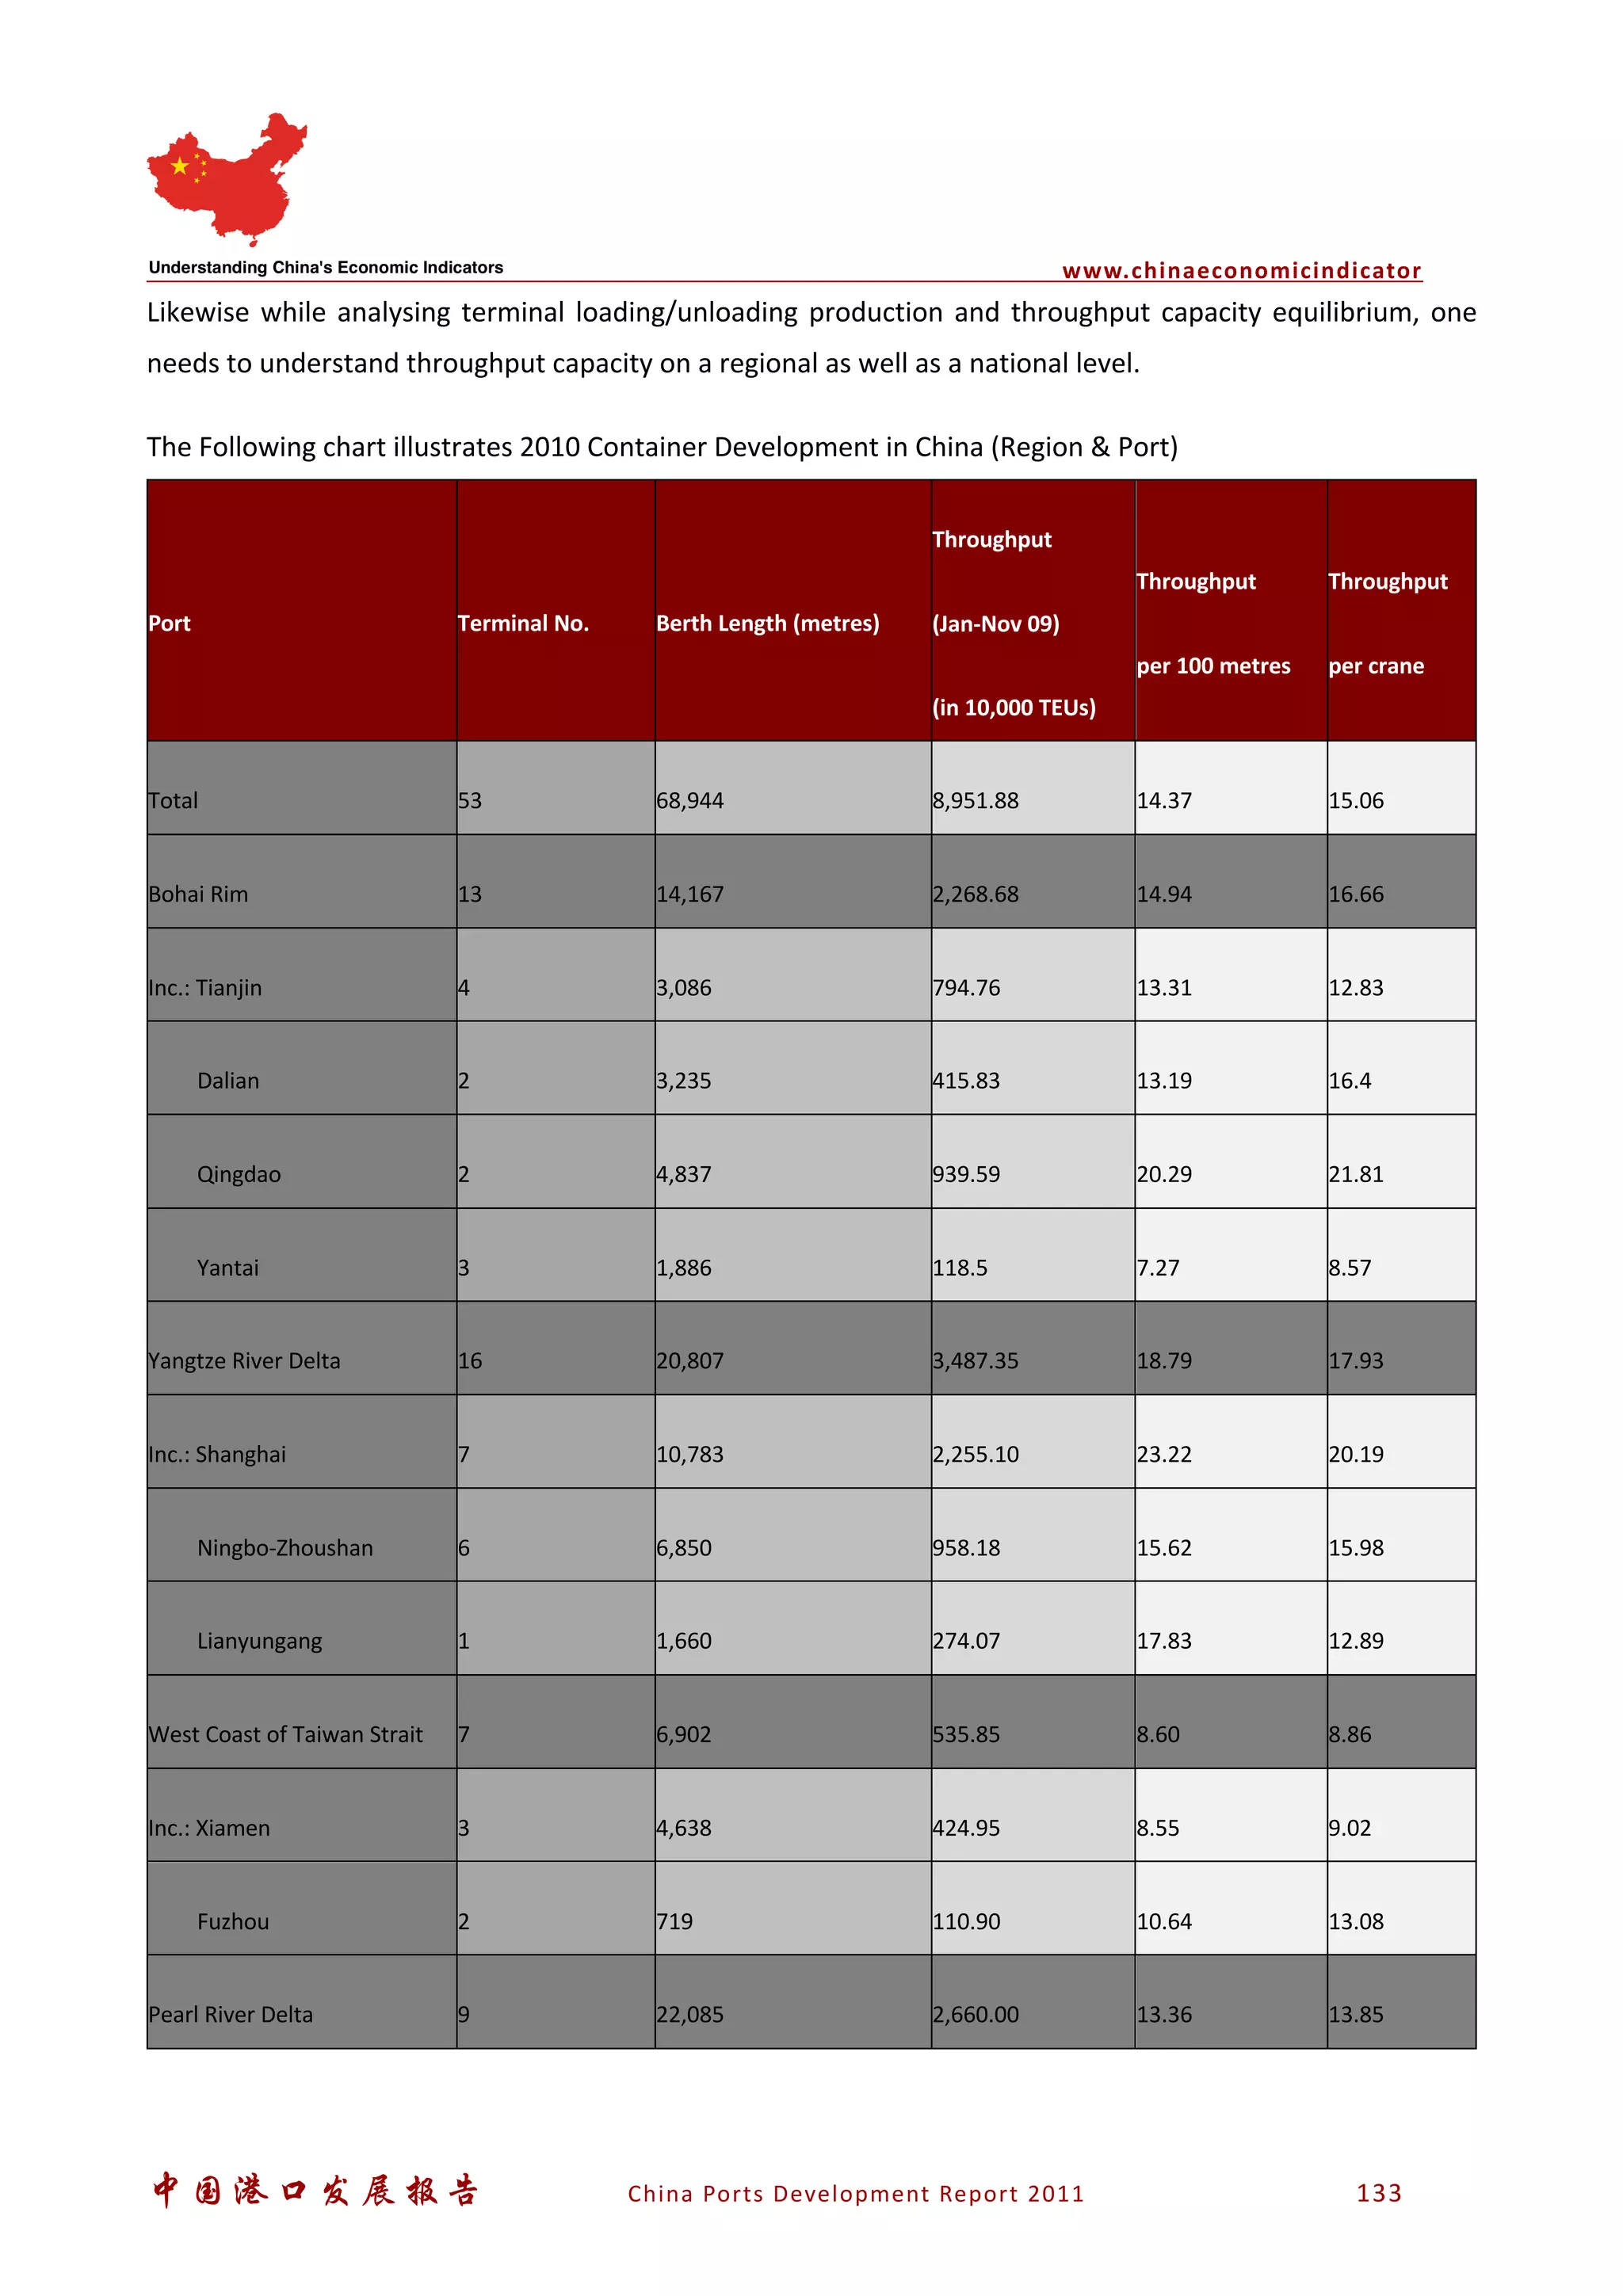
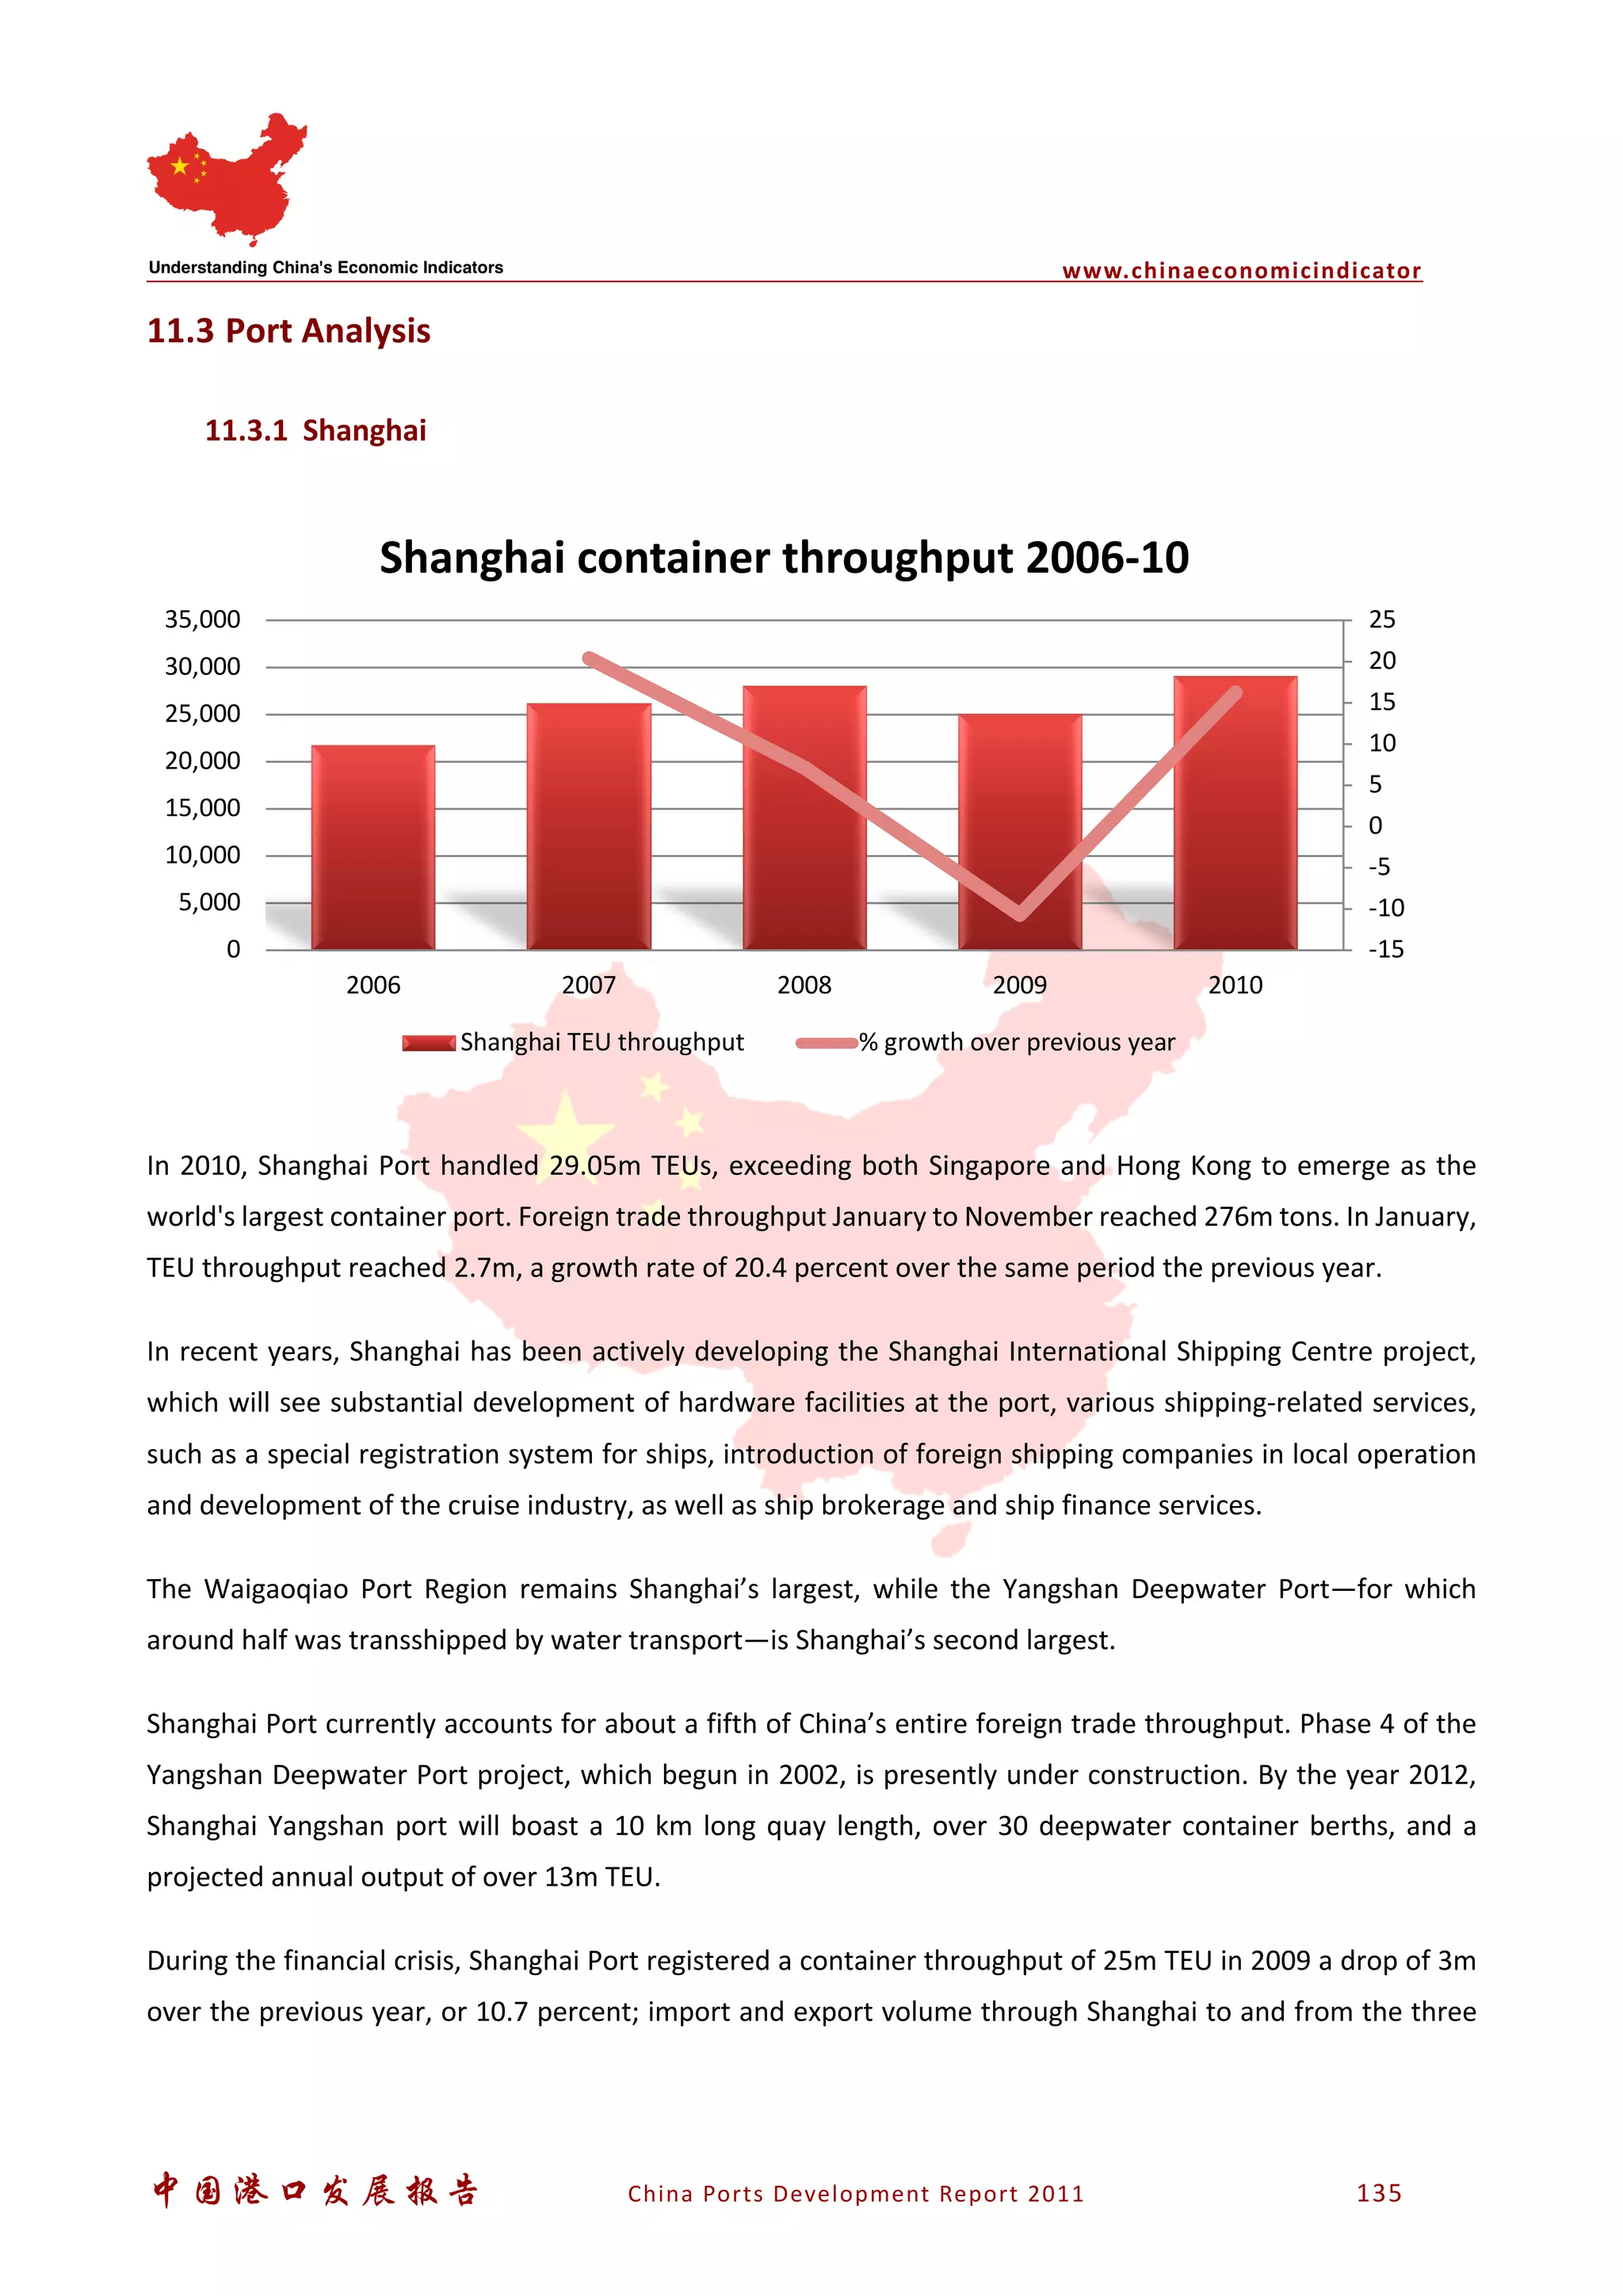
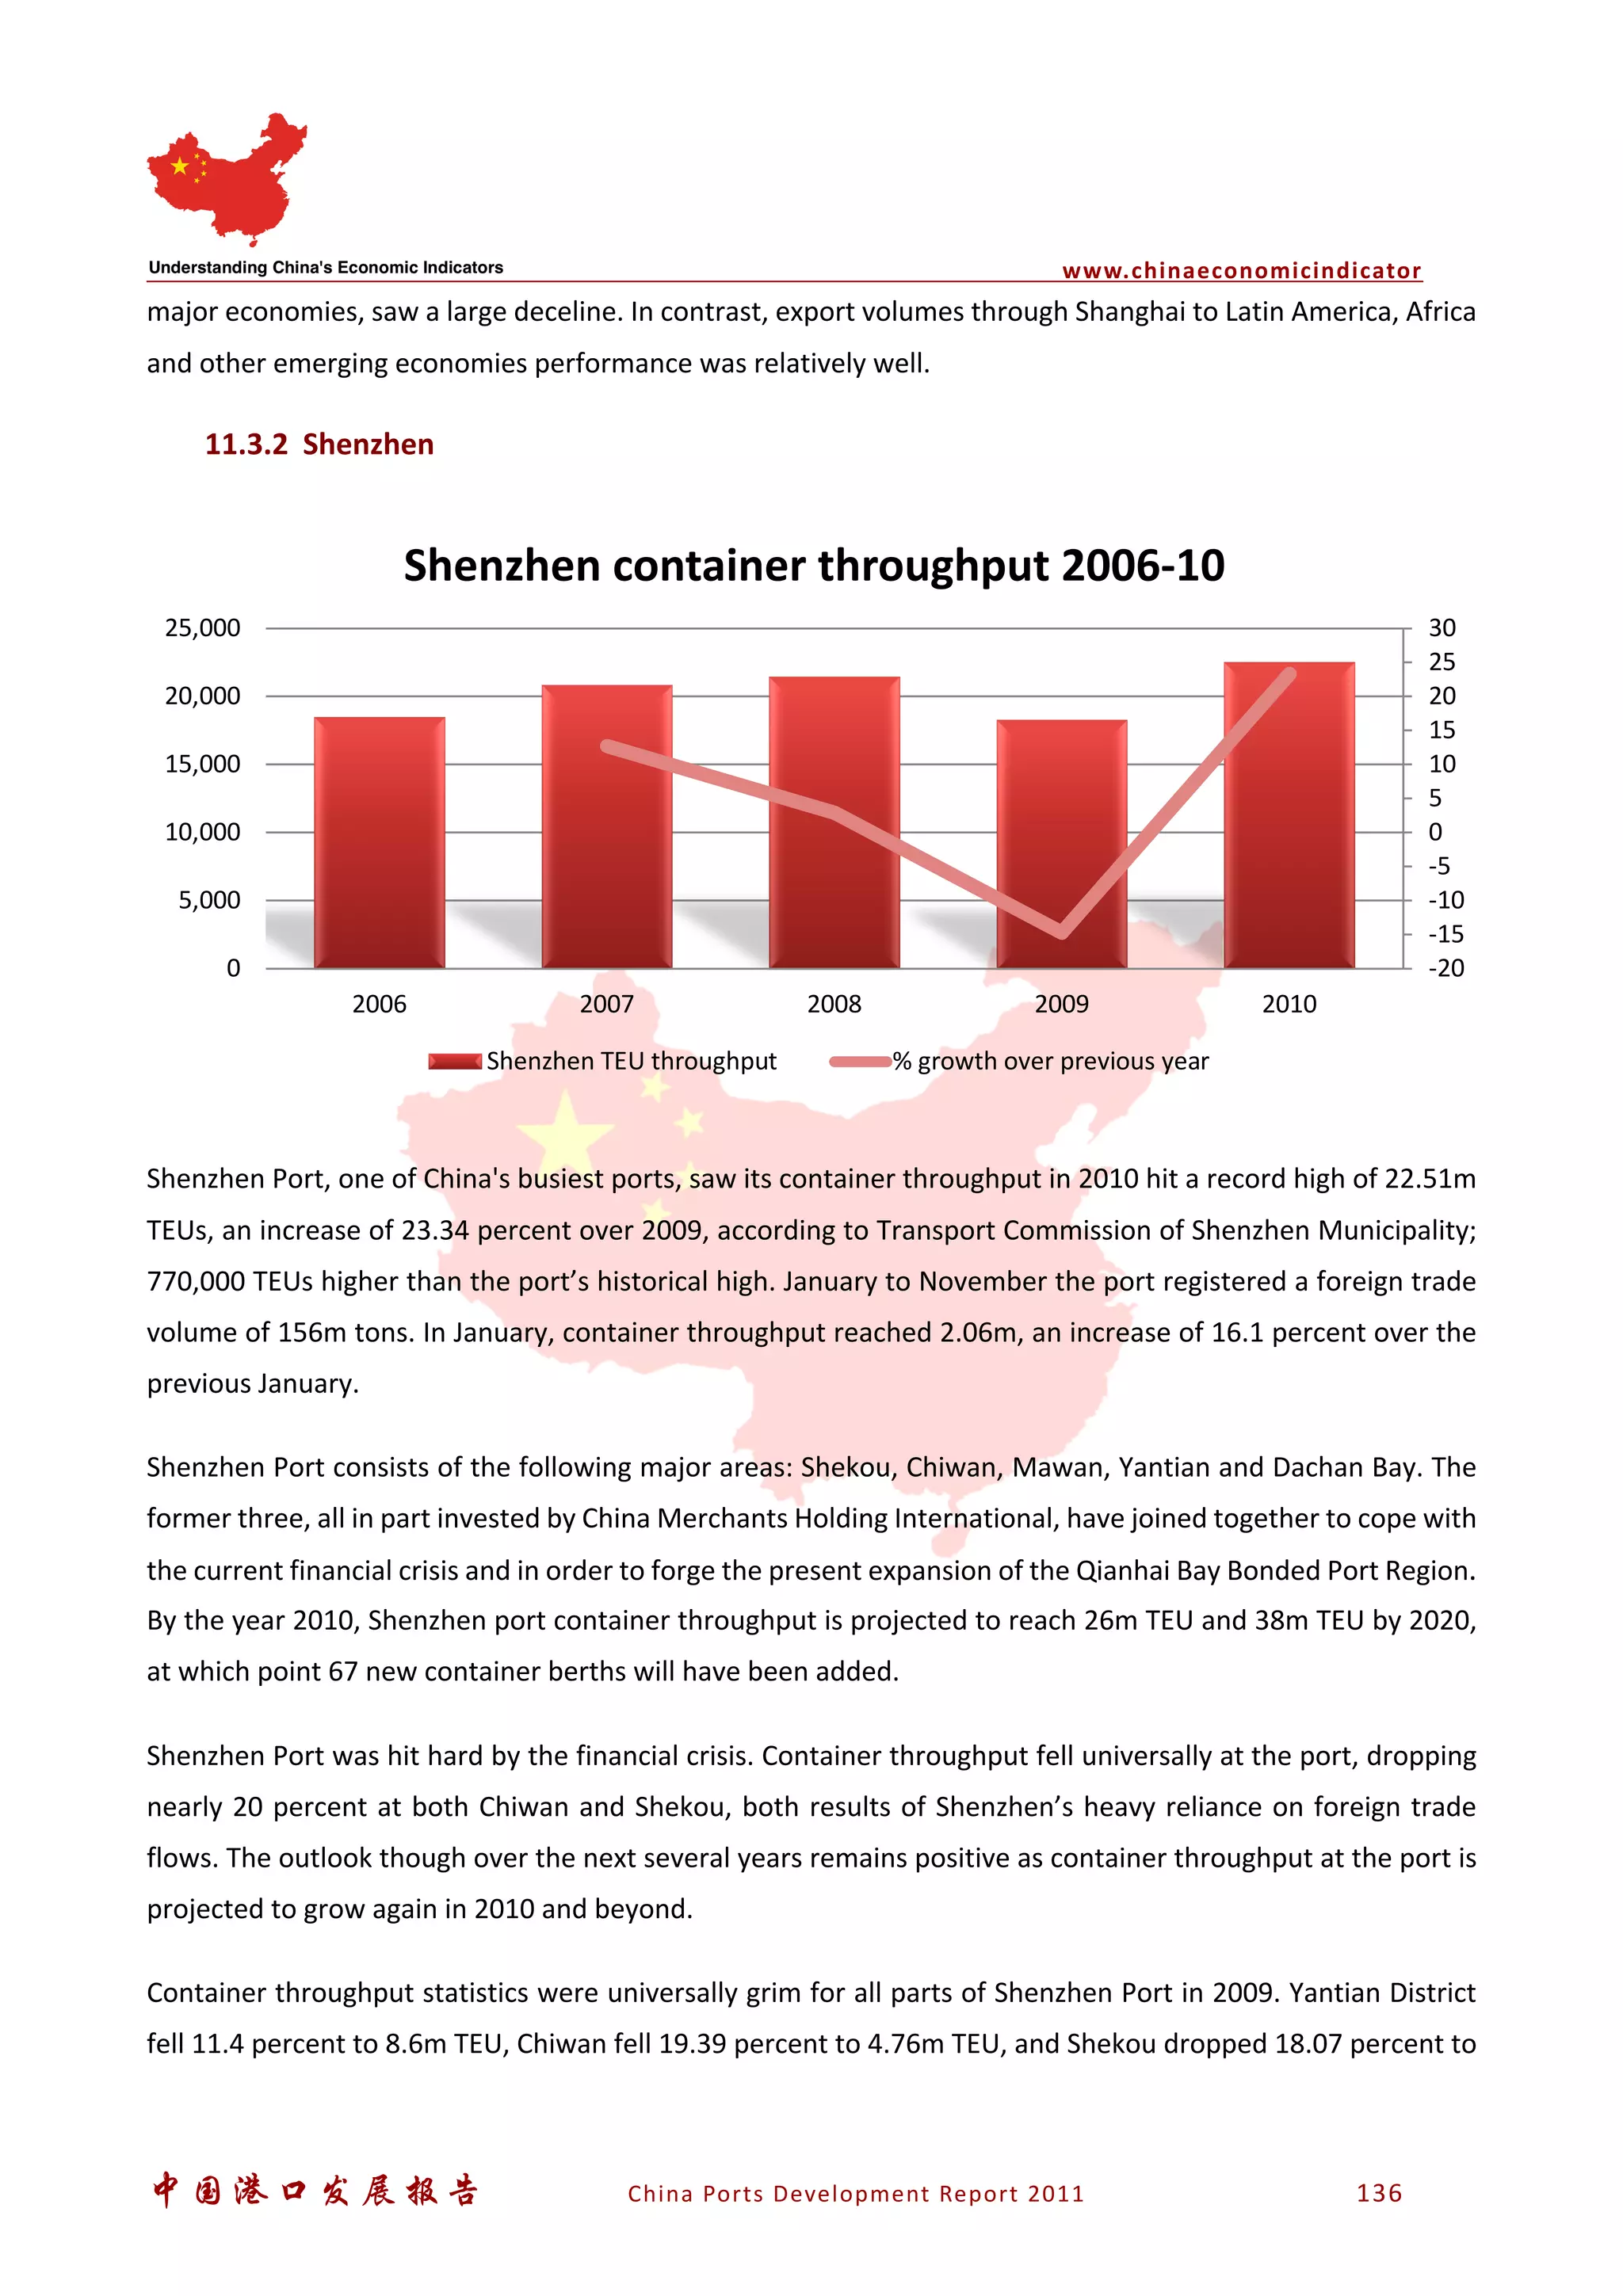

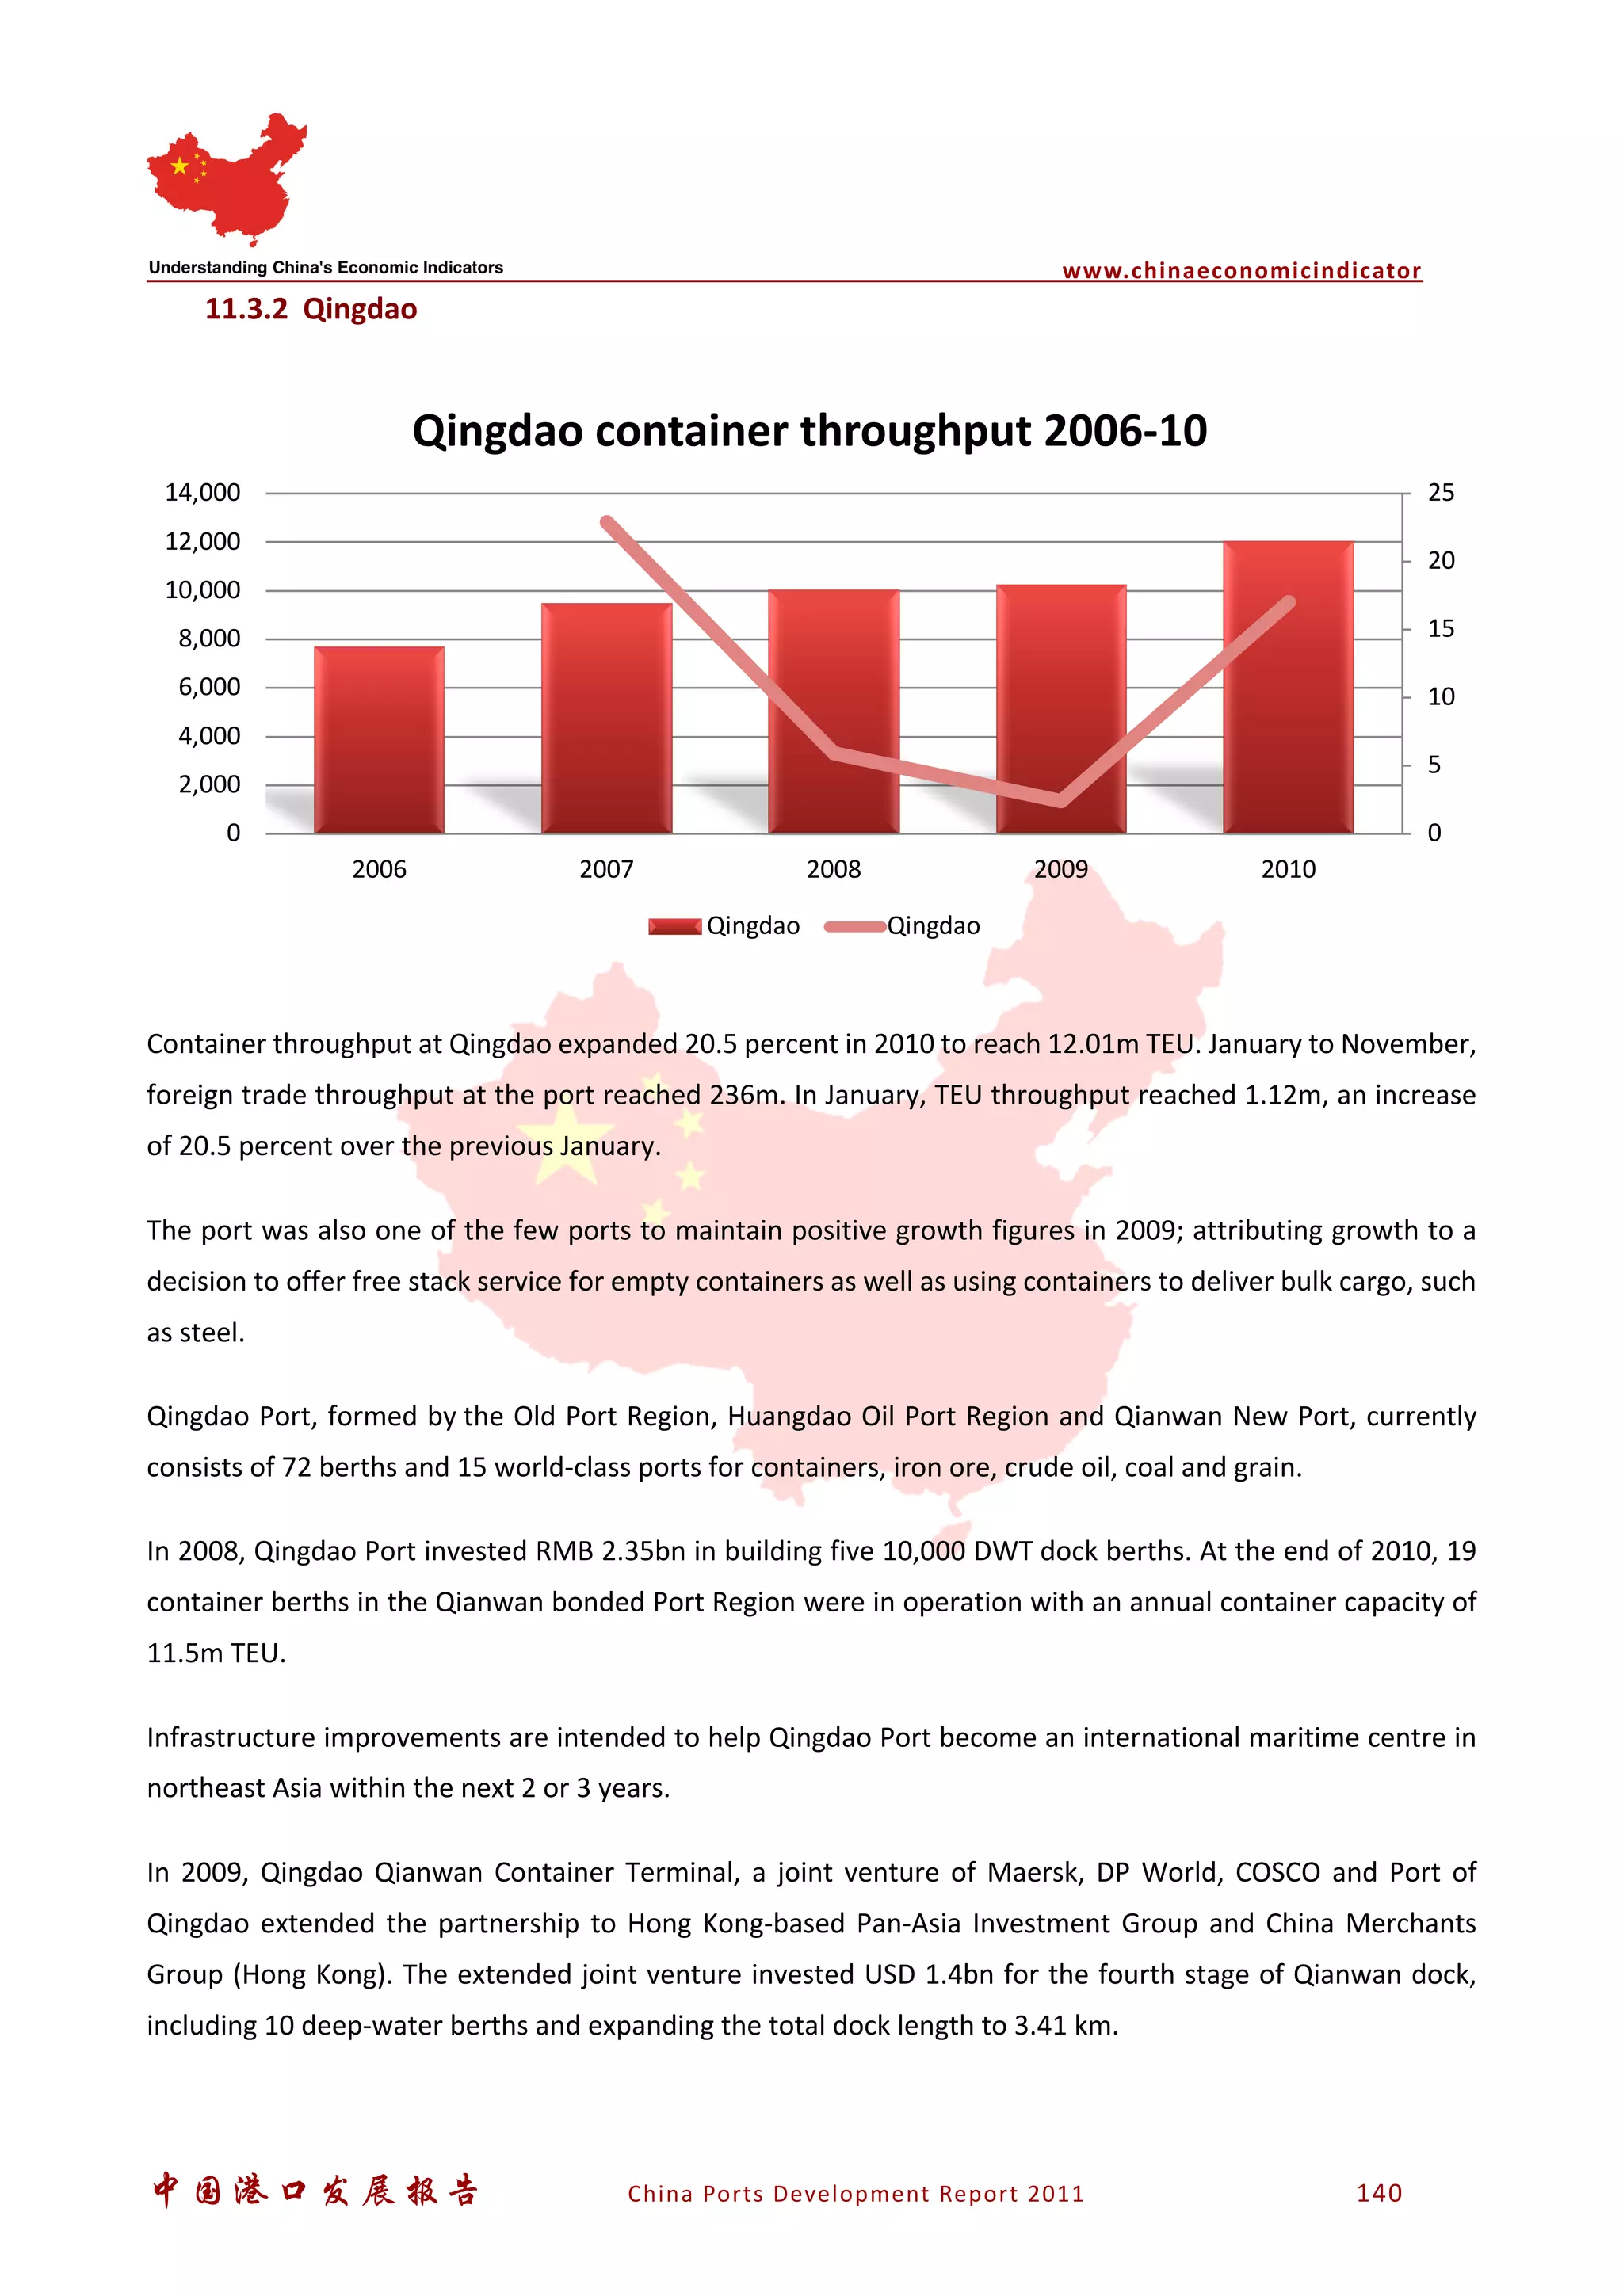
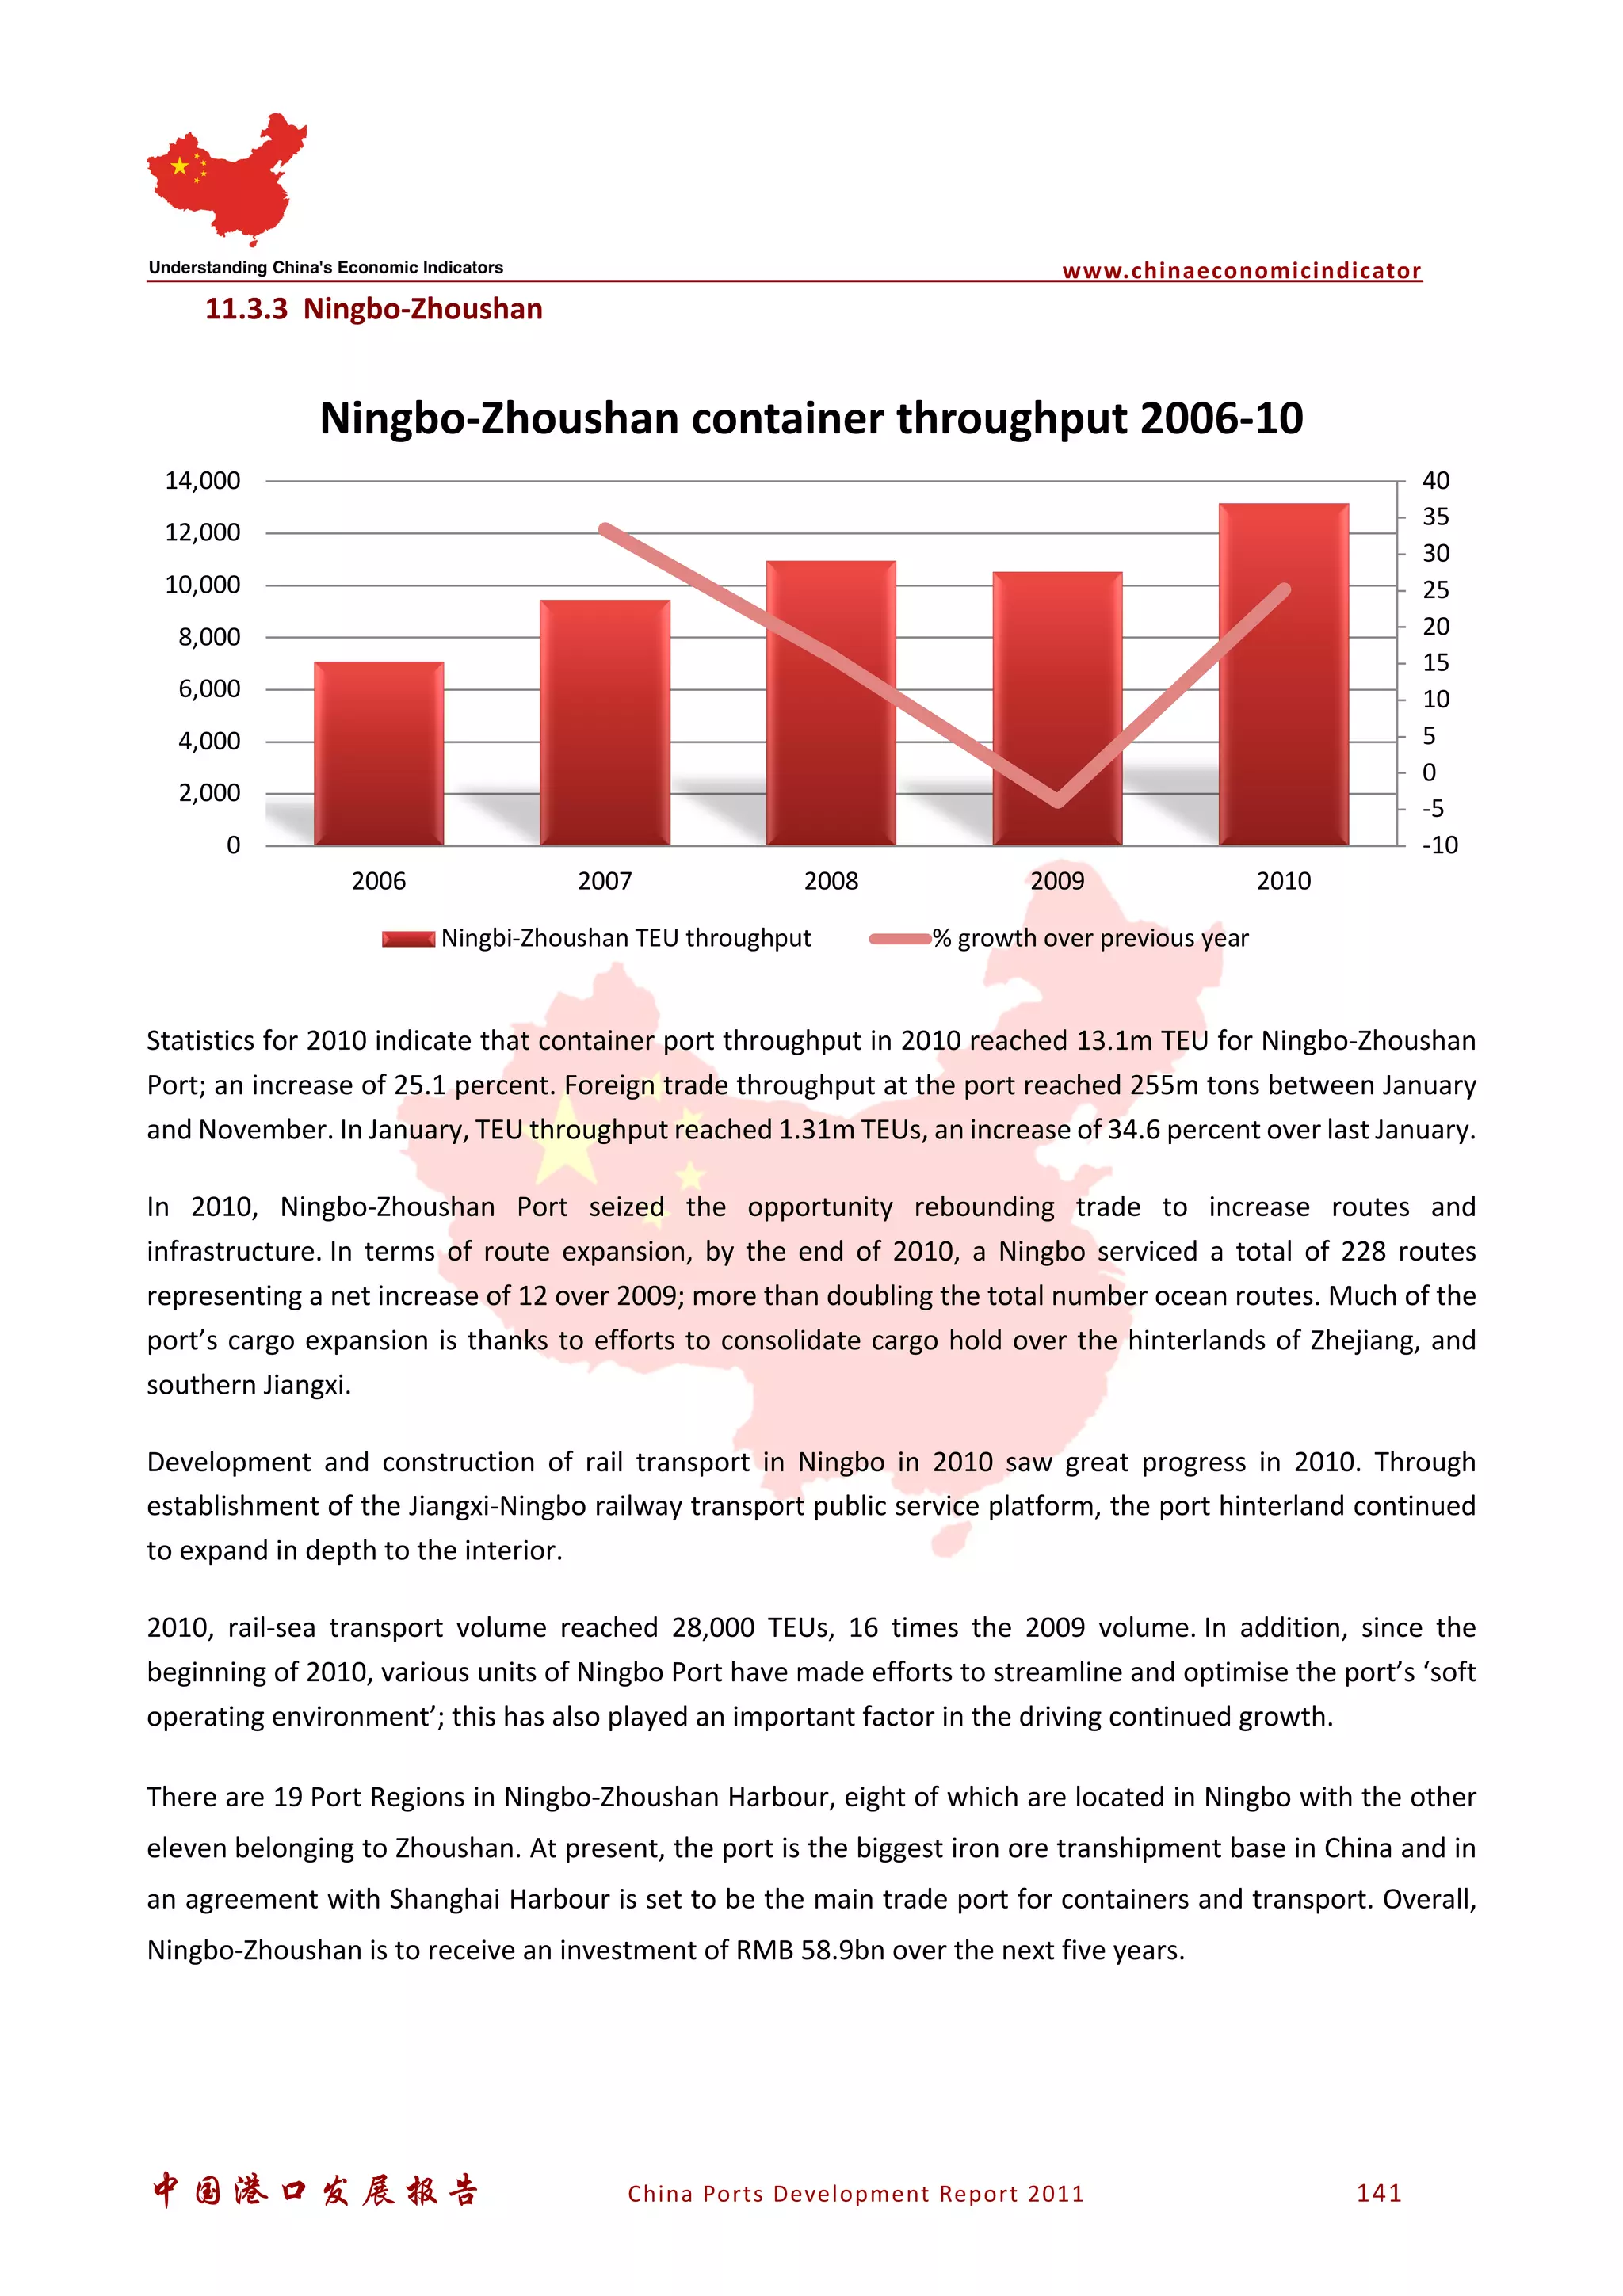
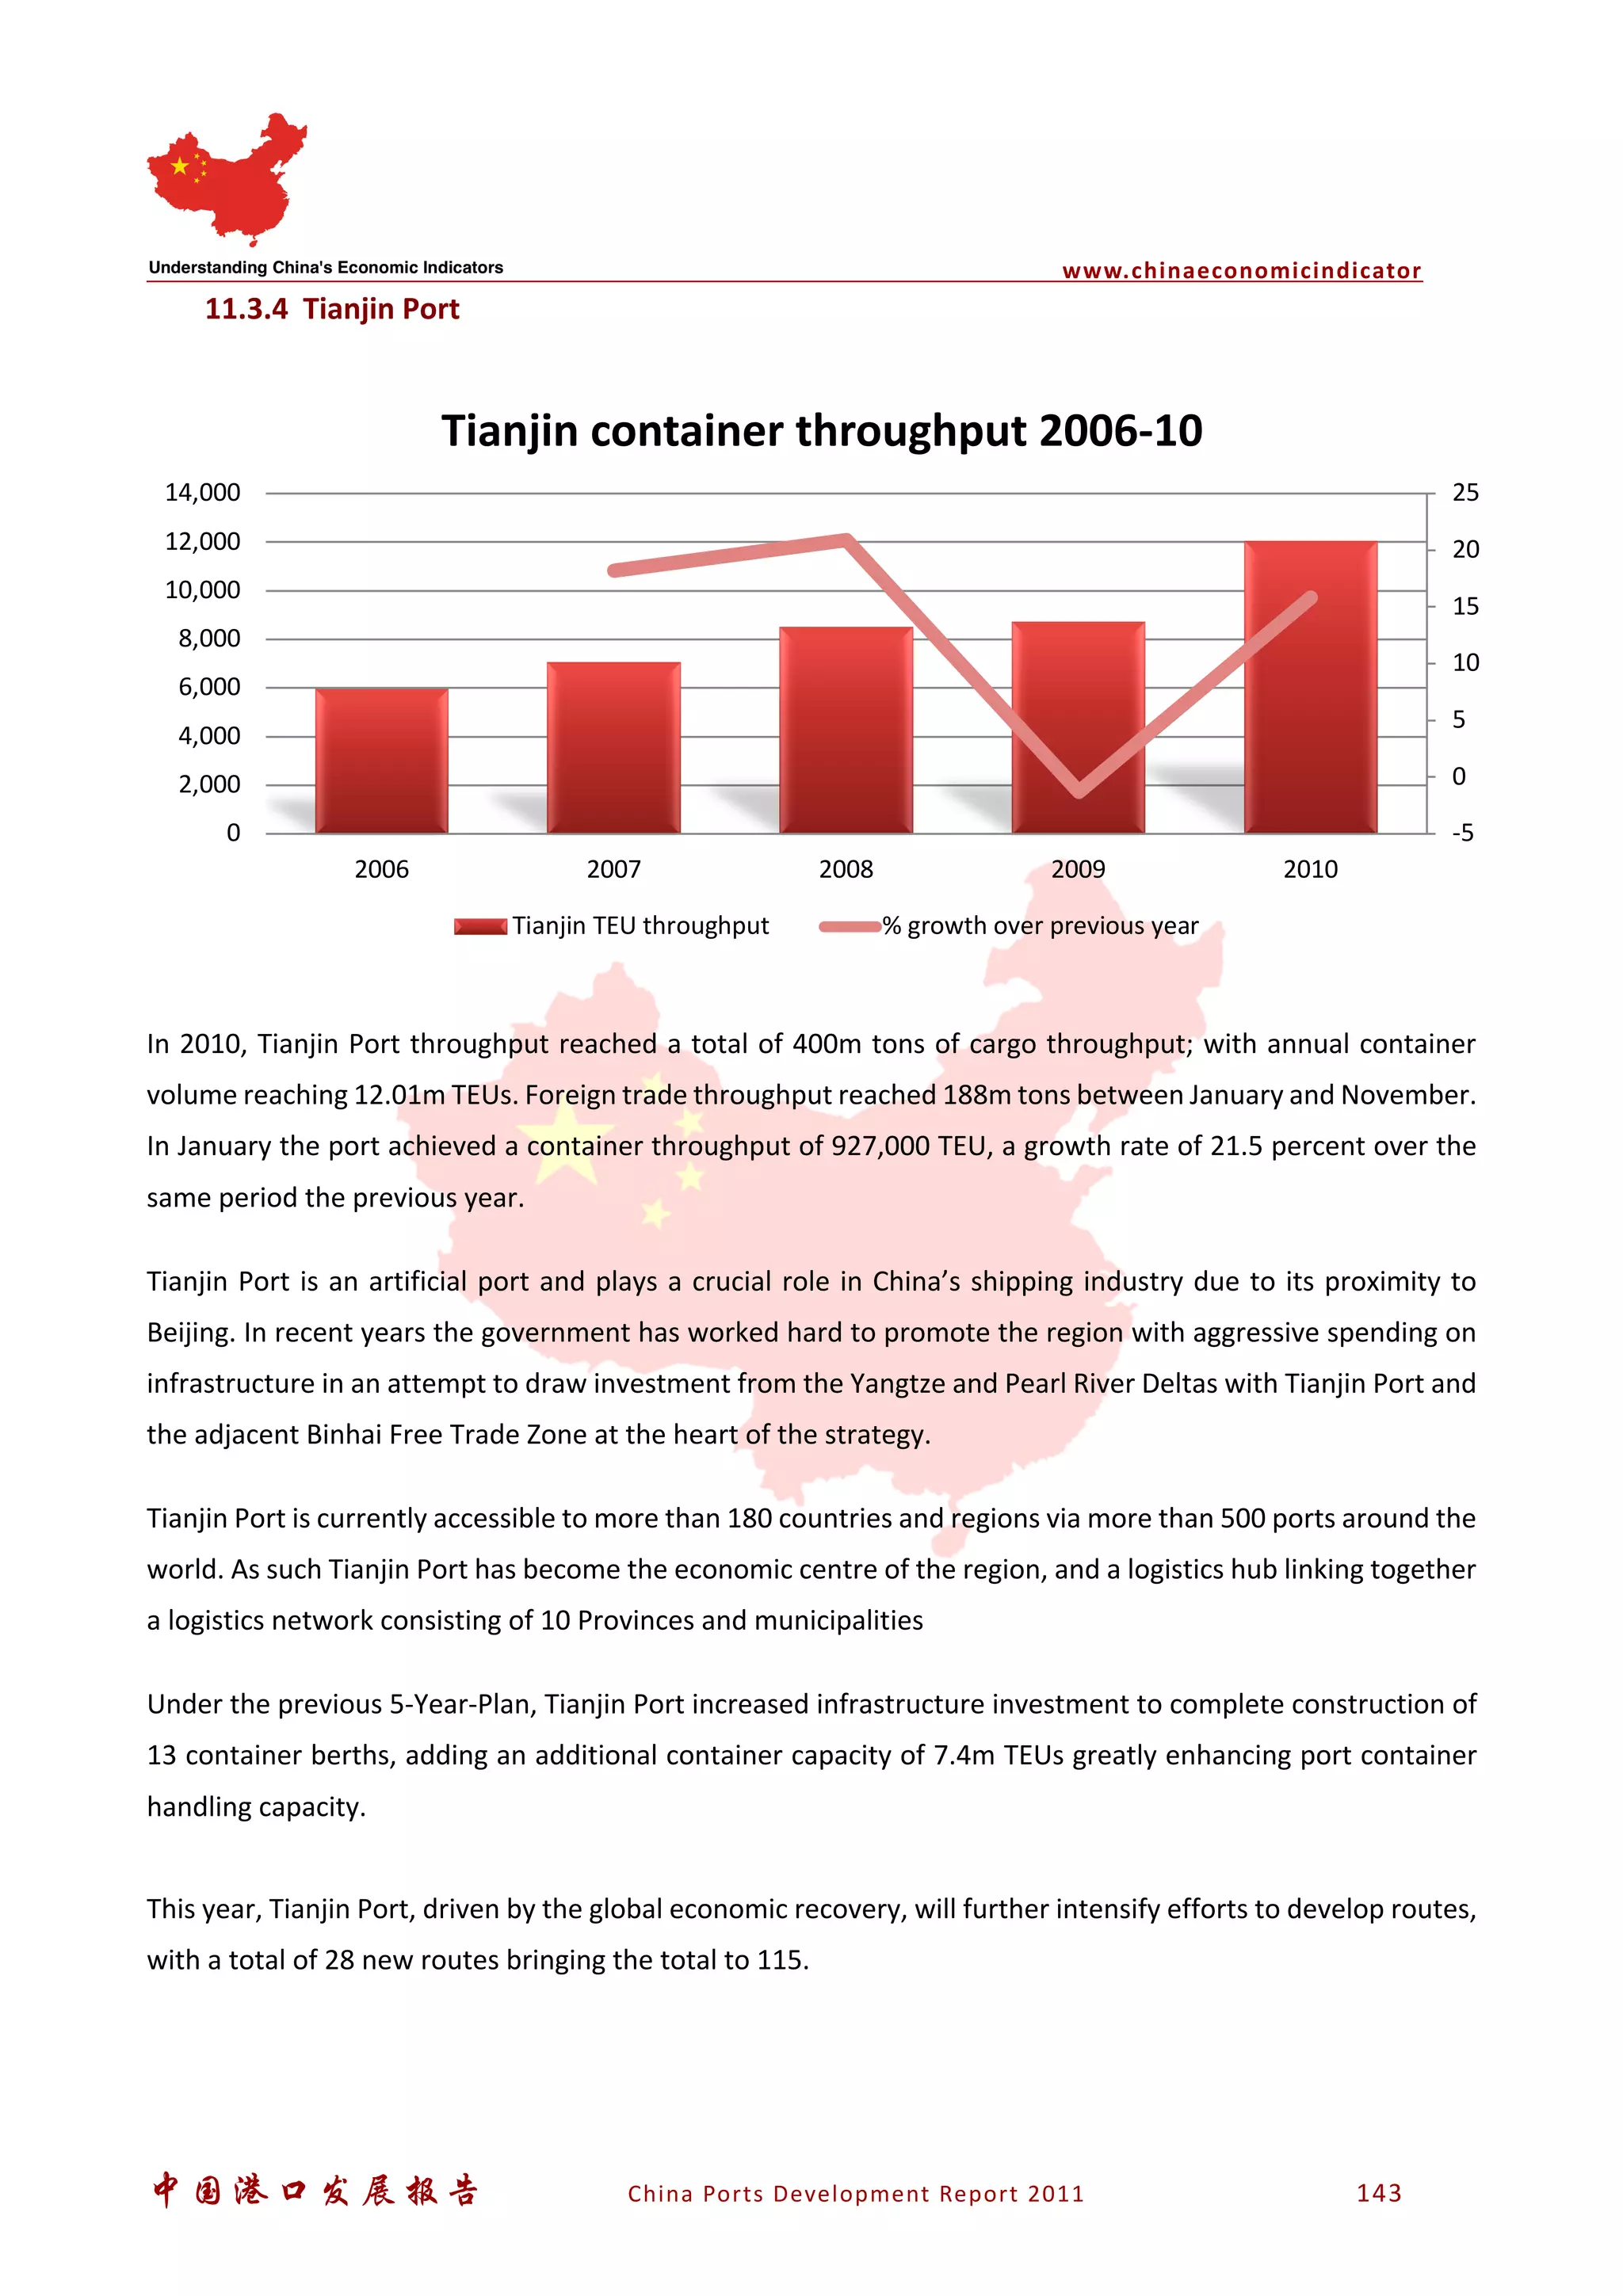


This document provides an executive summary and analysis of port development in China. It discusses China's economic growth and its relationship to the global economy and trade. Key points include China's continued economic growth despite the global financial crisis, its focus on developing national logistics networks, and forecasts for growth in foreign trade and container throughput at Chinese ports in 2011. The report also examines throughput capacity, demand, and development trends for various bulk cargoes and regions in China.


![[DSC Europe 25] Katherine Forrest - AI NOW: Understanding the Velocity of Cha...](https://cdn.slidesharecdn.com/ss_thumbnails/wvvbruqfrci0sfq9xwgb-4-251212104007-e5ad1987-thumbnail.jpg?width=640&height=640&fit=bounds)

![[DSC Europe 25] Dobrica Cosic - From Electrons to Innovation: How Granular Da...](https://cdn.slidesharecdn.com/ss_thumbnails/h4qk69zereaumbceubgr-dobrica-cosic-from-electrons-to-innovation-how-granular-data-and-analytics-are--251218085301-b982fb14-thumbnail.jpg?width=640&height=640&fit=bounds)
![[DSC Europe 25] Uros Pesic - The Reality of AI in Marketing.pdf](https://cdn.slidesharecdn.com/ss_thumbnails/rtkodnmtycovsllvzsyn-9-251215095918-b0c6bfe3-thumbnail.jpg?width=640&height=640&fit=bounds)
![[DSC Europe 25] Jean Del Rosario - How to Reduce GenAI Costs up to 73.45%.pptx](https://cdn.slidesharecdn.com/ss_thumbnails/zjehcwqsiwjisav1znml-5-251217093201-eae4440a-thumbnail.jpg?width=640&height=640&fit=bounds)


![[DSC Europe 25] Velibor Ilic - Autonomous Driving - How AI Shapes Technical ...](https://cdn.slidesharecdn.com/ss_thumbnails/gwu9aqths9ovngsrhidc-3-velibor-ilic-autonomous-driving-how-ai-shapes-technical-challenges-251219150035-7436923a-thumbnail.jpg?width=640&height=640&fit=bounds)


![[DSC Europe 25] Danica Soc - The Science Behind Marketing: Experimentation me...](https://cdn.slidesharecdn.com/ss_thumbnails/c0nofsggs9gw5ucmallr-3-251216103155-56bd64d1-thumbnail.jpg?width=640&height=640&fit=bounds)
![[DSC Europe 25] Debmalya Biswas - Agentification: the art of transforming man...](https://cdn.slidesharecdn.com/ss_thumbnails/r5azlggvtqiaiiusrqdr-4-251212103249-5a12c89b-thumbnail.jpg?width=640&height=640&fit=bounds)
![[DSC Europe 25] Kaja Kandare - LLM as a judge.pptx](https://cdn.slidesharecdn.com/ss_thumbnails/arxyccaxsdsd1ba99wjw-7-251212104007-2b4e3f64-thumbnail.jpg?width=640&height=640&fit=bounds)


![[DSC Europe 25] Branko Urosevic -Rethinking Financial Talent: Integrating Cod...](https://cdn.slidesharecdn.com/ss_thumbnails/8jjrus8ttko6qj64f58f-3-251212103250-642c6374-thumbnail.jpg?width=640&height=640&fit=bounds)