The International Journal of Engineering and Science and Research is an online journal in English published. The aim is to publish peer reviewed research and review articles fastly with out delay in the developing field of engineering and science Research.
Study of the Impact of Variability in Leading Sectoral Indices on the Volatil...professionalpanorama
The present study is undertaken with a view to understand the time-varying volatility of the
healthcare index of Bombay Stock Exchange. The main aim of the paper is to develop an
equation for estimating the volatility of the healthcare index. To achieve this aim, the author
has used autoregressive volatility measuring models. Since volatility of equities are influenced
by a number of factors, the author has also attempted to investigate if the movement in
leading sectoral indices such as Auto Index, Bankex and IT Index can be used to develop a
better forecast of time-varying volatility of the healthcare index. The empirical findings of the
study would be very useful to the investors and analysts in taking better investment decision
in healthcare stocks in the light of the time varying nature of volatility of the stock returns.
Since, volatility structure of a stock has direct bearing on its returns, the pattern of variation
in volatility of a stock is undoubtedly key factor for equity investors.
An Empirical Assessment of Capital Asset Pricing Model with Reference to Nati...ijtsrd
"This study concentrates on empirical assessment of Capital Asset Pricing Model CAPM on the National Stock Exchange NSE . CAPM assists to determine a well diversified portfolio. The main objective of this research paper is to check the applicability of Nobel laureate’s model in Indian equity market by testing the relationship between risk and return, whether there is any direct proportionality in the expected rate of return and its systematic risk. It relates its results by using the beta systematic risk as a measuring factor. The study was being conducted for a period of 260 weeks from 7 April 2013 to 25 March 2018. 45 companies from NSE were picked as a proxy for the market portfolio. This research was done by using regression analysis on stocks and portfolio to find out the final results. Research of this study nullifies that this model is applicable to the Indian market and also contradicts its expected return and systematic risk which are linearly related to each other. Miss. Yashashri Shinde | Miss. Teja Mane ""An Empirical Assessment of Capital Asset Pricing Model with Reference to National Stock Exchange"" Published in International Journal of Trend in Scientific Research and Development (ijtsrd), ISSN: 2456-6470, Special Issue | Fostering Innovation, Integration and Inclusion Through Interdisciplinary Practices in Management , March 2019, URL: https://www.ijtsrd.com/papers/ijtsrd23105.pdf
Paper URL: https://www.ijtsrd.com/management/public-sector-management/23105/an-empirical-assessment-of-capital-asset-pricing-model-with-reference-to-national-stock-exchange/miss-yashashri-shinde"
MODELING THE AUTOREGRESSIVE CAPITAL ASSET PRICING MODEL FOR TOP 10 SELECTED...IAEME Publication
Systematic risk is the uncertainty inherent to the entire market or entire market segment and Unsystematic risk is the type of uncertainty that comes with the company or industry we invest. It can be reduced through diversification. The study generalized for selecting of non -linear capital asset pricing model for top securities in BSE and made an attempt to identify the marketable and non-marketable risk of investors of top companies. The analysis was conducted at different stages. They are Vector auto regression of systematic and unsystematic risk.
Fisher Theory and Stock Returns: An empirical investigation for industry stoc...theijes
This paper examines the Fisher hypothesis using 24 industry stocks in Vietnamese stock market. Empirical results in both ex post and ex ante models show a clear rejection of one-to-one relationship between stock returns and (actual/expected/unexpected) inflation, for all industry stock returns. Interestingly, the Fisher hypothesis that common stocks can provide a complete hedge against expected inflation is strongly rejected, given these findings. However, the results show that a number of industry stocks can provide a partial hedge against both ex post and expected inflation. This study has several implications for investors.
Absolute and Relative VaR of a mutual fund.Lello Pacella
Calculated Absolute and Relative VaR using Varcov Approatch, Parametric with EWMA-estimated volatility, Historical Simulation and Filtered Historical Simulation.
The CBS Television surprise hit “Undercover Boss” has aired for six consecutive seasons and
features publicly traded firms, closely-held corporations, and in some instances not-for-profit institutions. While
there has been much analysis on the ethical dilemmas faced by the undercover CEO or other executive, no
practical analysis of a firm‟s profitability has been conducted on any of the firms featured on the show.
Conventional wisdom would suggest that financial performance of a featured firm would improve after the initial
airing date, as the show typically ends on a „feel good‟ note and most often places the executive, as well as the
firm, in a positive light. This paper analyzes the stock market price after the initial air date as well revenue and net
income for all publicly traded firms that have appears on the show through the end of the sixth season.
Fundamental and Technical Analysis with The Global Financial Crisi.docxbudbarber38650
Fundamental and Technical Analysis with The Global Financial Crisis
The Global Financial Crisis has been discussed more than any other economic event. This affair has been one of the most negative episodes in history due to its impact on the world’s economies and on such a very large population of its people. The causes of the Global Financial Crisis have been attributed to a variety of factors. Fundamental and technical analyses, in parallel importance, are two of those contributing factors. In this analyses, each analysis participator attempts to prove the usefulness of his or her principle, especially after the Global Financial Crisis because people want to be clarified what leaded them to that crisis. Both fundamental and technical analyses seek to identify future prices of stocks on the stock market and which one was responsible for the Global Financial Crisis. This essay will provide the overview of the Global Financial Crisis and mainly focusing on the reasons why fundamental analysis is not literally responsible for the Global Financial Crisis.
Fundamental analysis is the investigation of obvious and unobservable economic factors that may have an impact on the operations of a company. Like other types of analysis, it aims to predict the future prices of stocks. It also identifies the expansion of an economy and estimates which stocks are undervalued and which are expected to grow (Sharma and Preeti 2009). Kothari (2001) explains that according to fundamental analysis, a firm’s value calculated from engaging financial reports for individual companies with economic factors that may influence that company. Fundamental analysis generates this result by looking at companies’ financial statements, announcements and other available resources. Fundamentally analyzing the company’s information and examining its economic data leads often to the right prediction about stocks in the future (Abarbanell and Bushee 1997). However, Waldron and Seng (2005) believe that the purpose of fundamental analysis is a “reduction of risk in decision making”. They disprove of the idea that abnormal returns cannot be continuously gained.
It is argued that fundamental analysis is a means of gaining money from a sinuous channel rather than from a straightforward channel, as stated by Penman (cited in Waldron and Seng 2005). Although, there is no single method of fundamental analysis, according to (Sharma and Preeti 2009), fundamental analysis is made up of two processes: distinguishing between mature and young firms and studying shares that are expected to grow. There are two common methods for conducting fundamental analysis: a "top down" strategy and a "bottom up" strategy. A “top down” strategy is a methodology of analyzing company’s operations and its expected future activities then moving to an analysis of the entire macroeconomic of the country in which that company operates. Conversely, a “bottom down” strategy starts from the opposite end, narrowly analyzi.
A Study on Measures the Return and Volatility of Selected Securities in Indiaijtsrd
The study aims to understand the Return and Risk associated with FMCG stock during the period of FY 2020 2021. Here 3 FMCG stocks are chosen from NSE stock exchange and collected the data. To analyze the risk and return, standard deviation tools applied. The research finds that the Dabur India Ltd and Colgate Palmolive was generated the good returns with smaller amount deviations. So, this stock was safest players in the market. At a same time Hindustan Unilever was not generated the less amount of returns with high deviations. So this stock was not safest player in the market. P Viswanatha Reddy | Dr. Nalla Bala Kalyan "A Study on Measures the Return and Volatility of Selected Securities in India" Published in International Journal of Trend in Scientific Research and Development (ijtsrd), ISSN: 2456-6470, Volume-6 | Issue-1 , December 2021, URL: https://www.ijtsrd.com/papers/ijtsrd47966.pdf Paper URL: https://www.ijtsrd.com/management/risk-management/47966/a-study-on-measures-the-return-and-volatility-of-selected-securities-in-india/p-viswanatha-reddy
Garch Models in Value-At-Risk Estimation for REITIJERDJOURNAL
Abstract:- In this study we investigate volatility forecasting of REIT, from January 03, 2007 to November 18, 2016, using four GARCH models (GARCH, EGARCH, GARCH-GJR and APARCH). We examine the performance of these GARCH-type models respectively and backtesting procedures are also conducted to analyze the model adequacy. The empirical results display that when we take estimation of volatility in REIT into account, the EGARCH model, the GARCH-GJR model, and the APARCH model are adequate. Among all these models, GARCH-GJR model especially outperforms others.
Stock Market Prediction using Machine Learningijtsrd
Stock market prediction is a typical task to forecast the upcoming stock values. It is very difficult to forecast because of unbalanced nature of stocks. In this work, an attempt is made for prediction of stock market trend. This research aims to combine multiple existing techniques into a much more robust prediction model which can handle various scenarios in which investment can be beneficial. By combing both techniques, this prediction model can provide more accurate and flexible recommendations. However instead of using those traditional methods, we approached the problems using machine learning techniques. We tried to revolutionize the way people address data processing problems in stock market by predicting the behavior of the stocks. In fact, if we can predict how the stock will behave in the short term future we can queue up our transactions earlier and be faster than everyone else. In theory, this allows us to maximize our profit without having the need to be physically located close to the data sources. We examined three main models. Firstly we used a complete prediction using a moving average. Secondly we used a LSTM model and finally a model called ARIMA model. The only motive is to increase the accuracy of predictive the stock market price. Each of those models was applied on real stock market data and checked whether it could return profit. Subham Kumar Gupta | Dr. Bhuvana J | Dr. M N Nachappa "Stock Market Prediction using Machine Learning" Published in International Journal of Trend in Scientific Research and Development (ijtsrd), ISSN: 2456-6470, Volume-6 | Issue-3 , April 2022, URL: https://www.ijtsrd.com/papers/ijtsrd49868.pdf Paper URL: https://www.ijtsrd.com/computer-science/other/49868/stock-market-prediction-using-machine-learning/subham-kumar-gupta
A STUDY ON COMPARITIVE ANALYSIS OF VOLATILITY OF EQUITY SHARE PRICES FOR SELE...IAEME Publication
This paper explain the stock market volatility at the individual script level and at the aggregate stock price level. The empirical analysis has been done by using Generalised Autoregressive Conditional Heteroscedasticity (GARCH) model. It is based on daily data for the time period from January 2015 to December 2015. The analysis reveals the same trend of volatility in the case of aggregate stock price and two different steel company. The GARCH (1, 1) model is persistent for the two company share price.
The International Journal of Management Research and Business Strategy is a international journal in English published every day in our life. It offers a fast publication schedule of maintaining rigorous peer review..The use of recommended electronic formats for article delivery the process and submitted research review articles and Case Studies are subjected to immediate screening by the editors.
The international Journal of Marketing Management is an journal in English published every day. The fast publication schedule whilst maintaining rigorous peer review the use of recommended electronic formats for article delivery expedites the process. All submitted research review articles and Case Studies are subjected to immediate rapid screening by the editors.
The nternational Journal of Marketing Management is an journal in English published half yearly. The fast publication schedule whilst maintaining rigorous peer review the use of recommended electronic formats for article delivery expedites the process. All submitted research or review articles or Case Studies are subjected to immediate rapid screening by the editors.
Research on the Future of Assistive Technology for People with Locomotive Dis...SaiReddy794166
International Journal of Engineering and Science Research is an international journal published . This is to publish to review research and articles fastly and with out no delay in devolop field of engineering and science Research
The International Journal of Management Research and Business Strategy is a international online journal in English published. It offers a fast publication schedule of maintaining rigorous peer review.The use of recommended electronic formats for article delivery the process and submitted research review articles and Case Studies are subjected to immediate screening by the editors.
A NETWORK-BASED DAC OPTIMIZATION PROTOTYPE SOFTWARE 2 (1).pdfSaiReddy794166
The International Journal of Engineering and Science and Research is online journal in English published. The aim is to publish peer review and research articles without delay in the developing in engineering and science Research.The International Journal of Engineering and Science and Research is online journal in English published. The aim is to publish peer review and research articles without delay in the developing in engineering and science Research.
An Empirical Analysis of the Capital Asset Pricing Model.pdfSaiReddy794166
The International Journal of Engineering and Science and Research is an online journal in English published. The aim is to publish peer reviewed research and review articles fastly with out delay in the developing field of engineering and science Research.
Acetabularia Information For Class 9 .docxvaibhavrinwa19
Acetabularia acetabulum is a single-celled green alga that in its vegetative state is morphologically differentiated into a basal rhizoid and an axially elongated stalk, which bears whorls of branching hairs. The single diploid nucleus resides in the rhizoid.
Honest Reviews of Tim Han LMA Course Program.pptxtimhan337
Personal development courses are widely available today, with each one promising life-changing outcomes. Tim Han’s Life Mastery Achievers (LMA) Course has drawn a lot of interest. In addition to offering my frank assessment of Success Insider’s LMA Course, this piece examines the course’s effects via a variety of Tim Han LMA course reviews and Success Insider comments.
Read| The latest issue of The Challenger is here! We are thrilled to announce that our school paper has qualified for the NATIONAL SCHOOLS PRESS CONFERENCE (NSPC) 2024. Thank you for your unwavering support and trust. Dive into the stories that made us stand out!
Model Attribute Check Company Auto PropertyCeline George
In Odoo, the multi-company feature allows you to manage multiple companies within a single Odoo database instance. Each company can have its own configurations while still sharing common resources such as products, customers, and suppliers.
Palestine last event orientationfvgnh .pptxRaedMohamed3
An EFL lesson about the current events in Palestine. It is intended to be for intermediate students who wish to increase their listening skills through a short lesson in power point.
Biological screening of herbal drugs: Introduction and Need for
Phyto-Pharmacological Screening, New Strategies for evaluating
Natural Products, In vitro evaluation techniques for Antioxidants, Antimicrobial and Anticancer drugs. In vivo evaluation techniques
for Anti-inflammatory, Antiulcer, Anticancer, Wound healing, Antidiabetic, Hepatoprotective, Cardio protective, Diuretics and
Antifertility, Toxicity studies as per OECD guidelines
A Strategic Approach: GenAI in EducationPeter Windle
Artificial Intelligence (AI) technologies such as Generative AI, Image Generators and Large Language Models have had a dramatic impact on teaching, learning and assessment over the past 18 months. The most immediate threat AI posed was to Academic Integrity with Higher Education Institutes (HEIs) focusing their efforts on combating the use of GenAI in assessment. Guidelines were developed for staff and students, policies put in place too. Innovative educators have forged paths in the use of Generative AI for teaching, learning and assessments leading to pockets of transformation springing up across HEIs, often with little or no top-down guidance, support or direction.
This Gasta posits a strategic approach to integrating AI into HEIs to prepare staff, students and the curriculum for an evolving world and workplace. We will highlight the advantages of working with these technologies beyond the realm of teaching, learning and assessment by considering prompt engineering skills, industry impact, curriculum changes, and the need for staff upskilling. In contrast, not engaging strategically with Generative AI poses risks, including falling behind peers, missed opportunities and failing to ensure our graduates remain employable. The rapid evolution of AI technologies necessitates a proactive and strategic approach if we are to remain relevant.
June 3, 2024 Anti-Semitism Letter Sent to MIT President Kornbluth and MIT Cor...Levi Shapiro
Letter from the Congress of the United States regarding Anti-Semitism sent June 3rd to MIT President Sally Kornbluth, MIT Corp Chair, Mark Gorenberg
Dear Dr. Kornbluth and Mr. Gorenberg,
The US House of Representatives is deeply concerned by ongoing and pervasive acts of antisemitic
harassment and intimidation at the Massachusetts Institute of Technology (MIT). Failing to act decisively to ensure a safe learning environment for all students would be a grave dereliction of your responsibilities as President of MIT and Chair of the MIT Corporation.
This Congress will not stand idly by and allow an environment hostile to Jewish students to persist. The House believes that your institution is in violation of Title VI of the Civil Rights Act, and the inability or
unwillingness to rectify this violation through action requires accountability.
Postsecondary education is a unique opportunity for students to learn and have their ideas and beliefs challenged. However, universities receiving hundreds of millions of federal funds annually have denied
students that opportunity and have been hijacked to become venues for the promotion of terrorism, antisemitic harassment and intimidation, unlawful encampments, and in some cases, assaults and riots.
The House of Representatives will not countenance the use of federal funds to indoctrinate students into hateful, antisemitic, anti-American supporters of terrorism. Investigations into campus antisemitism by the Committee on Education and the Workforce and the Committee on Ways and Means have been expanded into a Congress-wide probe across all relevant jurisdictions to address this national crisis. The undersigned Committees will conduct oversight into the use of federal funds at MIT and its learning environment under authorities granted to each Committee.
• The Committee on Education and the Workforce has been investigating your institution since December 7, 2023. The Committee has broad jurisdiction over postsecondary education, including its compliance with Title VI of the Civil Rights Act, campus safety concerns over disruptions to the learning environment, and the awarding of federal student aid under the Higher Education Act.
• The Committee on Oversight and Accountability is investigating the sources of funding and other support flowing to groups espousing pro-Hamas propaganda and engaged in antisemitic harassment and intimidation of students. The Committee on Oversight and Accountability is the principal oversight committee of the US House of Representatives and has broad authority to investigate “any matter” at “any time” under House Rule X.
• The Committee on Ways and Means has been investigating several universities since November 15, 2023, when the Committee held a hearing entitled From Ivory Towers to Dark Corners: Investigating the Nexus Between Antisemitism, Tax-Exempt Universities, and Terror Financing. The Committee followed the hearing with letters to those institutions on January 10, 202
Introduction to AI for Nonprofits with Tapp NetworkTechSoup
Dive into the world of AI! Experts Jon Hill and Tareq Monaur will guide you through AI's role in enhancing nonprofit websites and basic marketing strategies, making it easy to understand and apply.
Introduction to AI for Nonprofits with Tapp Network
journal paperjournal paper
1. ISSN 2277-2685
IJESR/July 2016/ Vol-6/Issue-3/1-14
R.Selvama et. alInternational Journal of Engineering & Science Research
An Empirical Analysis of the Capital Asset Pricing Model
R.Selvama
Research Scholar, Department of Business Administration, Annamalai University, Tamilnadu,India.
Dr.A.A.Anantha
Associate Professor, Department of Business Administration, Annamalai University, Tamilnadu, India.
Abstract
Because of the importance of the stock market to the world economy and the rising stature of the Indian economy, we have
taken an interest in the Indian stock market. After much consideration, we decided to apply the Capital Asset Pricing Model
and the Asset Performance Testing Model to the Indian stock market. Due to the scarcity of scholarly works that
specifically address the Bombay Stock Exchange (BSE), we narrow in on this particular market. Using information on the
30 companies that make up the BSE and seven macroeconomic variables, we feed data into regression models based on the
CAPM and the APT model to forecast long returns. The Indian stock market could be more susceptible to CAMP or APT
model forecasts. The only type of risk considered by the CAPM-based regression model is systemic risk. In our APT-based
regression model, we use seven factors, such as daily exchange volume, volatility, and systematic risk. Using data from the
Indian stock market, we find that the APT model provides a better factor explanation than the CAPM.
Introduction
To invest is to employ capital with the expectation of profit or growth. Therefore, an investment is a monetary outlay
driven by the hope of a monetary gain in the future. When someone makes a purchase with the goal of increasing or
maintaining their wealth, they are engaging in the practice of investing. It makes no difference if the asset purchased is
cash, a house, gold, or anything else. If the asset is a financial one, such as a stock, debenture, government bond, or mutual
fund unit, the returns could be in the form of a regular income, a significant appreciation in value, or a combination of the
two. Share price behavior, and in particular the risk-reward relationship in the financial markets, has long piqued the
curiosity of academics. In 1905, a young scientist named Albert Einstein developed a brilliant theory based on Brownian
motion that he used to demonstrate the existence of atoms. Brownian motion was also explained by Einstein in the same
year that he presented his theory of relativity. His research was revolutionary for its time.
Despite the fact that modern financial theory uses systematic factors as sources of risk and expects long-term returns on
individual assets to reflect the changes in such systematic factors, very few studies have been undertaken to determine what
factors influence the risk and return relationships in the Indian capital market. Therefore, we set out to research how assets
prices in the Indian stock market move and how well equilibrium models like APT and the CAPM explain the factors that
contribute to the generation of returns on securities.
If the returns on Australian stock indexes can be explained by macroeconomic factors specified in Arbitrage Pricing Theory
(APT), GaoxiangWang(2008) looked into it. The results of this analysis were derived from ASX equity return data
collected between March 31, 2000 and December 31, 2007. Three to five of the thirteen macroeconomic factors analyzed
can account for the vast majority of the variance in the returns of the industry indexes. Empirical research reveals that the
APT framework's use of macroeconomic elements can help explain consumers' expenditure on discretionary items
2. P
including energy, finance, IT, and materials. price index returns are inexplicable, but index returns in general are not. APT
is a promising approach for assessing the ASX200 since it can account for the returns of the industry indexes in half of all
cases.
In 2010, ErieFebrian and AldrinHerwany conducted research into the viability of CAPM and APT in explaining the
enhanced returns of a portfolio of shares traded on the Jakarta Stock Exchange. Data from the years leading up to the crisis
(1992–1997), during the crisis (1997–2001), and after the crisis (2001–2007) were analyzed. The results favored APT,
indicating that factors other than Beta may account for the excess returns on a portfolio. Even fewer studies have examined
the efficiency of stock markets in Asia's emerging economies.
Methodology
In both the CAPM and the APT, a two-stage test is used, as is commonplace in the scholarly literature. The first steps in
using the CAPM and the APT are to estimate share betas using time series data and to estimate factor loadings using factor
analysis. Second, we test how well the sample mean return matches the CAPM and the APT by doing regressions on the
beta (for the CAPM) and the factor loadings (for the APT).The time period covered by this study extends from the
beginning of 2010 to the end of 2014.
Objectives
The first step is to perform a CAPM-style risk-return analysis.
As a second step, we must establish the cost-benefit analysis along APT lines in order to:
Evaluate the significance of systematic variables in predicting stock prices and the results of a portfolio
We will evaluate CAPM and APT using simulated data to see which model is better at predicting future returns.
5 Justifying the movement of stock prices.
The sixth goal is to find out if stock prices are affected by macroeconomic trends.
Data Analysis and Interpretation
The current study additionally analyzes the CAPM and APT with fake components using residual analysis to establish
which model is preferable in capturing the behavior of share prices in the Indian context.
Normality Test
BSE India monthly share prices for 30 companies are used in the current study comparing CAPM and APT in the Indian
market. The BSE30 market index serves as the starting point for the CAPM model's evaluation of security risk. From 2010
to 2014, researchers looked at data. Share price returns (Rit) are calculated by subtracting the current stock price (Pt) from
the next stock price (Pt+1). The formula is as follows:
R
P
t1
1
it
t
Mean, standard deviation, skewness, kurtosis, and the Shapiro Walk W test for normality are presented in Table-1 for the
share price returns of selected companies and the BSE30 market index. Here, we use the Shapiro Walk test to check if the
time series of stock prices follows a normal distribution. In addition to skewness and kurtosis, this test can tell you if your
data is normally distributed.
Below is a table showing the average ROI for 30 selected businesses between January 2010 and June 2014 (54 months).
The values for ROI are between -0.0161 and 0.0273. Only six companies (or their stock values) have exhibited negative
returns; the remaining twenty-four have all increased in value.
3. Table-1: Summary Statistics
No. Scrip Name Mean SD Skewness Kurtosis Shapiro-Wilk
W Test
Normality
1 AXIS 0.0076 0.1188 0.1801 -0.0748 0.9763ns
0.5693
2 BAJAUT 0.0184 0.0682 -0.3476 0.3782 0.9801ns
0.7175
3 BHEL -0.0161 0.2289 0.8422 10.2448 0.7977** 0.0000
4 BHATE 0.0048 0.0920 0.3628 -0.2459 0.9773ns
0.6087
5 CIPLA 0.0056 0.0624 -0.0403 -0.7246 0.9719ns
0.4116
6 COALIN 0.0052 0.0795 0.8736 1.6296 0.9579ns
0.1119
7 DRREDDY 0.0178 0.0608 0.1066 -0.1888 0.9822ns
0.7923
8 GAIL 0.0000 0.0568 -0.2804 -0.3024 0.9723ns
0.4240
9 HDFCBNK 0.0036 0.1330 -4.3700 26.7716 0.6344** 0.0000
10 HEROMOT 0.0109 0.0762 -0.0849 -0.0659 0.9832ns
0.8279
11 HINDAL 0.0071 0.1092 0.8167 0.6850 0.9492* 0.0440
12 HUL 0.0196 0.0669 0.7695 2.0158 0.9699ns
0.3512
13 HDFCCOR -0.0021 0.1252 -4.8802 30.8124 0.5862** 0.0000
14 ICICI 0.0152 0.1044 0.4464 0.9269 0.9780ns
0.6350
15 INFOSYS 0.0090 0.0835 -0.3103 0.6843 0.9780ns
0.6339
16 ITC 0.0100 0.0860 -3.3792 18.4616 0.7439** 0.0000
17 LT 0.0076 0.1185 -0.3259 2.2186 0.9708ns
0.3763
18 MAHMAH 0.0090 0.0974 -2.2738 9.1694 0.8439** 0.0000
19 MARUTI 0.0153 0.1092 0.6597 0.5428 0.9564ns
0.0953
20 NTPC -0.0017 0.0840 1.9054 6.5047 0.8611** 0.0000
21 ONGC 0.0001 0.1074 -2.1510 12.0106 0.8389** 0.0000
22 RELIND 0.0032 0.0745 0.3122 -0.5980 0.9673ns 0.2787
23 SESASTER 0.0135 0.1915 0.5755 2.7060 0.8733** 0.0000
24 SBI 0.0099 0.1016 0.6002 0.3354 0.9620ns 0.1696
25 SUNPHAR -0.0008 0.1632 -4.3248 23.5509 0.5978** 0.0000
26 TCS 0.0217 0.0621 0.3950 0.2023 0.9809ns 0.7446
27 TATMOT 0.0273 0.1155 0.1586 0.8460 0.9847ns 0.8720
28 TATPOW -0.0159 0.1565 -3.3601 19.9856 0.7290** 0.0000
29 TATSTL 0.0066 0.1273 0.5507 -0.0485 0.9601ns 0.1394
30 WIPRO -0.0019 0.1030 -1.0568 4.9822 0.9351** 0.0090
The skewness indicates that only 9 of the 30 stocks even come close to having a normal distribution (generally speaking, a
skewness that is either greater than 1.0 or less than -1.0 indicates that the distribution is highly asymmetrical). That is to
say, 21 distinct stocks have distributions that are typical with respect to skewness.
The kurtosis for the monthly time series reveals that for 10 stocks, it is greater than 3, while for the other 20 stocks, it is less
than 3. In addition, this indicated that the bulk of the animals used in the study behaved normally during the study period.
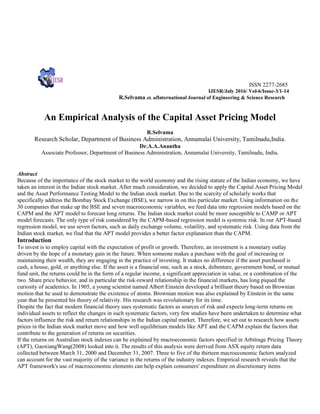
4. The results of the Shapiro-Wilk W Test likewise provide strong support for the aforementioned conclusion. Twelve
companies (BHEL, HDFC Bank, HDFC Corporation, HINDAL, ITC, MAHMAH, NTPC, ONGC, SESASTR, SUNPHAR,
TATPOW, and WIPRO) have a W value that is statistically significant, indicating that their distributions are not normal.
During the time period analyzed, the remaining 18 stocks are determined to have followed a normal distribution.
The normalcy test is passed for the BSE 30 market index. Overall, the stock price time series data that were examined
showed generally normal behavior over the duration of the study. CAPM Evaluations:Table 2 displays the findings of the
analysis. T-values, which are used to determine whether or not an estimated parameter has statistical significance, are
supplied in brackets below the coefficient. The table shows that the estimated CAPM model for both periods is statistically
significant, with explained variances of 90.58 percent for the first period, 83.80 percent for the second period, and 88.69
percent for the entire period after adjusting for degrees of freedom.
This demonstrates that the chosen stocks have outperformed the market risk during the study period and its sub-periods.
Each one-unit increase in market risk was met with an increase in average returns from 30 chosen stocks of 0.8580 units in
the first sub-period, 0.8649 units in the second sub-period, and 0.8658 units for the entire study period. The resulting
equation for the total study period of January 2010–June 2014 monthly returns of the Indian stock market is:
E[ Ri ]
Table-2: Cross Sectional Regression of Returns
Period λ0 λ1 R2
Adj R2
Jan-2010 to Jun 2012 -0.0037
-(1.22)
0.8580**
(16.44)
0.9091 0.9058
Jul 2012 to Jun 2014
0.0014
(0.41)
0.8649**
(10.96)
0.8451 0.8380
Jan-2010 to Jun 2014
-0.0014
-(0.63)
0.8658**
(20.22)
0.8891 0.8869
*Significant at 1% level
Figures in parenthesis represents’t’ values
Test for the APT
In this study, monthly returns on a sample of 30 equities serve as the dependent variable against which the APT
model is evaluated using components derived from principal component factor analysis. The results of a factor
analysis are displayed in Tables 3 and 4, which detail the possible number of components underlying the data as
well as the factors themselves. Table 3 displays the eigenvalue of the underlying factors of the stocks. The
eigenvalue of a factor is the fraction of the total variation in the data that can be explained by that factor alone. A
valid factor is one with an eigenvalue greater than one. As can be seen in the table, all of the first eight components
have eigenvalues larger than one.
The merged data retains 79.9 percent of the characteristics of the original data. To correctly explain the 30 stocks,
then, the first eight components are all that are needed. This image represents the data shown by the Scree plot.
7. b b b b b b
Table-5: APT Model
Cross Sectional Regression of Returns
R i λ 0 λ1
ˆ λ 2 b̂2 λ3
ˆ λ 4 b̂4 λ5
ˆ λ 6
ˆ λ 7
ˆ λ8
ˆ η i
Period
λ0 λ1 λ2 λ3 λ4 λ5 λ6 λ7 λ8 R2
Adj R2
F Value
Jan-2010
to
Jun
2012
0.0060**
(4.05)
0.0440**
(25.21)
0.0033
(1.60)
0.0151**
(12.55)
0.0022
(1.36)
0.0017
(0.94)
0.0047*
(2.39)
0.0138**
(9.70)
0.0083**
(5.17)
0.9846 0.9784 159.50**
Jul
2012
to
Jun
2014
0.0076**
(4.00)
0.0397**
(14.39)
0.0056*
(2.48)
0.0172**
(4.30)
0.0103**
(5.04)
-0.0020
-(0.96)
0.0032*
(1.96)
0.0146**
(5.08)
0.0049*
(2.05)
0.9685 0.9516 57.56**
Jan-2010
to
Jun
2014
0.0070**
(5.78)
0.0406**
(33.11)
0.0062**
(5.03)
0.0152**
(12.43)
0.0068**
(5.58)
-0.0022
-(1.83)
0.0038**
(3.12)
0.0144**
(11.71)
0.0063**
(5.11)
0.9712 0.9660 185.45**
*Significant at 5% level; **Significant at 1% level
Figures in parenthesis are ‘t’ values.
Table 4 displays the study's factor loadings, which indicate which of the eight factors the stock is
most strongly associated with. When a stock's factor loading is greater than 0.50, it is highly
correlated with that factor. After ICICI, TATSTL, HINDAL, and SBI, LT, MARUTI, RELIND,
TATMOT, AXIS, NTPC, TATPOW, COALIN, and HDFCBNK all place a heavy emphasis on the
first factor. INFOSYS and TCS carry the bulk of the work, with WIPRO coming in at a close third.
ITC and HDFCCOR both make sizable contributions to the third factor, whereas DRREDDY has
an outsized effect on the fourth. Factor five represents HEROMOT, BHEL, SUNPHAR, and
BAJAUT's stocks; factor six, BHATE and SESASTR's; factor seven, MAHMAH, ONGC, and
GAIL's; factor eight, HUL's loading; and factor nine, CIPLA's loading. The following table lists
the technical aspects of the APT model. The predicted results are shown in Table 5.
In Table 5, we can see that the APT model matches the first two time periods far more closely than
the CAPM model does. After accounting for degrees of freedom, the components in the
independent set may account for as much as 97.84% of the volatility in the stock price return. The
adjusted explained variance for the full study period was 95.16 percent, and for the second sub-
period it was 95.16 percent. The explanatory variance shows that APT has outperformed CAPM
during the whole research period and in each individual sub-period. The following APT formula
was derived from the entire research period of the Indian stock market:
E[Ri ] 0.0070 0.0406bi1 0.0062bi2 0.0152bi3 0.0068bi4 0.0022bi5
0.0038bi6 0.0144bi7 0.0063bi8 εi
1 3 5 6 7 8
8. b b b b b b
1
Comparison between CAPM and APT: Residual Analysis
The results of these models are displayed in Tables 6 and 7.Table 7 demonstrates that the regression model for CAPM
residuals on the Factor loadings is fitted substantially at the 1% level during the whole 54-month research period,
commencing in January 2010 and concluding in June of that year 2014, when the effects of CAPM were taken into
account, the APT model still accounted for 24.8% of the residual variation in the full-period model. However, as can be
shown from the regression results in Table 6, CAPM is unable to explain the observed time-varying APT residual. This
is because, for both the two sub-periods and the full period, the overall fit of the regression model yields negative adjusted
R2 values, suggesting unsuitable models.
Table-6: CAPM ModelRegression of Residuals of the APT Residuals on Beta
εi λ0 λ1
ˆ η1
Period λ0 λ1 R2
Adj R2
Jan-2010 to Jun 2012
0.0003 -0.0005 0.0232 -0.0129
(0.24) -(0.80)
Jul 2012 to Jun 2014
-0.0003 0.0005 0.0115 -0.0335
-(0.20) (0.51)
Jan-2010 to Jun 2014
-0.0001 0.0001 0.0011 -0.0185
-(0.08) (0.24)
*Significant at 1% level: Figures in parenthesis represents‘t’ values.
Table-7: Regression of Residuals of the CAPM on the Factor Loadings
η i λ 0 λ1
ˆ λ 2 b̂2 λ3
ˆ λ 4 b̂4 λ5
ˆ λ 6
ˆ λ 7
ˆ λ8
ˆ ε i
Perio
d
λ0 λ1 λ2 λ3 λ4 λ5 λ6 λ7 λ8 R2
Adj R2 F
Value
Jan-2010
to
Jun
2012
0.0009
(0.36)
0.0050
(1.64)
-0.0023
-(0.62)
0.0055**
(2.61)
-0.0056
-(1.94)
0.0010
(0.31)
-0.0069*
-(2.00)
0.0010
(0.40)
-0.0031
-(1.08)
0.4761 0.2665 2.27ns
Jul
2012
to
Jun
2014
-0.0011
-(0.37)
0.0058
(1.34)
-0.0028
-(0.78)
-0.0037
-(0.58)
0.0015
(0.48)
-0.0062
-(1.93)
-0.0039
-(1.48)
0.0007
(0.16)
-0.0016
-(0.42)
0.4963 0.2277 1.85ns
β
1 3 5 6 7 8
9. Jan-2010
to
Jun
2014
0.0000
(0.00)
0.0039*
(2.02)
-0.0028
-(1.46)
0.0047*
(2.47)
-0.0011
-(0.59)
-0.0035
-(1.85)
-0.0050**
-(2.59)
0.0015
(0.76)
-0.0026
-(1.36)
0.3640 0.2484 3.15**
*Significant at 5% level; **Significant at 1% level
Figures in parenthesis are ‘t’ values.
Factor Structure of Indian Economy
Seven macroeconomic variables, including the IPI, GIP, TRDDEF, FIIS, MONSUP, WSPI, and CPIFORIW, are
subjected to principal component technique of factor analysis in order to determine the structure of the Indian
economy. The analyzed outcomes are shown in Tables 8 and 9. Table 8 shows that the variation in the original data
can be accounted for by the first two components (eigenvalue > 1), and that these two factors combined account for
75.99% of the variance. The macroeconomic state of the Indian economy is shown below, and it reveals two main
factors. Scree plots are another visual representation of this. Table 9 displays the factor loadings of each variable
with the valid two factors derived from the research, making it possible to identify which component reflects which
macroeconomic circumstances. All macroeconomic variables, with the exception of TRDDEF, are first-factor
loaded, as shown in the table. Among the factors that have been loaded, MONSUP and CPIFORIW have the highest
loadings, followed by WSPI and IPI with high loadings, and finally GIP with a large loading.
Table-8: Total Variance Explained by Factor Components of Macro Economic Variables
Factor
Initial Eigenvalues After Varimax Rotation
Eigenval
% total
Variance
Cumul.
%
Eigenval
% total
Variance
Cumul.
%
1 4.0810 58.30 58.30 4.0810 58.30 58.30
2 1.2383 17.69 75.99 1.2383 17.69 75.99
3 0.9945 14.21 90.20
……. ……… ……. …..
7 0.0334 0.48 100.00
Table-9: Factor Loadings of Macro Economic Variables
VARIABLES FACTOR 1 FACTOR 2
IPI 0.8526 0.3751
GIP -0.7872 0.3567
TRDDEF -0.0066 0.9710
FIIS -0.2105 -0.1522
MONSUP 0.9765 -0.0053
WSPI -0.8855 0.0640
CPIFORIW 0.9759 -0.0105
10. The second factor wholly represents TRDDEF as only this variable is very highly loaded with second
factor. The scores of these factors obtained from the analysis are used in the subsequent regression model.
Economic Determinants of Stock Returns
The purpose here is to identify the nexus between the manufactured elements and the broad economic indicators. The
factor analysis's classification of the Indian economy is used to inform the selection of economic variables. The
development of a set of macroeconomic variables that permits lowest overlapping and maximum quantity of
independent information in each variable requires careful selection of variables connected to various artificial causes.
The APT model's null hypothesis that the two factors explaining macroeconomic variables are independent is accepted
on the basis of these techniques.
FSjt λ 0λ1bi1 λ2bi2 εi
Table-10: Regression Results Showing Significance of Economic Variables
Factor λ0 λ1 λ2 R2
Adj R2
F Value
FS1
-0.0024 0.1598 0.1029 0.0365 -0.0020 0.95ns
-(0.02) (1.14) (0.74)
FS2
-0.0005 0.0861 0.1043 0.0186 -0.0206 0.47ns
(0.00) (0.61) (0.75)
FS3
-0.0031 0.0498 -0.1146 0.0154 -0.0240 0.39ns
-(0.02) (0.35) -(0.82)
FS4
0.0038 -0.0985 0.0788 0.0154 -0.0239 0.39ns
(0.03) -(0.70) (0.56)
FS5
0.0043 -0.1001 0.1046 0.0204 -0.0188 -0.52ns
(0.03) -(0.71) (0.75)
FS6
0.0055 -0.1421 0.1152 0.0324 -0.0063 0.84ns
(0.04) -(1.01) (0.83)
FS7
-0.0008 0.1089 0.1211 0.0270 -0.0119 0.69ns
-(0.01) (0.77) (0.87)
FS8
-0.0011 -0.0079 -0.0803 0.0066 -0.0332 0.17ns
-(0.01) -(0.06) -(0.57)
*Significant at 5% level; Figures in parenthesis are‘t’ values.
The results of the regression are exhibited in Table 10. It is surprising to see the results reported in the table that
none of the models is explained significantly by macro-economic factors. This indicates that the shares are not
priced for status of Indian economic during the period under study.
Conclusion
The results of the APT-based regression analysis suggest that the independent components could explain for 97.84%
11. of the variation in the stock price return in the initial sub-period after correcting for degrees of freedom. For the full
study period, the adjusted explained variance is 96.60 percent, while for the second sub-period, it is 95.16 percent. It is
clear from this table that the APT is superior to the CAPM when applied to the Indian stock market. APT outperforms
CAPM in the Indian stock market because it accounts for risk associated with the market portfolio in addition to risk
bearing on extra systematic elements.
The major purpose of this study was to compare the CAPM with the APT using residual analysis to see which model
more accurately explains the data. Based on these results, it can be concluded that the CAPM's residuals on the Factor
loadings were fitted significantly at the 1% level during the whole 54-month study period starting in January 2010 and
concluding in June 2014. In addition, the APT is anticipated to account for the 24.84 percent of the volatility in the
return on share prices that cannot be explained by CAPM. However, it is found that CAPM does not fully explain the
variance in stock returns that are not explained by APT. Therefore, APT provides a more satisfactory explanation for
the return on investment in the Indian stock market than does CAPM. Regression of artificial factors with macro-
economic variables chosen using the factor analysis's classification of the Indian economy reveals that macroeconomic
factors cannot account for the returns on investment in the Indian stock market. Factor analysis of macro-economic
variables likewise reveals that, with the exception of the trade deficit, most other macro-economic variables in the
Indian economy follow a similar pattern. The overall complex behavior of share portfolio returns in the Indian stock
market cannot be well explained by market risk alone, it is shown. The performance of a portfolio is also heavily
influenced by a number of other systemic elements. However, macro variables in the Indian economy cannot be used
to predict the behavior of share price return series in the Indian stock market. Both academics conducting future
research in this area and stock market participants can benefit from the findings of the current study. This examination
of CAPM and APT was conducted using thirty different equities. A larger sample size, however, may allow for more
economic aspects to be investigated and a more robust generalization to be attained. Cluster analysis can also be used
to categorize different kinds of businesses based on their impact on the economy.
Bibliography
1. 1) Amanulla, S., and B. Kamiah, "Asset Price Behavior in the Indian Stock Market: How Inadequate Is Arbitrage
Pricing Theory?," International Journal of Development Banking, July 1997, pp.39-61.
2. M. Ariff and L.W. Johnson, "Security Market and Stock Pricing," Longman, 1990.
3. Thirdly, Arnold C.S. Cheng and L.W. Cheng's "The UK Stock Markets and Economic Factors: A New Approach,"
published in the Journal of Business Finance &Accounting in January 1995, pages 129-192.
4. 5, F. Black, "Beta And Return," Journal of Portfolio Management, Fall 1993.
5. Number 38, 1983, of the Journal of Finance, pages 6 Chen, N.F. "Some Empirical Tests of Arbitrage Pricing."
6. N.F. Chen, R. Roll, and S.A. Ross, "Economic Forces and the Stock Market," Journal of Business, Vol. 59, 1986.
7. Eighth, in 1983, Chen N. published "Some Empirical Test of the Theory of Arbitrage Pricing" in the Journal of
Finance, on pages 1393-1414.
8. 9 N. Chen, R. Roll, and S. Ross, "Economic Forces and the Stock Market," Journal of Business, July 1986, pp. 383-
403.
9. "The UK Stock Market and Economic Factors: A New Approach," by A.C.S. Cheng, was published in the Journal
of Business Finance and Accounting, Volume 22, 1995.
10. Eleventh, "Macroeconomic Factors: Then APT and the UK Stock Market" by Clare A.D. and Thomas SH was
published in the Journal of Business Finance and Accounting in 1994.
11. Economics, 1981, Vol. 49, Davidson, R., and Mackinnon, J., "Several Tests for Model Specification in the
Presence of Alternative Hypotheses."
12. 12. Journal of Business, Volume 36, 1984, page 13: Friend Evidence On the Arbitrage Pricing Theory, by P.J.
Dhrymes.
13. Journal of Business, vol. 38, 1963, Fama, E.F. "Mandelbrod And The Stable ParteianHypothrses," for
instance.Economic historian and Nobel laureate Eugene F. Fama published "The Behaviour of Stock Market
Prices" in the Journal of Business in 1965.
14. In 1996, E.F. Fama's "Multifactor Portfolio Efficiency and Multifactor Asset Pricing" appeared in Volume 31 of
the Journal of Financial Quantitative Analysis.Economists Eugene Fama and Kenneth French published "The
Cross-Section of Expected Stock Returns" in 1992's Journal of Finance, Volume 47, Issue 2.
15. 18. We Need the CAPM Badly, If You Can Find It, Journal of Finance, Volume 51, 1996, pages 19–18, authors:
E.F. Fama and K.R. French. The Journal of Political Economy, Volume 81, Number 20 in 1973, had an article by
Edward F. Fama and James D. Macbeth titled "Risk, Return, and Equilibrium: Empirical Tests."
16. A good place to start is with "Stock Returns, Expected Returns, and Real Activity," by Eugene F. Fama, which
appeared in the November 1990 issue of the Journal of Finance (vol. 45, pp. Finance India, Vol. VII, No. 4, 1993,
pp. 863-874; O.P. Gupta and Sanjay Segal, "An Empirical Testing of the Capital Asset Pricing Model in India."
17.
18. Finally, for the third time, I refer you to the Journal of Business Finance & Accounting article "Share Price and
Economic Factors" by Groenewold and Faster (pp.1367–1383).
19. Journal of Business Finance and Accounting, Volume 18, Issue 4, Pages 4 (December 1997), "Share Price and
Macroeconomic Factors." N. Groenewold & P. Faster.
20. Grundy and Malkiel (1996) write in the Journal of Portfolio Management (Vol.22) that rumors of beta's death
have been grossly overstated.
21. M.N. Gultekin and N.B. Gultekin, "Stock Return Anomalies and the Test of Appropriateness," Journal of Finance,
Vol. 42, No. 1, 1987.
22. Journal of Finance, Volume 50, 1995, authors S. P. Kothari, J. Shanken, and R. G. Sloan, Another Cross-Sectional
Analysis of Expected Stock Return.
23. Economics of Finance, Vol.21, 1988 Journal of; "The Empirical Foundations of the Arbitrage Pricing Theory," by
Brian Llehmann and David Modest.
24. Journal of Business, Vol. 36, 1963, Mandelbrot, B., "The Variation of Certain Speculative Prices," is the ninth
citation.
25. Y.Scree Rama Murthy's article "Share Prices and Economic Activity in India: A Multiple Regression Approach"
appeared in the January-June 1994 issue of Decision (pp.86-87).
26. Y.Scree Rama Murthy, "Share Prices and Economic Activity in India: A Multiple Regression Approach,"
Decision, January-June 1994, pp. 86-87.
27. Harry M. Markowitz, "Portfolio Selection," Journal of Finance, vol. 7, no. 1, january 1952.
28. Article by NarayanaRao and Bhole on inflation in equity returns; Economic and Political Weekly; May 26, 1990;
pp. m91-m96.
29. Page 14 of Operational Research, Seventh Volume (1959) Osborne, M.F.M., "Brownian Motion in the Stock
Market."
30. M. Thomas Paul and Business Kamaiah, "Stock and Money Demand in India," Darain, Vol. 21, No. 3, 1992, pp.
309-323.