The document presents a new methodology for allocating active power transmission losses in deregulated power systems, addressing the challenges posed by the non-linear nature of power loss allocation. This method divides lossy transmission lines into sub-lines based on load connections and utilizes a proportional sharing technique to trace power flow, leading to a fair allocation of losses to the respective loads. The proposed method demonstrates improved accuracy over existing techniques when applied to various test systems, including a six-bus system and larger bus configurations.
![ ISSN: 2088-8708
IJECE Vol. 7, No. 4, August 2017 : 1725 – 1737
1726
while generator meters measure their actual productions, i.e., the consumptions of customers plus the
network losses. In the deregulated power systems, the loss minimization is quite important before loss
allocation. A network reconfiguration method for loss reduction and voltage profile improvement has been
discussed by Myint, et al [1]. Hlaing, et al [2] have developed an efficient technique for loss minimization of
power distribution network using different types of distributed generation unit. Naturally, the problem of
“who should pay for losses” arises, and those payments constitute a substantial amount of money [3]. Further
in a complete system of power network, different customers are taking their required power through the
different paths with different amount of loads and hence, the losses caused by them are not unique. So, it is
an essential and challenging task to allocate the contributions of power flow and loss from individual
generator to the loads through the transmission system. Different methods [4] have been proposed to trace
out the power flow and loss in the arena of deregulated power system. The assignment of cross terms in
power equation, particularly when the involved transactions are greatly different in sizes, have been analyzed
and some results like Proportional allocation, Quadratic allocation, Geometric allocation, Fast geometric
allocation are proposed by Exposito et al. [5]. Power tracing methods based on proportional sharing principle
are proposed in [6-8]. All power injections are translated into real and imaginary currents to avoid the
problems arising from the non-linear coupling between active and reactive power flows caused by losses. Bus
impedance matrix and radial equivalent network approaches have been worked out in [9-11]. A physical-
flow-based approach in a multiple transaction system with a new concept of counter flow associated with the
losses has been demonstrated in ref. [12].
The Transmission and Distribution loss (T/D loss) figures prominently in the planning section of
both government and public sector in the environment of deregulation. In India, T/D loss is 21% which is
much higher to the World average [13] and also to the average value of Lower Middle Income group in
which India belongs to. In comparison with a small and under developing country like Indonesia, India‟s T/D
loss is 2.34 times more and in comparison to China, it is 3.5 times, whereas the per capita consumption of
electrical energy in China is 4.82 times more than India. The government of India has failed to achieve the
target rate of Aggregate, Technical and Commercial (ATC) losses under the Accelerated Power Development
and Reform Programme (APDRP) [14]. Therefore, efforts have to be made in particular to the deregulated
market parlance to reduce the T/D loss. To do so, two point strategies may be adopted. Firstly, a fair
approach is to be utilized to trace out the system which is responsible for the loss and its amount. Secondly,
suitable technologies are to be adopted to minimize the losses. Fair allocation of transmission loss in a power
system is a complicated job due to the non-linearity nature of electric current. Accordingly the cost allocation
of Transmission Losses in Electric Market Mechanism [15] is a research area to be explored. The research is
going on to give a viable approach for loss allocation under deregulated enivironment. In the present day
context, two types of methods such as Pro rata (Proportional Ratio) and ITL (Incremental Transmission Loss)
are being prominently used to allocate the transmission loss. Even though the Pro rata method is a simple one
but it does not take the relative locations of loads in a system. In ITL, there is a possibility of over-recovery.
Another suitable method [16] has been formulated for aforesaid case which has been used in a Six-bus case.
The transmission loss allocations obtained by this method were compared with the results obtained from ITL
and Pro rata methods. The argument made by this method gives more justification in the case study of a Six-
bus test system. However, for the higher bus system like IEEE-30 bus case, the sum of individual loss
allocations appears to be very high in comparison to the total loss worked out by the power flow solution.
In this paper, a new method is proposed in modification to the above method [16], for the
calculation of real power loss allocation to the loads while keeping the logic of physical power flow as it is.
This proposed method is used for the same six-bus case and subsequently applied successfully to the standard
case of IEEE-14 and IEEE-30 test bus systems.
2. PROPOSED METHODOLOGY
The proposed method is based on the principle of physical line flows and the actual line sharing
between the loads. It allocates transmission losses to loads based on the actual power flow in the lossy lines
due to the concerned load. Each lossy line is subdivided into as many sub-lines as corresponding to the
numbers of load attached to it. The tracing of power flow through each sub-line are worked out by using
proportional sharing method. The power loss in each lossy line is equal with the total loss due to all the sub-
lines under it. Then by using Pro-rata for each lossy line, the individual loss for each sub-line can be better
formulated. As the application of Pro-rata is limited to an individual line of the system, so the error in
calculation is minimized. The total loss allocated to a particular load is the sum of losses occurred in each
lossy lines through which the power is flowing to the concerned load. As this method is based on the actual
flow of power in the transmission line corresponding to the concerned load, hence, the loss allocation made
by the method gives proper and justifiable allocations to the different loads which are attached to the system.](https://image.slidesharecdn.com/v0822mar175jun1611443-30203-1-ed-201019055247/75/A-New-Methodology-for-Active-Power-Transmission-Loss-Allocation-in-Deregulated-Power-System-2-2048.jpg)
![IJECE ISSN: 2088-8708
A New Methodology for Active Power Transmission Loss Allocation in …. (Prakash Kumar Hota)
1727
3. APPLICATION OF METHODOLOGY
Considering the fact that T/D loss is attributed to the system‟s active power loss, the loss allocated
to the different loads would be based on the active power utilized by the loads in a system. The application of
proposed methodology to compute the active power loss allocations to different loads in a system is
explained through a flowchart as shown in Figure 1.
From the network topology information, obtain the load flow solution by using any iterative
numerical technique. Compute the active power tracing matrix by using any suitable tracing method.
Formulate the receiving end active powers matrix [PR] and the active losses matrix [PL] of lossy lines from
the data of load flow solutions. Then loss allocations to the different loads will be found out by using the
relation [PLOSS]i=[F]active*([PL]./[PR]) where, * means multiplication.
Figure 1. Flow chart of the proposed approach
4. APPLICATION OF PROPOSED METHOD AND TEST RESULTS
The proposed method is applied elaborately to the six-bus test system in ref. [16]. The results are
compared with the two most commonly used methods such as ITL, Pro rata and the earlier results in ref. [16].
Subsequently, the proposed method is used to find out the loss allocations in IEEE-14 and IEEE-30 bus test
systems.
4.1. Case Study–I (six-bus test system)
A six-bus system with having two voltage-controlled buses and three load buses is shown in
Figure 2. Bus 1 and 2 are two voltage controlled buses and bus 3, 5 and 6 are load buses. Bus 1 is taken as the
slack bus. The bus data, line data and transformer data of the system have been adopted from ref. [16].
Figure 2. Line diagram of six-bus system](https://image.slidesharecdn.com/v0822mar175jun1611443-30203-1-ed-201019055247/75/A-New-Methodology-for-Active-Power-Transmission-Loss-Allocation-in-Deregulated-Power-System-3-2048.jpg)
![ ISSN: 2088-8708
IJECE Vol. 7, No. 4, August 2017 : 1725 – 1737
1728
Table 1. Result of line flows and power loss
Line Receiving end active
power
Active loss
From To PR PL
1 4 48.728 2.524
1 6 41.651 2.842
2 3 15.416 1.768
2 5 29.309 3.508
4 6 9.040 0.104
4 3 39.584 0.000
6 5 0.691 0.000
Total system loss 10.746
It is stated earlier that to apply this method, a solved power flow of the system is needed. A Matlab
program is developed and using the Newton-Raphson method the power flow solutions of the system is
worked out. The results of receiving end active powers and the active power losses are shown in Table 1
above.
4.1.1. Procedure to Formulate Matrix [F]active or [fi,j]active
Matrix [fi,j]active is the contribution of line flows to loads. The number of rows of matrix [fi,j]active
equals with the number of load bus and the number of columns equals with the number of lossy branches of
the system. In this test system, the lossy branches are (1-4), (1-6), (2-3), (2-5), and (4-6). The load buses are
3, 5 and 6. Though different methods are available [9] in power flow tracing to find the contributions of line
flows, here, the proportional sharing method is taken into consideration. The details of this method have been
described below.
4.1.2. Porportional Sharing Method
In the proportional sharing method, it is assumed that power flowing in to the node can be
considered as the proportional sum of the power flowing out of the node. Figure 3 illustrates the method.
Figure 3. Illustration of proportional sharing method
Here „i‟ is taken as the junction node where (j-i), (k-i) are incoming lines and (i-m), (i-l) are
outgoing lines. , are the receiving powers and , are the outgoing powers at node „i‟.
By proportional sharing principle, each outgoing line takes the power from each incoming line in
proportion to its multiplying factor. Now from the above figure, the multiplying factor of line (i-m) = ;
and the multiplying factor of line (i-l) = . As total incoming powers is equal with the total outgoing
powers at a node, so, ) = at the node „i‟. This relation may be used in the above
expressions of calculation of multiplying factors. Thus, contribution of incoming power to the outgoing
line (i-m) = × . Similarly, contribution of incoming power to the outgoing line (i-l) = × .
This is repeated for other lines also.
4.1.3. Implementation of Proportional Sharing Method to Formulate Matrix, [fi,j]active
Step-1:Calculation of multiplying factors of lines and loads by taking active data from the load flow solution.
Step-2:Calculation of power flow contribution of the lossy line to the load.
Step-3:Formation of matrix, [fi,j] by taking the power flow contributions of lossy branches into load buses.](https://image.slidesharecdn.com/v0822mar175jun1611443-30203-1-ed-201019055247/75/A-New-Methodology-for-Active-Power-Transmission-Loss-Allocation-in-Deregulated-Power-System-4-2048.jpg)
![IJECE ISSN: 2088-8708
A New Methodology for Active Power Transmission Loss Allocation in …. (Prakash Kumar Hota)
1729
a. Calculation of Multiplying Factors
While calculating the multiplying factors for the different lines, emphasis must be given to choose
the particular bus which has more than one outgoing lines and simultaneously acting as a mediatory path for
the power flow. In the six-bus system, bus 4 and bus 6 are taken for the calculation of multiplying factors as
shown in Figure 4 and Figure 5, respectively.
Bus 4
Figure 4. Bus-4 for calculation of multiplying factors
Total output = 39.584+9.144 = 48.728
Multiplying factor of (4-3) line = = 0.8123
Multiplying factor of (4-6) line = = 0.1877
Bus 6
Figure 5. Bus-6 for calculation of multiplying factor
Total output = 0.691 + 50 = 50.691
Multiplying factor of (6-5) line = = 0.0136
Multiplying factor of load L6 = = 0.9863
b. Calculation of Power flow Contribution
Now based on the multiplying factors and topology of the system, contributions of different lines
towards the different loads are to be worked out. In six-bus case, the load buses are 3, 5 and 6.
For Load Bus 3
Contribution of (2-3) line = 15.416
Contribution of (1-4) line = 39.584
For Load Bus 5
Contribution of (2-5) line = 29.309
Contribution of (1-6) line = 41.651 0.0136 = 0.566
Contribution of (4-6) line = 9.04 0.0136 = 0.123
Contribution of (1-4) line = 48.728 0.1877 0.0136 = 0.124
For Load Bus 6
Contribution of (1-6) line = 41.651 0.9863 = 41.08
Contribution of (4-6) line = 9.04 0.9863 = 8.916
Contribution of (1-4) line = 48.728 0.1877 0.9863 = 9.02
The contributions of line flows to different loads in the six-bus case are shown in Table 2.
Table 2. Contribution of line flows to loads
Load
Bus
Lossy branch
1-4 1-6 2-3 2-5 4-6
3 39.584 0 15.416 0 0
5 0.124 0.566 0 29.309 0.123
6 9.02 41.08 0 0 8.916
Formation of matrix [F]active
From the data of Table 2, matrix [F]active is formed where rows and columns are listed by lossy
branches (1-4), (1-6), (2-3), (2-5), (4-6) and load buses 3, 5, 6 respectively. Thus,
[F]active = [ ]](https://image.slidesharecdn.com/v0822mar175jun1611443-30203-1-ed-201019055247/75/A-New-Methodology-for-Active-Power-Transmission-Loss-Allocation-in-Deregulated-Power-System-5-2048.jpg)
![ ISSN: 2088-8708
IJECE Vol. 7, No. 4, August 2017 : 1725 – 1737
1730
4.1.4. Computation of Loss Allocation
Loss allocations to different loads has to be computed by using the relation of [PLOSS]i =
[F]active*([PL]. / [PR]), where, [PR] and [PL] are two column matrices. The elements of [PR] and [PL] matrices
correspond to receiving end active powers and active power losses of lossy branches, respectively. Such data
are shown in Table 1.
Thus, [PR] =
[ ]
and [PL] =
[ ]
Now using the relation of [PLOSS]i = [F]active*([PL]. / [PR]), the result obtained as [PLOSS]i = [ ]
This column matrix shows the amount of loss allocations to the load buses 3, 5 and 6 in MW, respectively.
4.1.5. Interpretation of Results
Table 3 shows the allocations of transmission loss to three different loads connected at buses 3, 5
and 6 along with the comparison between the three earlier methods with the proposed one. The result shows a
big difference of loss allocation in particular to the load at bus 5. From the line diagram it is seen that the
load at bus 5 is getting powers from bus 2 and 6. Lossy lines (1-4), (1-6), and (4-6) are partially contributing
powers to load 5 through bus 6, whereas, line (2-5) is exclusively contributing its total power from bus 2 to
load 5. So it is obvious that total loss incurred in line (2-5) and partial losses in other lines must be allocated
to the load at bus 5. But it is verified from the load flow solution in Table 1 that the loss occurred only in the
line of (2-5) is 3.508 MW. So, it justifies that the loss allocation to load at Bus 5 must be higher than this
value. Now in Table 3, it is observed that the loss allocated to load at bus 5 by Pro-Rata and ITL methods are
2.388 MW and 2.300 MW, respectively which are quite below to the actual value. On the other hand, the
other two methods propose the figures as 3.638 MW and 3.5545 MW. This sounds reasonable. Also it is
observed that the total active loss found from the load flow solution is also equal with the total loss allocated
to different loads. Thus, it can be claimed that baring Pro Rata and ITL, the other two methods are more
accurate and its allocation of losses is justifiable. However, the method [16] is not giving suitable results in
the higher order bus systems which are presented hereafter.
Table 3. Comparison of loss allocations between four methods
Load
bus no.
Different Methods
Pro-Rata ITL Method[14] Proposed
3 4.377 4.194 3.853 3.8184
5 2.388 2.300 3.638 3.5545
6 3.979 4.250 3.253 3.3728
Total Loss 10.744 10.7449 10.744 10.7457
4.2. Case Study–II (IEEE-14 bus test system)
In the IEEE-14 bus system as shown in Figure 6, generators are attached into the buses 1 and 2 and
loads are attached to buses 2, 3, 4, 5, 6, 9, 10, 11, 12, 13 and 14. Bus 1 is considered as the slack bus. The
detailed data of this system have been adopted from ref. [10]. Now using Newton-Raphson iterative
technique with programming in Matlab the load flow solution for the system was run and the results of
receiving end active line flows and active power loss are presented in Table 4.](https://image.slidesharecdn.com/v0822mar175jun1611443-30203-1-ed-201019055247/75/A-New-Methodology-for-Active-Power-Transmission-Loss-Allocation-in-Deregulated-Power-System-6-2048.jpg)
![IJECE ISSN: 2088-8708
A New Methodology for Active Power Transmission Loss Allocation in …. (Prakash Kumar Hota)
1731
Table 4. Receiving end active line flows and active power loss of IEEE-14 Bus
Line Receiving end active power Active loss
From To PR PL
1 2 152.705 4.305
1 5 72.676 2.762
2 3 71.035 2.331
2 4 54.406 1.675
2 5 40.616 0.907
4 3 23.191 0.382
5 4 60.991 0.504
4 7 27.973 0.000
4 9 16.003 0.000
5 6 44.278 0.000
6 11 7.398 0.061
6 12 7.751 0.073
6 13 17.609 0.216
7 8 0.047 0.000
7 9 27.946 0.000
9 10 5.144 0.011
9 14 9.210 0.111
11 10 3.876 0.015
12 13 1.649 0.007
13 14 5.661 0.058
Total system loss 13.419
Figure 6. Line diagram of IEEE-14bus test system
4.2.1. Contribution of Active Line Flows
Here, buses 2, 4, 5, 6, 7, 9, 11, 12, and 13 are considered for obtaining multiplying factors and lossy
lines are identified as (1-2), (2-3), (2-4), (1-5), (2-5), (4-3), (5-4), (9-10), (6-11), (6-12), (6-13), (9-14),
(11-10), (12-13), (13-14). Then by adopting the procedure as mentioned above, the calculation for
contribution of active line flows are carried out and presented in Table 5.
4.2.2. Computation of Loss Allocation
Now the receiving end active power matrix, [PR] and active power loss matrix, [PL]are formed by
taking the data from Table 2(a) for the lossy lines (1-2), (2-3), (2-4), (1-5), (2-5), (4-3), (5-4), (9-10), (6-11),
(6-12), (6-13), (9-14), (11-10), (12-13), (13-14). Both are taken as column matrices. Thus, [PR] and [PL] are:
[PR] =[152.705;71.035;54.406;72.676;40.616;23.191;60.991;5.144;7.398;7.781;17.609;9.210;3.876;1.649;
5.661] [PL] = [4.305;2.331;1.675;2.762;0.907;0.382;0.504;0.011;0.061;0.073;0.216;0.111;0.015;0.007;0.058]
Now using the relation of [PLOSS]i = [F]active*([PL]./[PR]), the loss allocation for the different load is
worked out and presented in Table 6 along with the results worked out by the method [16]. Losses are taken
in MW.](https://image.slidesharecdn.com/v0822mar175jun1611443-30203-1-ed-201019055247/75/A-New-Methodology-for-Active-Power-Transmission-Loss-Allocation-in-Deregulated-Power-System-7-2048.jpg)
![ ISSN: 2088-8708
IJECE Vol. 7, No. 4, August 2017 : 1725 – 1737
1732
Table 5. Active power flow tracing of IEEE-14 bus system
Loa
d
bus
Lossy branch
1-2 2-3 2-4 1-5 2-5 4-3 5-4 9-10 6-11 6-12 6-13 9-14 11-
10
12-
13
13-
14
2 17.2 0 0 0 0 0 0 0 0 0 0 0 0 0 0
3 70.857
8
71.03
5
11.098
8
8.035
5
4.49 23.19
1
12.44
2
0 0 0 0 0 0 0 0
4 25.786
3
0 22.524 16.30
7
9.11 0 25.25 0 0 0 0 0 0 0 0
5 2.2 0 0 4.869
2
2.721 0 0 0 0 0 0 0 0 0 0
6 3.22 0 0 7.122 3.98 0 0 0 0 0 0 0 0 0 0
9 15.882
7
0 13.873
5
10.04 5.612 0 15.55
2
0 0 0 0 0 0 0 0
10 3.8826 0 2.3938 4.257
1
2.378
4
0 2.683
6
5.14
4
3.89
8
0 0 0 3.89
8
0 0
11 1.027 0 0 2.271 1.27 0 0 0 3.5 0 0 0 0 0 0
12 1.76 0 0 3.883
6
2.17 0 0 0 0 6.1 0 0 0 0 0
13 3.9648 0 0 8.740
5
4.889
6
0 0 0 0 1.15
9
12.36
1
0 0 1.15
8
0
14 6.6654 0 4.3524 6.865
5
3.835
6
0 4.879
2
0 0 0.49
1
5.247 9.21
0
0 0.49
1
5.66
1
Table 6. Results of loss allocation in IEEE-14 bus system
Load
Bus No.
Methods
Method[16] Proposed
2 0.7225 0.4849
3 5.5261 5.5608
4 2.4245 2.4522
5 0.3085 0.3078
6 0.4630 0.4503
9 1.4883 1.5103
10 0.4779 0.4785
11 0.1747 0.1725
12 0.3037 0.3031
13 0.7297 0.7206
14 0.9439 0.9489
Total 13.5628 13.3899
4.2.3. Interpretation of results of IEEE-14 bus system
It is seen that the total active loss found out by load flow solution as shown in Table 4 is 13.419
MW. This must be equal with the total loss allocations to different loads. But it is observed that the mismatch
of method [16] is 0.1438 and of proposed one is 0.0291. Hence, it justifies that the proposed method gives
better result in the IEEE-14 bus system.
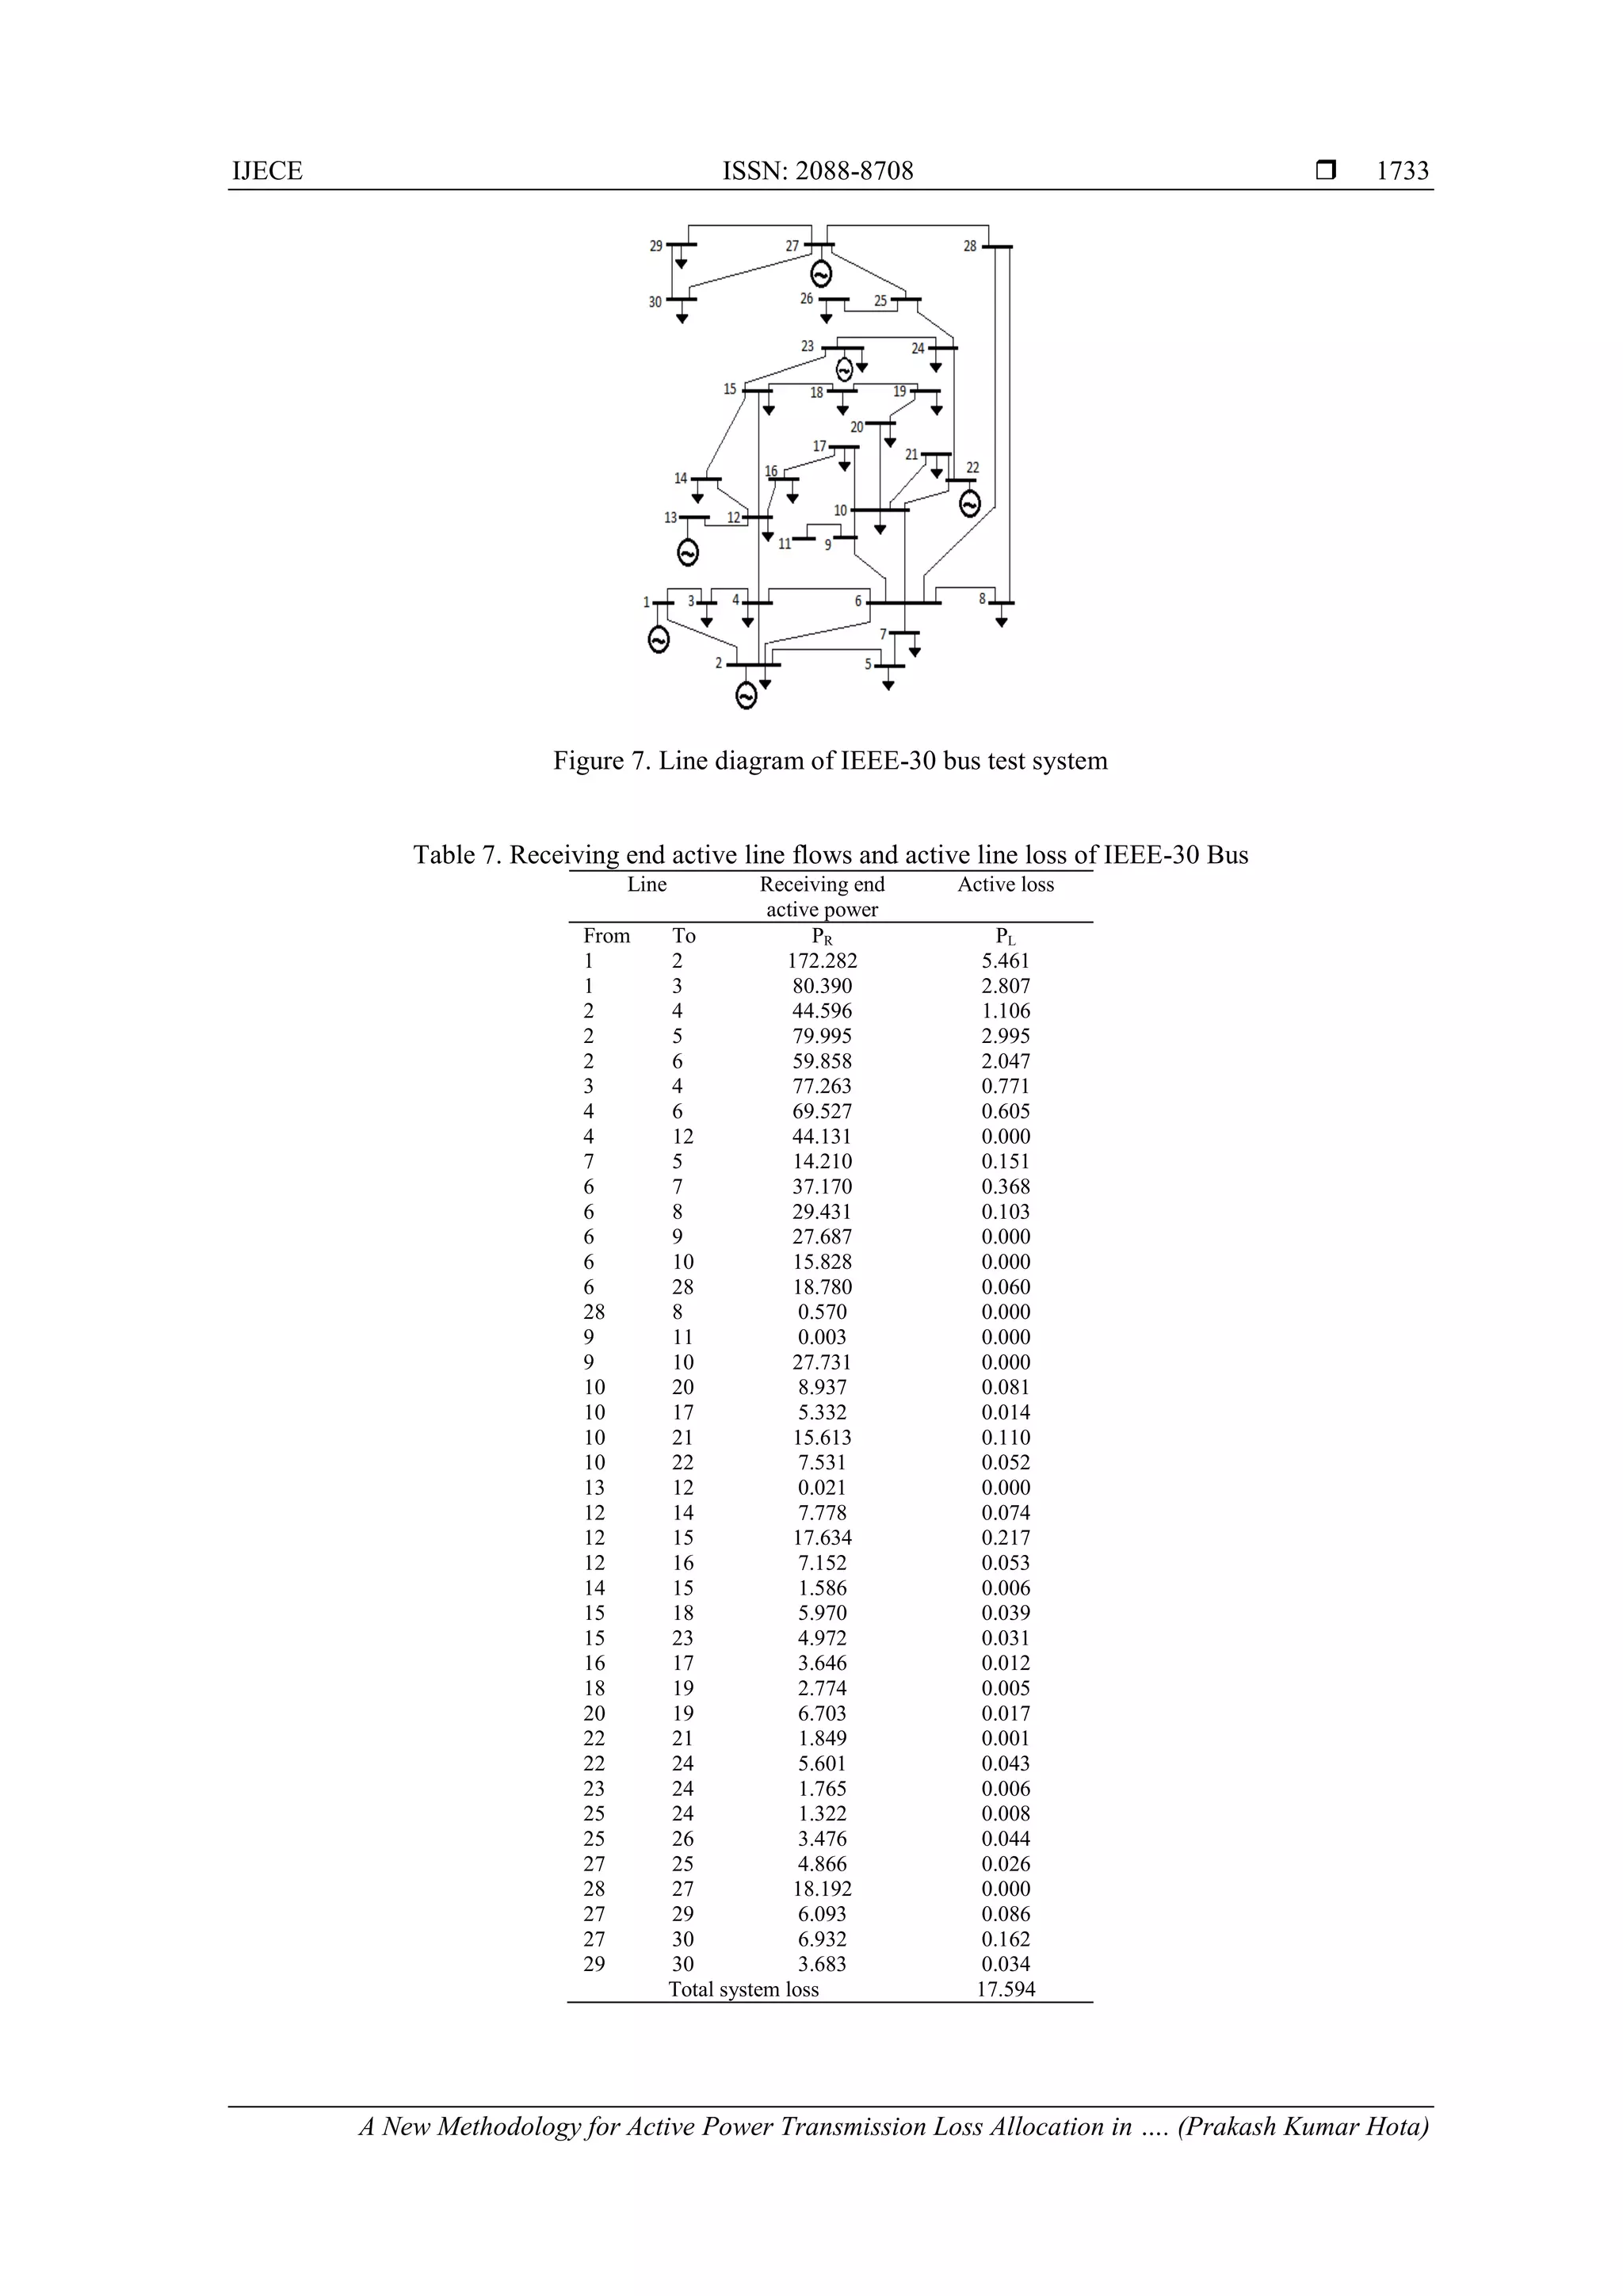
4.3. Case Study–III (IEEE-30 bus test system)
IEEE-30 test bus system having generators attached to buses 1, 2 and loads to 2, 3, 4, 5, 7, 8, 10, 12,
14, 15, 16, 17, 18, 19, 20, 21, 23, 24, 26, 29, 30 is shown in Figure 7. The detailed data of its transformer tap
settings, shunt capacitors, buses and lines have been adopted from ref. [17]. Using Newton-Raphson iterative
technique, the load flow solution for the IEEE-30 bus system was carried out in Matlab programming. The
results of receiving end active line flows and active line losses of different lines are given in Table 7 along
with the total loss of the system.](https://image.slidesharecdn.com/v0822mar175jun1611443-30203-1-ed-201019055247/75/A-New-Methodology-for-Active-Power-Transmission-Loss-Allocation-in-Deregulated-Power-System-8-2048.jpg)
![ ISSN: 2088-8708
IJECE Vol. 7, No. 4, August 2017 : 1725 – 1737
1734
4.3.1. Contribution of Active Line Flows
In this system, buses 2, 3, 4, 6, 7, 9, 10, 12, 14, 15, 16, 18, 20, 22, 23, 25, 27, 28 and 29 are taken for
calculation of multiplying factors. Lines (1-2), (1-3), (2-4), (3-4), (2-5), (2-6), (4-6), (7-5), (6-7), (6-8), (12-
14), (12-15), (12-16), (14-15), (16-17), (15-18), (18-19), (20-19), (10-20), (10-17), (10-21), (10-22), (22-21),
(15-23), (22-24), (23-24), (25-24), (25-26), (27-25), (27-29), (27-30), (29-30) and (6-28) are identified as
lossy lines. By using proportional sharing method and adopting the earlier procedure, the active power
contributions of different lossy lines to loads are worked out. With respect to the load buses 2, 3, 4, 5, 7, 8,
10, 12, 14, 15, 16, 17, 18, 19, 20, 21, 23, 24, 26, 29 and 30; Tables 3(b) and 3(c) show the contributions of
lossy lines (1-2), (1-3), (2-4), (3-4), (2-5), (2-6), (4-6), (7-5), (6-7), (6-8), (12-14), (12-15), (12-16), (14-15),
(16-17),(15-18), (18-19) and (20-19), (10-20), (10-17), (10-21), (10-22), (22-21), (15-23), (22-24), (23-24),
(25-24), (25-26), (27-25), (27-29), (27-30), (29-30), (6-28), respectively. It is to be noted here that due to
insufficient space for presenting the contribution of line flows in one table, the results are tabulated in two
tables, from line (1-2) to line (18-19) in Table 8 and from line (20-19) to line (6-28) in Table 9. These results
constitute active power tracing matrix [F]active.
Table 8. Contribution of active line flows to loads in IEEE-30 bus sysem for line (1-2) to line (18-19)
Load
bus
Lossy branch
1-2 1-3 2-4 3-4 2-5 2-6 4-6 7-5 6-7 6-8 12-
14
12-
15
12-
16
14-
15
16-
17
15-
18
18-
19
2 17.57
3
0 0 0 0 0 0 0 0 0 0 0 0 0 0 0 0
3 0 2.39
56
0 0 0 0 0 0 0 0 0 0 0 0 0 0 0
4 2.311
3
4.86
58
2.78
279
4.82
12
0 0 0 0 0 0 0 0 0 0 0 0 0
5 75.20
93
5.02
8
2.87
54
4.98
17
79.
995
6.7 7.78
3
14.
21
14.
348
0 0 0 0 0 0 0 0
7 12.73
58
7.98
5
4.56
64
7.91
14
0 10.6
41
12.3
6
0 22.
785
0 0 0 0 0 0 0 0
8 16.33
43
10.2
412
5.85
67
10.1
468
0 13.6
476
15.8
522
0 0 29.
431
0 0 0 0 0 0 0
10 3.209
5
2.01
23
1.15
08
1.99
38
0 2.68
16
3.11
481
0 0 0 0 0 0 0 0 0 0
12 3.404
1
7.16
64
4.09
85
7.10
07
0 0 0 0 0 0 0 0 0 0 0 0 0
14 1.887
2
3.97
31
2.27
22
3.93
66
0 0 0 0 0 0 6.1
913
0 0 0 0 0 0
15 2.523
7
5.31
29
3.03
84
5.26
41
0 0 0 0 0 0 0.6
773
7.5
297
0 0.6
772
0 0 0
16 1.081
8
2.27
75
1.30
25
2.25
66
0 0 0 0 0 0 0 0 3.5
045
0 0 0 0
17 4.087 4.23
03
2.41
93
4.19
143
0 2.47
21
2.87
15
0 0 0 0 0 3.6
548
0 3.6
46
0 0
18 0.989
8
2.08
37
1.19
17
2.06
46
0 0 0 0 0 0 0.2
656
2.9
531
0 0.2
656
0 3.19
395
0
19 4.618
4
4.16
46
2.38
17
4.12
63
0 3.14
15
3.64
9
0 0 0 0.2
304
2.5
612
0 0.2
304
0 2.77
01
2.7
74
20 1.231
8
0.77
23
0.44
17
0.76
52
0 1.02
92
1.19
54
0 0 0 0 0 0 0 0 0 0
21 9.789
5
6.13
79
3.51
02
6.08
14
0 8.17
94
9.50
07
0 0 0 0 0 0 0 0 0 0
23 0.989
1
2.08
23
1.19
09
2.06
32
0 0 0 0 0 0 0.2
655
2.9
513
0 0.2
654
0 0 0
24 4.48 3.61
8
2.06
91
3.58
48
0 3.28
57
3.81
65
0 0 0 0.1
469
1.6
335
0 0.1
469
0 0 0
26 2.042 1.28 0.73
21
1.26
835
0 1.70
595
1.98
15
0 0 0 0 0 0 0 0 0 0
29 1.390
6
0.87
168
0.49
85
0.86
37
0 1.16
17
1.34
94
0 0 0 0 0 0 0 0 0 0
30 6.227
6
3.90
37
2.23
24
3.86
79
0 5.20
24
6.04
31
0 0 0 0 0 0 0 0 0 0](https://image.slidesharecdn.com/v0822mar175jun1611443-30203-1-ed-201019055247/75/A-New-Methodology-for-Active-Power-Transmission-Loss-Allocation-in-Deregulated-Power-System-10-2048.jpg)
![IJECE ISSN: 2088-8708
A New Methodology for Active Power Transmission Loss Allocation in …. (Prakash Kumar Hota)
1735
Table 9. Contribution of active line flows to loads in IEEE-30 bus sysem for line (20-19) to line (6-28)
Load
bus
LOSSY BRANCH
20-
19
10-20 10-17 10-
21
10-22 22-
21
15-
23
22-
24
23-
24
25-
24
25-26 27-
25
27-
29
27-
30
29-
30
6-28
2 0 0 0 0 0 0 0 0 0 0 0 0 0 0 0 0
3 0 0 0 0 0 0 0 0 0 0 0 0 0 0 0 0
4 0 0 0 0 0 0 0 0 0 0 0 0 0 0 0 0
5 0 0 0 0 0 0 0 0 0 0 0 0 0 0 0 0
7 0 0 0 0 0 0 0 0 0 0 0 0 0 0 0 0
8 0 0 0 0 0 0 0 0 0 0 0 0 0 0 0 0
10 0 0 0 0 0 0 0 0 0 0 0 0 0 0 0 0
12 0 0 0 0 0 0 0 0 0 0 0 0 0 0 0 0
14 0 0 0 0 0 0 0 0 0 0 0 0 0 0 0 0
15 0 0 0 0 0 0 0 0 0 0 0 0 0 0 0 0
16 0 0 0 0 0 0 0 0 0 0 0 0 0 0 0 0
17 0 0 5.332 0 0 0 0 0 0 0 0 0 0 0 0 0
18 0 0 0 0 0 0 0 0 0 0 0 0 0 0 0 0
19 6.7
03
6.729
6
0 0 0 0 0 0 0 0 0 0 0 0 0 0
20 0 2.204
8
0 0 0 0 0 0 0 0 0 0 0 0 0 0
21 0 0 0 15.6
13
1.882
8
1.8
49
0 0 0 0 0 0 0 0 0 0
23 0 0 0 0 0 0 3.2 0 0 0 0 0 0 0 0 0
24 0 0 0 0 5.670
8
0 1.77
12
5.6
01
1.7
65
1.32
2
0 1.3
343
0 0 0 1.390
4
26 0 0 0 0 0 0 0 0 0 0 3.476 3.5
327
0 0 0 3.681
2
29 0 0 0 0 0 0 0 0 0 0 0 0 2.39
1
0 0 2.506
9
30 0 0 0 0 0 0 0 0 0 0 0 0 3.70
22
6.9
32
3.6
83
11.22
68
4.3.2. Computation of Loss Allocation
Receiving end active power matrix, [PR] and active power loss matrix, [PL] have been formulated
by taking the data from Table 8 for the lossy lines (1-2), (1-3), (2-4), (3-4), (2-5), (2-6), (4-6), (7-5), (6-7),
(6-8), (12-14), (12-15), (12-16), (14-15), (16-17), (15-18), (18-19), (20-19), (10-20), (10-17), (10-21), (10-
22), (22-21), (15-23), (22-24), (23-24), (25-24), (25-26), (27-25), (27-29), (27-30), (29-30) and (6-28). Both
[PR] and [PL] are column matrices and whose values are given below.
[PR] =
[172.282;80.39;44.596;77.263;79.995;59.858;69.527;14.210;37.170;29.431;7.778;17.634;7.152;1.586;3.646;
5.970;2.774;6.703;8.937;5.332;15.613;7.531;1.849;4.972;5.601;1.765;1.322;3.476;4.866;6.093;6.932;3.683;
18.780]
[PL] =
[5.461;2.807;1.106;0.771;2.995;2.047;0.605;0.151;0.368;0.103;0.074;0.217;0.053;0.006;0.012;0.039;0.005;
0.017;0.081;0.014;0.110;0.052;0.001;0.031;0.043;0.006;0.008;0.044;0.026;0.086;0.162;0.034;0.06]
Using the relation of [PLOSS]i = [F]active*([PL]./[PR]); the loss allocation to all the load buses have
been calculated and presented in Table 10. Loss allocation by the method [16] has also been given for a
comparative study. All the loss values are taken in MW.
4.3.3. Interpretation of Results of IEEE-30 bus System
It is seen from Table 7 that the total active loss in IEEE-30 bus system is 17.594 MW. Now from
Table 10, it is found out that the total allocated loss by method [16] is 22.2564 MW and by the proposed
method is 17.5901 MW. As the total allocated loss to all the load buses cannot be more than the system loss,
hence the proposed method sounds reasonable.](https://image.slidesharecdn.com/v0822mar175jun1611443-30203-1-ed-201019055247/75/A-New-Methodology-for-Active-Power-Transmission-Loss-Allocation-in-Deregulated-Power-System-11-2048.jpg)
![ ISSN: 2088-8708
IJECE Vol. 7, No. 4, August 2017 : 1725 – 1737
1736
Table 10. Results of loss allocations in IEEE-30 bus system
Load
Bus No.
Methods Load
Bus No.Method[16] Proposed Method[16] Proposed
2 1.1323 0.5570 18 0.2038 0.2150
3 0.0965 0.0836 19 0.6947 0.6669
4 0.3878 0.3603 20 0.1707 0.1502
5 7.3572 6.2655 21 1.6770 1.1588
7 2.5037 1.5717 23 0.2149 0.2140
8 2.0083 1.8647 24 0.9136 0.6391
10 0.4204 0.3392 26 0.6456 0.2832
12 0.7470 0.5306 29 0.2970 0.1843
14 0.3579 0.3531 30 1.0637 0.9215
15 0.4913 0.4951 Total 22.2564 17.5901
16 0.2216 0.1946
17 0.6514 0.5417
5. CONCLUSION
The proposed method allocates transmission losses to loads based on the actual power flow in the
lossy lines due to the concerned load. Each lossy line is subdivided into as many sub-lines as corresponding
to the numbers of load attached to it. The tracing of power flow through each sub-line is worked out by using
proportional sharing method. The power loss in each lossy line is equal with the total loss due to all the sub-
lines under it. Then by using Pro-rata for each lossy line, the individual loss for each sub-line is formulated.
As the application of Pro-rata is limited to an individual line of the system, so the error in calculation is
minimized. The total loss allocated to a particular load is the sum of losses occurred in each lossy lines
through which the power is flowing to the concerned load. Loss allocation based on the actual line flow of a
system gives more justification to the load bus connected into it. As the tariff rates are mainly dependent on
active power supply and active loss, hence emphasis has been given more on active power calculation.
Instead of going into a complicated calculation, the process is developed in a simple manner with giving due
weightage to the physical flow of power to the load in a system. The results obtained in six-bus system justify
the logic and exposes the error produced by the two widely used methods namely Pro-rata and ITL. In
dealing with the higher order bus system, the method also gives a fair approach to transmission loss
allocation.
ACKNOWLEDGEMENTS
The support from the Electrical Engineering Department of Veer Surendra Sai University of
Technology, Burla, India, extended to the authors for the work reported in this paper is gratefully
acknowledged.
REFERENCES
[1] S. M. Myint, S. W. Naing, “Network Reconfiguration for Loss Reduction and Voltage Profile Improvement of 110-
bus Radial Distribution System using Exhaustive Search Techniques”, International Journal of Electrical &
Computer Engineering (IJECE), Vol.5, No.4, August-2015, pp.788-797.
[2] S. Hlaing, P. L. Swe, “Loss Minimization of Power Distribution Network using different Types of Generation
unit”, International Journal of Electrical & Computer Engineering (IJECE), vol.5, no.5, October-2015,
pp.918-928.
[3] A. J. Canejo, J. M. Arroyo, N. Alguacil, A. L. Guijarro, “Transmission Loss Allocation: A Comparison of different
Practical Algorithms”, IEEE Trans. on Power Syst., vol. 17, August-2002, pp.571-576.
[4] M. Y. Hassan, M. A. Almaktar, M. P. Abdullah, F. Hussin, M. S. Majid, H. A. Rahman, “Assessment of
Transmission Loss Allocation Algorithms in Deregulated Power System”, International Review of Electrical
Engineering (I.R.E.E.), vol.7, no.2, March-April 2012, pp.4065-4076.
[5] A. G. Exposito, J. M. R. Santos, T.G.Garcia, E.R.Velasco, “Fair Allocation of Transmission Power Losses”, IEEE
Trans. on Power Syst., vol. 15, February-2000, pp.184-188.
[6] G.Strbac, D. Kirschen, S. Ahmed, “Allocating Transmission System usage on the Basis of Traceable Contributions
of Generators and Loads to Flows”, IEEE Trans. on Power Syst., vol. 13, May-1998, pp. 527-534.
[7] J. W. Bailek, “Topological Generation and Load Distribution Factors for Supplement Charge Allocation in
Transmission Open Access”, IEEE Trans. on Power Syst., vol. 12, August-1996, pp.1387-1392.
[8] D. Kirschen, G. Strbac, “Tracing Active and Reactive Power between Generators and Loads using Real and
Imaginary Currents”, IEEE Trans. on Power Syst., vol. 14, no. 4, November-1999, pp. 1312-1319.](https://image.slidesharecdn.com/v0822mar175jun1611443-30203-1-ed-201019055247/75/A-New-Methodology-for-Active-Power-Transmission-Loss-Allocation-in-Deregulated-Power-System-12-2048.jpg)
![IJECE ISSN: 2088-8708
A New Methodology for Active Power Transmission Loss Allocation in …. (Prakash Kumar Hota)
1737
[9] A. J. Canejo, F. D. Galiana, I. Kockar, “Z-buss Loss Allocation”, IEEE Trans. on Power Syst., vol. 16, no. 1,
February-2001, pp. 105-110.
[10] A. Canejo, N. Alguacil, G. F. Ruiz, “Allocation of the Cost of Transmission Losses using a Radial Equivalent
Network”, IEEE Trans. on Power Syst., vol. 18, November-2003, pp. 1353-1358.
[11] J. S. Savier, D. Das, “An Exact Method for Loss Allocation in Radial Distribution Systems”, Electrical Power and
Energy Systems, vol. 36, 2012, pp. 100-106.
[12] G.Gross, S.Tao, “A Physical-flow-based Approach to Allocating Transmission Losses in a Transaction
Framework”, IEEE Trans. on Power Syst., vol. 15, no. 2, May-2000, pp. 631-637.
[13] “Power and Communications,” World Bank Report, 2013.
[14] “Eleventh Five Year Plan, 2007-12, Inclusive Growth”, Vol.I, Government of India.
[15] H. Zein, E. Dermawan, “Cost Allocation of Transmission Losses in Electric Market Mechanism”, TELKOMNIKA,
Indonesian Journal of Electrical Engineering, Vol.10, No.2, June-2012, pp.211-218.
[16] S. Abdelkader, “Transmission Loss Allocation in a Deregulated Electrical Energy Market”, Electric Power Systems
Research, vol. 76, 2006, pp. 962–967.
[17] Hadi Saadat, “Power System Analysis”, Tata McGraw-Hill, New Delhi, Edition-2002, Reprint-2006.
BIOGRAPHIES OF AUTHORS
Prakash Kumar Hota was born in 1963 in India. He has graduated in Electrical and Electronics
Engineering from the National Institute of Technology (NIT), Tiruchirapalli, India in 1985,
received his M.Tech in Industrial Power Control & Electric Drives in 1992 from Sambalpur
University, India and Ph.D in Electrical Engineering from Jadavpur University, Kolkata, India in
1999. Currently, he is a Professor of Electrical Engineering and Dean of Centre for Distance and
Continuing Education (CDCE) at Veer Surendra Sai University of Technology (VSSUT), Burla,
India. His research interests include Economic Emission Load Dispatch, Hydrothermal
Scheduling, Hybrid Power Generation Systems, Power Quality and Soft Computing applications to
different Power System Problems in Deregulated Environment.
Atulya Prasad Naik was born in Odisha, India in 1968. He has graduated in Electrical
Engineering from Institution of Engineers (India) in 1992 and received his M.Tech in Power
System from National Institute of Technology (NIT), Jamshedpur (Formerly, RIT Jamshedpur) in
2002. He is a Ph.D research scholar at ITER, SOA University, Bhubaneswar, India. Currently, he
is an Assistant Professor of Electrical Engineering and Head of the Computer Centre at Bhadrak
Institute of Engineering and Technology, Bhadrak under BPUT, Rourkela, India. His research
interests include Loss Allocation and Minimisation, Power factor Improvement, Voltage Control,
Economic Operation and Planning of Electrical Power Systems in the arena of Deregulated Power
System.](https://image.slidesharecdn.com/v0822mar175jun1611443-30203-1-ed-201019055247/75/A-New-Methodology-for-Active-Power-Transmission-Loss-Allocation-in-Deregulated-Power-System-13-2048.jpg)