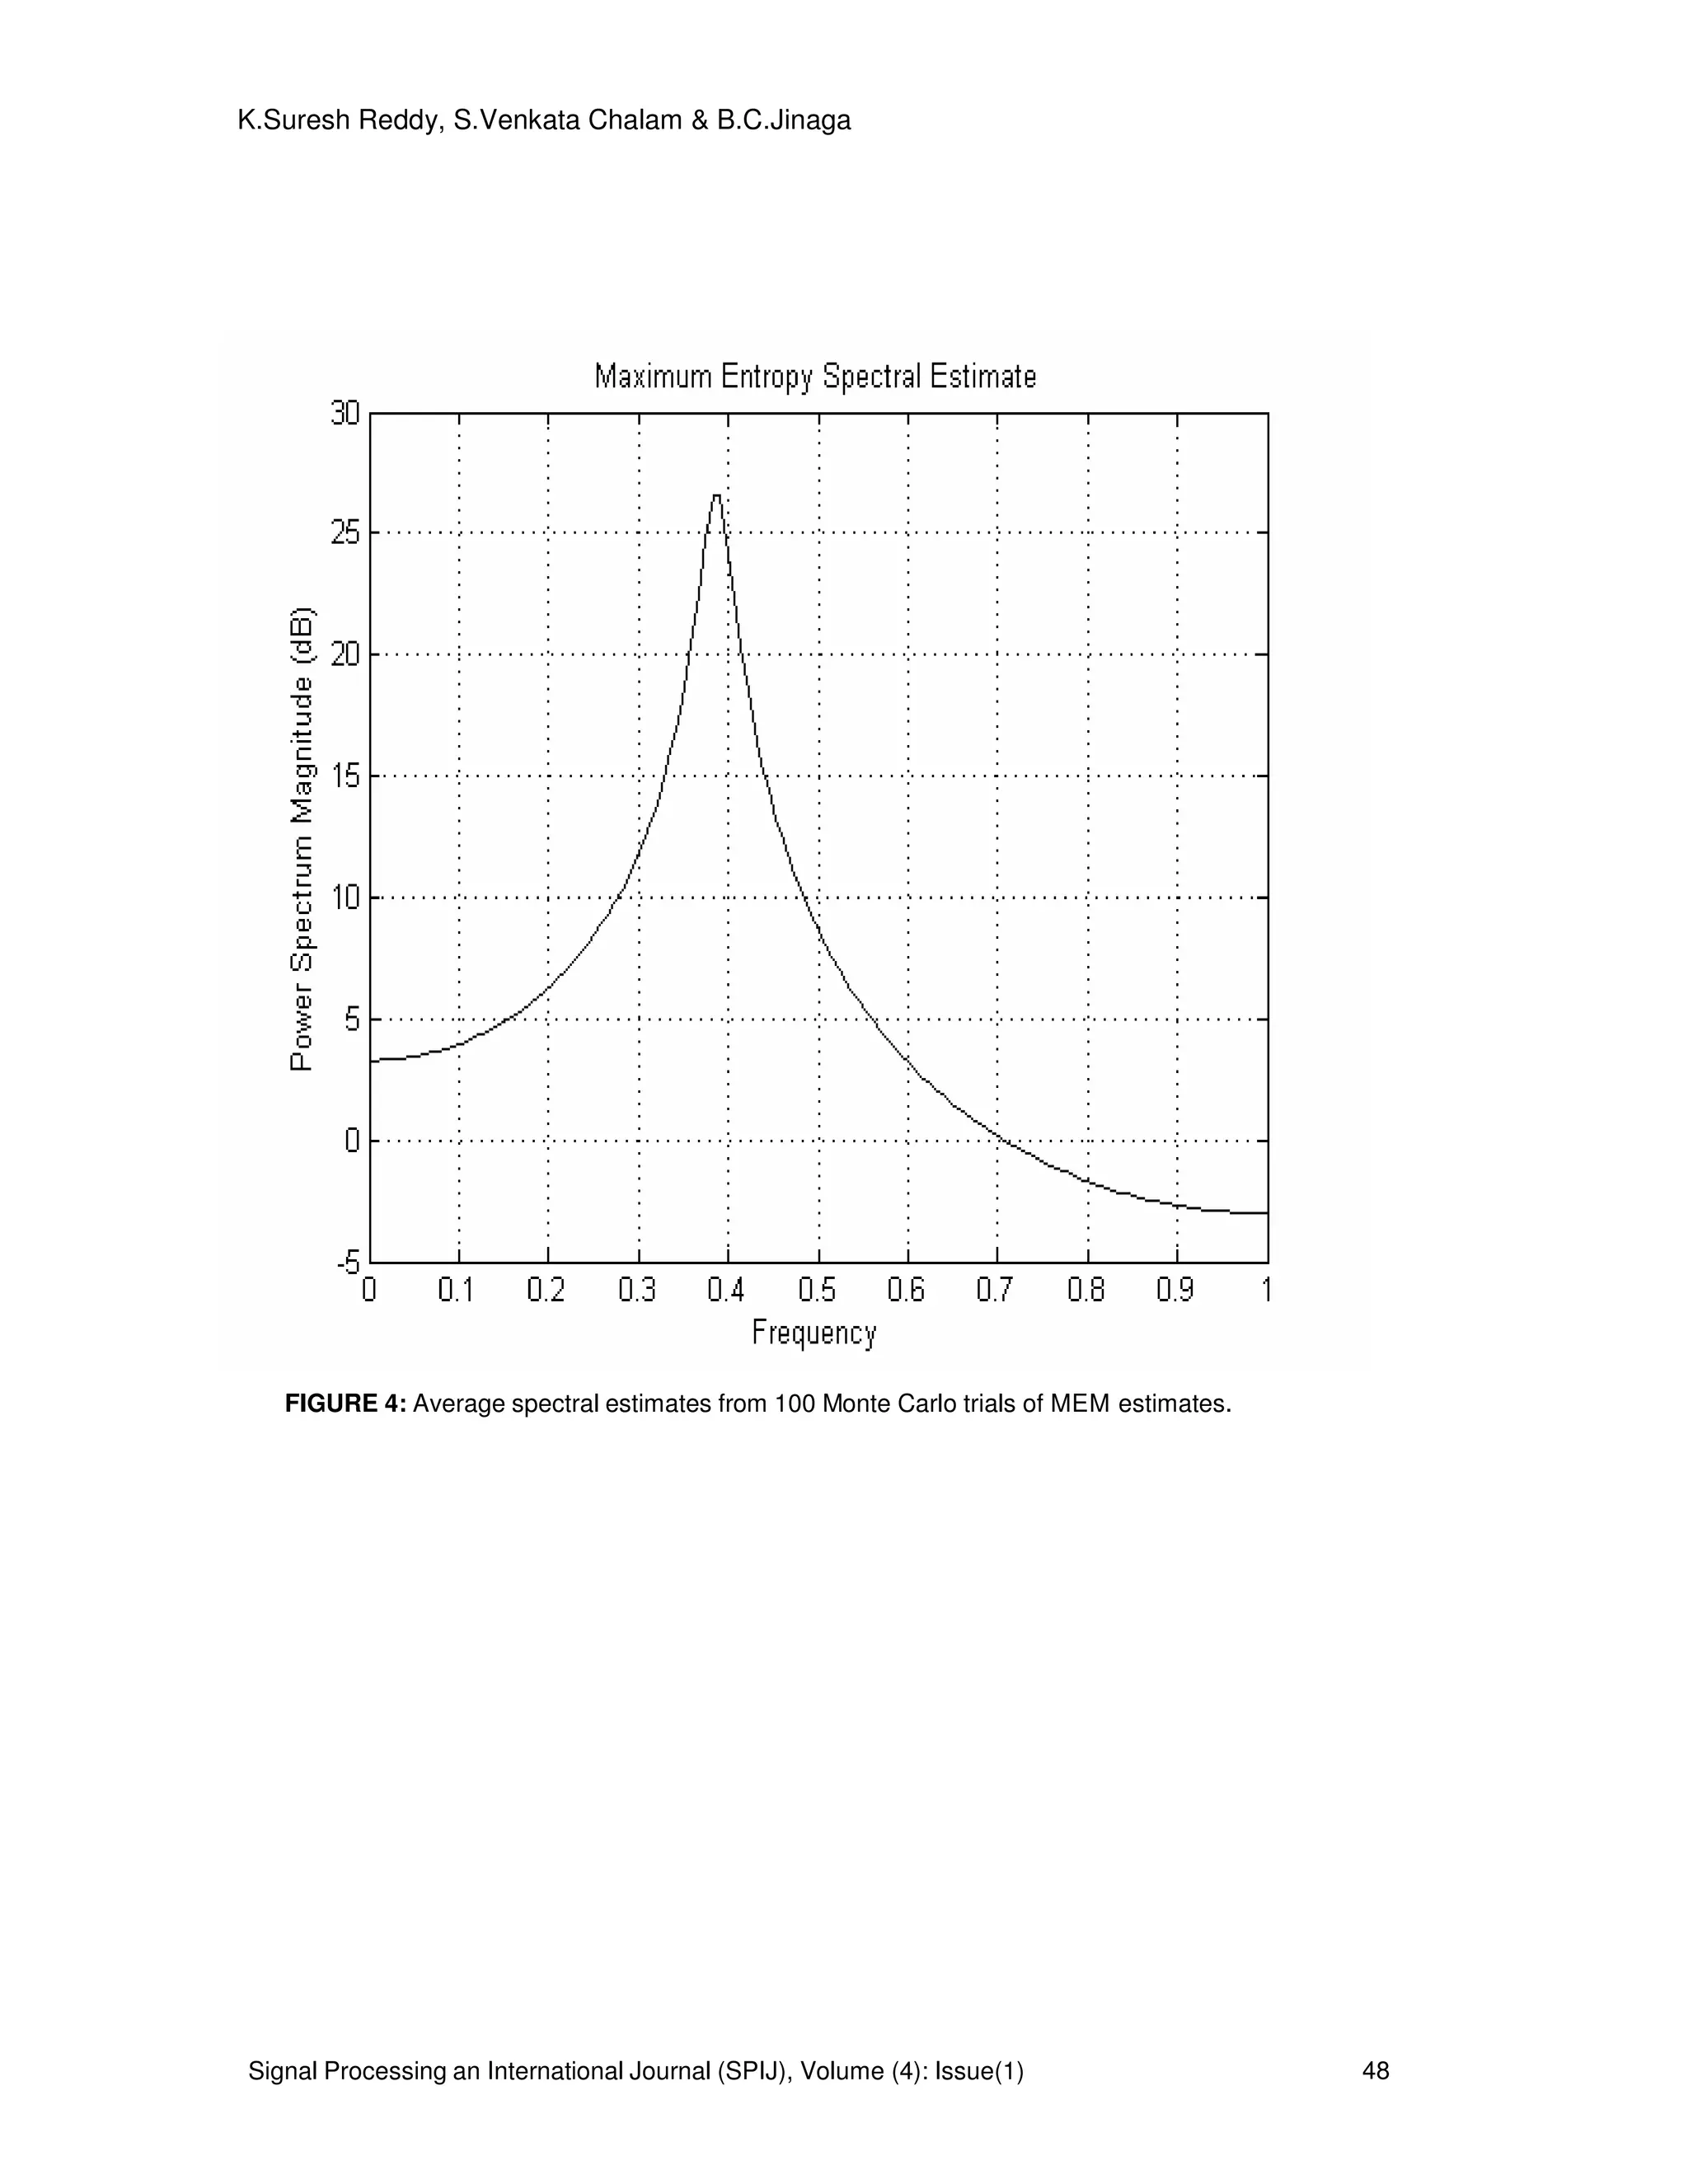
The spectral analysis of non uniform sampled data sequences using Fourier Periodogram method is the classical approach. In view of data fitting and computational standpoints why the Least squares periodogram(LSP) method is preferable than the “classical” Fourier periodogram and as well as to the frequently-used form of LSP due to Lomb and Scargle is explained. Then a new method of spectral analysis of nonuniform data sequences can be interpreted as an iteratively weighted LSP that makes use of a data-dependent weighting matrix built from the most recent spectral estimate. It is iterative and it makes use of an adaptive (i.e., data-dependent) weighting, we refer to it as the iterative adaptive approach (IAA).LSP and IAA are nonparametric methods that can be used for the spectral analysis of general data sequences with both continuous and discrete spectra. However, they are most suitable for data sequences with discrete spectra (i.e., sinusoidal data), which is the case we emphasize in this paper. Of the existing methods for nonuniform sinusoidal data, Welch, MUSIC and ESPRIT methods appear to be the closest in spirit to the IAA proposed here. Indeed, all these methods make use of the estimated covariance matrix that is computed in the first iteration of IAA from LSP. MUSIC and ESPRIT, on the other hand, are parametric methods that require a guess of the number of sinusoidal components present in the data, otherwise they cannot be used; furthermore.
This document provides an overview of spectral clustering. It begins with a review of clustering and introduces the similarity graph and graph Laplacian. It then describes the spectral clustering algorithm and interpretations from the perspectives of graph cuts, random walks, and perturbation theory. Practical details like constructing the similarity graph, computing eigenvectors, choosing the number of clusters, and which graph Laplacian to use are also discussed. The document aims to explain the mathematical foundations and intuitions behind spectral clustering.
On a Deterministic Property of the Category of k-almost Primes: A Determinist...Ramin (A.) Zahedi
In this paper based on a sort of linear function, a deterministic and simple algorithm with an algebraic structure is presented for calculating all (and only) k-almost primes (where ∃n∊ℕ, 1 ≤ k ≤ n) in certain intervals. A theorem has been proven showing a new deterministic property of the category of k-almost primes. Through a linear function that we obtain, an equivalent redefinition of the k-almost primes with an algebraic characteristic is identified. Moreover, as an outcome of our function’s property some equalities which contain new information about the k-almost primes (including primes) are presented.
Comments: Accepted and presented article in the 11th ANTS , Korea, 2014. The 11th ANTS is one of international satellite conferences of ICM 2014:The 27th International Congress of Mathematicians, Korea. (Expanded version)
Copyright: CC Attribution-NonCommercial-NoDerivs 4.0 International
License URL: https://creativecommons.org/licenses/by-nc-nd/4.0/
Spectral clustering is a technique for clustering data points into groups using the spectrum (eigenvalues and eigenvectors) of the similarity matrix of the points. It works by constructing a graph from the pairwise similarities of points, calculating the Laplacian of the graph, and using the k eigenvectors of the Laplacian corresponding to the smallest eigenvalues to embed the points into a k-dimensional space. K-means clustering is then applied to the embedded points to obtain the final clustering. The document discusses two basic spectral clustering algorithms that differ in whether they use the normalized or unnormalized Laplacian.
HEATED WIND PARTICLE’S BEHAVIOURAL STUDY BY THE CONTINUOUS WAVELET TRANSFORM ...cscpconf
Nowadays Continuous Wavelet Transform (CWT) as well as Fractal analysis is generally used for the Signal and Image processing application purpose. Our current work extends the field of application in case of CWT as well as Fractal analysis by applying it in case of the agitated wind particle’s behavioral study. In this current work in case of the agitated wind particle, we have mathematically showed that the wind particle’s movement exhibits the “Uncorrelated” characteristics during the convectional flow of it. It is also demonstrated here by the Continuous Wavelet Transform (CWT) as well as the Fractal analysis with matlab 7.12 version
Density based Clustering finds clusters of arbitrary shape by looking for dense regions of points separated by low density regions. It includes DBSCAN, which defines clusters based on core points that have many nearby neighbors and border points near core points. DBSCAN has parameters for neighborhood size and minimum points. OPTICS is a density based algorithm that computes an ordering of all objects and their reachability distances without fixing parameters.
This paper presents an interesting idea how to compute a consensus of several k-partitions of a set by means of finding an antichain in the concept lattice of an appropriate formal context.
CVPR2010: Advanced ITinCVPR in a Nutshell: part 6: Mixtureszukun
1. Gaussian mixtures are commonly used in computer vision and pattern recognition tasks like classification, segmentation, and probability density function estimation.
2. The document reviews Gaussian mixtures, which model a probability distribution as a weighted sum of Gaussian distributions. It discusses estimating Gaussian mixture models with the EM algorithm and techniques for model order selection like minimum description length and Gaussian deficiency.
3. Gaussian mixtures can model images and perform color-based segmentation. The EM algorithm is used to estimate the parameters of Gaussian mixtures by alternating between expectation and maximization steps.
This summary provides the key details from the document in 3 sentences:
The document presents a new iterative method (M2 method) for determining the exact solution to a parametric linear programming problem where the objective function and constraints contain parameters. The M2 method exploits the concept of a p-solution to a square linear interval parametric system and iteratively reduces the parameter domain while maintaining upper and lower bounds on the optimal objective value. A numerical example is given to illustrate the new iterative approach for solving parametric linear programming problems.
This document discusses energy detection of unknown signals in fading environments. It proposes modeling the received signal power distribution under combined slow and fast fading. This allows deriving the distribution of the detector's decision variable in closed form. Specifically:
1) It models the received signal as the sum of the signal and noise, scaled by a complex channel amplitude representing fast and slow fading.
2) It derives an expression for the sufficient statistic at the detector's output and simplifies it under assumptions of high sample numbers and independent samples.
3) It expresses the distribution of the decision variable as an integral of the distribution for a fixed SNR, averaged over the SNR distribution due to fading.
4) It provides the specific
icml2004 tutorial on spectral clustering part Izukun
This document provides a tutorial on spectral clustering. It discusses the history and foundations of spectral clustering including graph partitioning, ratio cut, normalized cut and minmax cut objectives. It also covers properties of the graph Laplacian matrix and how to recover partitions from eigenvectors. The document compares different clustering objectives and shows their performance on example datasets. Finally, it discusses extensions of spectral clustering to bipartite graphs.
icml2004 tutorial on spectral clustering part IIzukun
This document provides an overview of advanced and related topics in spectral clustering. It discusses spectral embedding which shows that clusters aggregate to distinct centroids in the embedded space, forming a simplex structure. It also covers perturbation analysis which treats small between-cluster connections as perturbations. Additionally, it shows the equivalence between K-means clustering and PCA in the embedded spectral space.
This document summarizes a paper that analyzes compressive sampling (CS) for compressing and reconstructing electrocardiogram (ECG) signals using l1 minimization algorithms. It proposes remodeling the linear program problem into a second order cone program to improve performance metrics like percent root-mean-squared difference, compression ratio, and signal-to-noise ratio when reconstructing ECG signals from the PhysioNet database. The paper provides an overview of CS theory and l1 minimization algorithms, describes the proposed approach of using quadratic constraints, and defines performance metrics for analyzing reconstructed ECG signals.
The partitioning of an ordered prognostic factor is important in order to obtain several groups having heterogeneous survivals in medical research. For this purpose, a binary split has often been used once or recursively. We propose the use of a multi-way split in order to afford an optimal set of cut-off points. In practice, the number of groups ($K$) may not be specified in advance. Thus, we also suggest finding an optimal $K$ by a resampling technique. The algorithm was implemented into an \proglang{R} package that we called \pkg{kaps}, which can be used conveniently and freely. It was illustrated with a toy dataset, and was also applied to a real data set of colorectal cancer cases from the Surveillance Epidemiology and End Results.
Cubic convolution interpolation is a new technique for resampling discrete data that has several desirable features for image processing. It can be performed efficiently on a digital computer. The cubic convolution interpolation function converges uniformly to the function being interpolated as the sampling increment approaches zero, achieving third-order accuracy. The paper derives the one-dimensional cubic convolution interpolation function and shows how it can be extended separably to two dimensions for interpolating image data.
This document provides an overview of higher dimensional theories and their connection to lower dimensional theories through renormalization group flows and fixed points. It discusses the Banks-Zaks fixed point of QCD specifically. Perturbative fixed points in higher dimensions are connected to non-perturbative fixed points in lower dimensions, allowing access to these non-perturbative regimes. As an example, it examines the O(N)×O(m) Landau-Ginzburg-Wilson model in 6-2 dimensions and calculates critical exponents to show universality between this theory and the 4D model. It also shows that critical exponents in QCD are renormalization scheme independent by calculating them to high loops in different schemes.
K-Sort: A New Sorting Algorithm that Beats Heap Sort for n 70 Lakhs!idescitation
Sundararajan and Chakraborty [10] introduced a new
version of Quick sort removing the interchanges. Khreisat
[6] found this algorithm to be competing well with some other
versions of Quick sort. However, it uses an auxiliary array
thereby increasing the space complexity. Here, we provide a
second version of our new sort where we have removed the
auxiliary array. This second improved version of the algorithm,
which we call K-sort, is found to sort elements faster than
Heap sort for an appreciably large array size (n 70,00,000)
for uniform U[0, 1] inputs.
This document contains a summary of a lecture on graph analytics and complexity by Dr. Animesh Chaturvedi. It includes questions and answers on graph algorithms like minimum spanning tree (MST), single-source shortest path (SSSP) problems, and the Agrawal–Kayal–Saxena primality test. Sample algorithms are provided to calculate the average MST and average SSP of multiple graphs by combining the graphs and running standard algorithms. The document is in English and other languages with thank you messages at the end.
This document discusses stability estimates for identifying point sources using measurements from the Helmholtz equation. It begins by introducing the inverse problem of determining source terms from boundary measurements of the electromagnetic field. It then proves identifiability, showing that a single boundary measurement can uniquely determine the sources. Next, it establishes a local Lipschitz stability result, demonstrating continuous dependence of the sources on the measurements. Finally, it proposes a numerical inversion algorithm using a reciprocity gap concept to quickly and stably identify multiple sources.
This document proposes an improved particle swarm optimization (PSO) algorithm for data clustering that incorporates Gauss chaotic map. PSO is often prone to premature convergence, so the proposed method uses Gauss chaotic map to generate random sequences that substitute the random parameters in PSO, providing more exploration of the search space. The algorithm is tested on six real-world datasets and shown to outperform K-means, standard PSO, and other hybrid clustering algorithms. The key aspects of the proposed GaussPSO method and experimental results demonstrating its effectiveness are described.
A common fixed point theorem for two random operators using random mann itera...Alexander Decker
This academic article presents a common fixed point theorem for two random operators using a random Mann iteration scheme. It proves that if a sequence defined by the random Mann iteration of two random operators converges, then the limit point is a common fixed point of the two operators. The paper defines relevant concepts such as random operators and random fixed points. It then presents the main theorem and proof that under a contractive condition, the limit of the random Mann iteration is a common fixed point. The proof uses properties of measurable mappings and the convergence of the iterative sequence.
The best known deterministic polynomial-time algorithm for primality testing right now is due to
Agrawal, Kayal, and Saxena. This algorithm has a time complexity O(log15=2(n)). Although this algorithm is
polynomial, its reliance on the congruence of large polynomials results in enormous computational requirement.
In this paper, we propose a parallelization technique for this algorithm based on message-passing
parallelism together with four workload-distribution strategies. We perform a series of experiments on an
implementation of this algorithm in a high-performance computing system consisting of 15 nodes, each with
4 CPU cores. The experiments indicate that our proposed parallelization technique introduce a significant
speedup on existing implementations. Furthermore, the dynamic workload-distribution strategy performs
better than the others. Overall, the experiments show that the parallelization obtains up to 36 times speedup.
Numerical Study of Some Iterative Methods for Solving Nonlinear Equationsinventionjournals
In this paper we introduce, numerical study of some iterative methods for solving non linear equations. Many iterative methods for solving algebraic and transcendental equations is presented by the different formulae. Using bisection method , secant method and the Newton’s iterative method and their results are compared. The software, matlab 2009a was used to find the root of the function for the interval [0,1]. Numerical rate of convergence of root has been found in each calculation. It was observed that the Bisection method converges at the 47 iteration while Newton and Secant methods converge to the exact root of 0.36042170296032 with error level at the 4th and 5th iteration respectively. It was also observed that the Newton method required less number of iteration in comparison to that of secant method. However, when we compare performance, we must compare both cost and speed of convergence [6]. It was then concluded that of the three methods considered, Secant method is the most effective scheme. By the use of numerical experiments to show that secant method are more efficient than others.
This research paper is a statistical comparative study of a few average case asymptotically optimal sorting algorithms namely, Quick sort, Heap sort and K- sort. The three sorting algorithms all with the same average case complexity have been compared by obtaining the corresponding statistical bounds while subjecting these procedures over the randomly generated data from some standard discrete and continuous
probability distributions such as Binomial distribution, Uniform discrete and continuous distribution and Poisson distribution. The statistical analysis is well supplemented by the parameterized complexity analysis.
Zero-Forcing Precoding and Generalized InversesDaniel Tai
This document discusses zero-forcing precoding and its relationship to generalized inverses. It examines this technique for multi-input single-output wireless systems under two power constraints: total transmit power and per-antenna power. The paper formulates the optimization problems for maximizing sum rate and fairness under these constraints. It presents the solutions using generalized inverses and simulations to evaluate the performance under different conditions.
Advanced Support Vector Machine for classification in Neural NetworkAshwani Jha
This paper proposes a method to classify EEG signals using a support vector machine (SVM) classifier combined with a quicksort sorting algorithm (SVM-Q). The method involves extracting phase locking value (PLV) features from EEG data, sorting the feature vectors using quicksort, and then applying SVM classification. When tested on two BCI competition datasets, SVM-Q achieved classification accuracies of 86% and 77%, outperforming plain SVM which achieved 62% and 54% respectively. The paper concludes that adding a sorting algorithm to SVM can improve its classification performance for brain-computer interface applications.
This paper introduces a new comparison base stable sorting algorithm, named RA sort. The RA sort
involves only the comparison of pair of elements in an array which ultimately sorts the array and does not
involve the comparison of each element with every other element. It tries to build upon the relationship
established between the elements in each pass. Instead of going for a blind comparison we prefer a
selective comparison to get an efficient method. Sorting is a fundamental operation in computer science.
This algorithm is analysed both theoretically and empirically to get a robust average case result. We have
performed its Empirical analysis and compared its performance with the well-known quick sort for various
input types. Although the theoretical worst case complexity of RA sort is Yworst(n) = O(n√), the
experimental results suggest an empirical Oemp(nlgn)1.333 time complexity for typical input instances, where
the parameter n characterizes the input size. The theoretical complexity is given for comparison operation.
We emphasize that the theoretical complexity is operation specific whereas the empirical one represents the
overall algorithmic complexity.
α Nearness ant colony system with adaptive strategies for the traveling sales...ijfcstjournal
On account of ant colony algorithm easy to fall into local optimum, this paper presents an improved ant
colony optimization called α-AACS and reports its performance. At first, we provide an concise description
of the original ant colony system(ACS) and introduce α-nearness based on the minimum 1-tree for ACS’s
disadvantage, which better reflects the chances of a given link being a member of an optimal tour. Then, we
improve α-nearness by computing a lower bound and propose other adaptations for ACS. Finally, we
conduct a fair competition between our algorithm and others. The results clearly show that α-AACS has a
better global searching ability in finding the best solutions, which indicates that α-AACS is an effective
approach for solving the traveling salesman problem.
Time of arrival based localization in wireless sensor networks a non linear ...sipij
In this paper, we aim to obtain the location information of a sensor node deployed in a Wireless Sensor Network (WSN). Here, Time of Arrival based localization technique is considered. We calculate the position information of an unknown sensor node using the non- linear techniques. The performances of the techniques are compared with the Cramer Rao Lower bound (CRLB). Non-linear Least Squares and the Maximum Likelihood are the non-linear techniques that have been used to estimate the position of the unknown sensor node. Each of these non-linear techniques are iterative approaches, namely, Newton
Raphson estimate, Gauss Newton Estimate and the Steepest Descent estimate for comparison. Based on the
results of the simulation, the approaches have been compared. From the simulation study, Localization
based on Maximum Likelihood approach is having higher localization accuracy.
This document presents results from a lattice QCD calculation of the proton isovector scalar charge (gs) at two light quark masses. The calculation uses domain-wall fermions and Iwasaki gauge actions on a 323x64 lattice with a spacing of 0.144 fm. Ratios of three-point to two-point correlation functions are formed and fit to a plateau to extract gs. Values of gs are obtained for quark masses of 0.0042 and 0.001, and all-mode averaging is used for the lighter mass. Chiral perturbation theory will be used to extrapolate gs to the physical quark mass. Preliminary results for gs at the unphysical quark masses are reported in lattice units.
Photoacoustic tomography based on the application of virtual detectorsIAEME Publication
This document discusses using virtual detectors to improve photoacoustic tomography (PAT) image reconstruction when full scanning data is unavailable. It proposes interpolation and compressed sensing methods to generate virtual detector data and increase the number of measurements. Simulation results show applying these methods to preprocessed photoacoustic data significantly improves the peak signal-to-noise ratio of reconstructed images compared to direct reconstruction with limited detectors. Dictionary-based compressed sensing provides the best performance by learning an over-complete dictionary to sparsify signals. The methods allow better quality PAT imaging when hardware and spatial constraints limit actual detector positions and sampling angles.
Performance of cognitive radio networks with maximal ratio combining over cor...Polytechnique Montreal
This document analyzes the performance of cognitive radio networks using maximal ratio combining over correlated Rayleigh fading channels. It presents a simple analytical method to derive closed-form expressions for the probabilities of detection and false alarm. The key findings are:
1) The detection probability is a monotonically increasing function of the number of antennas, as more antennas provides more diversity gain.
2) Antenna correlation degrades the sensing performance compared to independent antennas. Higher correlation results in lower detection probability.
3) Complementary receiver operating characteristic curves illustrate that both higher signal-to-noise ratio and lower antenna correlation improve detection performance by increasing the detection probability and decreasing the probability of miss at a given false alarm probability.
Quantum Annealing for Dirichlet Process Mixture Models with Applications to N...Shu Tanaka
Our paper entitled “Quantum Annealing for Dirichlet Process Mixture Models with Applications to Network Clustering" was published in Neurocomputing. This work was done in collaboration with Dr. Issei Sato (Univ. of Tokyo), Dr. Kenichi Kurihara (Google), Professor Seiji Miyashita (Univ. of Tokyo), and Prof. Hiroshi Nakagawa (Univ. of Tokyo).
http://www.sciencedirect.com/science/article/pii/S0925231213005535
The preprint version is available:
http://arxiv.org/abs/1305.4325
佐藤一誠さん(東京大学)、栗原賢一さん(Google)、宮下精二教授(東京大学)、中川裕志教授(東京大学)との共同研究論文 “Quantum Annealing for Dirichlet Process Mixture Models with Applications to Network Clustering" が Neurocomputing に掲載されました。
http://www.sciencedirect.com/science/article/pii/S0925231213005535
プレプリントバージョンは
http://arxiv.org/abs/1305.4325
からご覧いただけます。
Hybrid TSR-PSR in nonlinear EH half duplex network: system performance analy...IJECEIAES
Nowadays, harvesting energy (EH) from green environmental sources and converting this energy into the electrical energy used in purpose to supply the communication network devices is considered the main research direction. In this research, we investigate the hybrid TSR-PSR Nonlinear Energy Harvesting (EH) Half-duplex (HD) Relaying network in terms of the Success Probability (SP). For this purpose, we derive the integral-form of the system SP. In addition, we use the Monte Carlo simulation for verifying the correctness of the analytical expression. We can see in the research results that all the simulation and analytical values are the same in connection with all primary system parameters.
This document summarizes several papers on principal component analysis (PCA) with network/graph constraints. It discusses graph-Laplacian PCA (gLPCA) which adds a graph smoothness regularization term to standard PCA. It also covers robust graph-Laplacian PCA (RgLPCA) which uses an L2,1 norm and iterative algorithms. Further, it summarizes robust PCA on graphs which learns the product of principal directions and components while assuming smoothness on this product. Finally, it discusses manifold regularized matrix factorization (MMF) which imposes orthonormal constraints on principal directions.
Low Power Adaptive FIR Filter Based on Distributed ArithmeticIJERA Editor
This paper aims at implementation of a low power adaptive FIR filter based on distributed arithmetic (DA) with
low power, high throughput, and low area. Least Mean Square (LMS) Algorithm is used to update the weight
and decrease the mean square error between the current filter output and the desired response. The pipelined
Distributed Arithmetic table reduces switching activity and hence it reduces power. The power consumption is
reduced by keeping bit-clock used in carry-save accumulation much faster than clock of rest of the operations.
We have implemented it in Quartus II and found that there is a reduction in the total power and the core dynamic
power by 31.31% and 100.24% respectively when compared with the architecture without DA table
EXACT SOLUTIONS OF SCHRÖDINGER EQUATION WITH SOLVABLE POTENTIALS FOR NON PT/P...ijrap
We have obtained explicitly the exact solutions of the Schrodinger equation with Non PT/PT symmetric
Rosen Morse II, Scarf II and Coulomb potentials. Energy eigenvalues and the corresponding
unnormalized wave functions for these systems for both Non PT and PT symmetric are also obtained using
the Nikiforov-Uvarov (NU) method.
On Approach of Estimation Time Scales of Relaxation of Concentration of Charg...Zac Darcy
In this paper we generalized recently introduced approach for estimation of time scales of mass transport.
The approach have been illustrated by estimation of time scales of relaxation of concentrations of charge
carriers in high-doped semiconductor. Diffusion coefficients and mobility of charge carriers and electric
field strength in semiconductor could be arbitrary functions of coordinate.
Further results on the joint time delay and frequency estimation without eige...IJCNCJournal
Joint Time Delay and Frequency Estimation (JTDFE) problem of complex sinusoidal signals received at
two separated sensors is an attractive problem that has been considered for several engineering
applications. In this paper, a high resolution null (noise) subspace method without eigenvalue
decomposition is proposed. The direct data Matrix is replaced by an upper triangular matrix obtained from
Rank-Revealing LU (RRLU) factorization. The RRLU provides accurate information about the rank and the
numerical null space which make it a valuable tool in numerical linear algebra.The proposed novel method
decreases the computational complexity of JTDFE approximately to the half compared with RRQR
methods. The proposed method generates estimates of the unknown parameters which are based on the
observation and/or covariance matrices. This leads to a significant improvement in the computational load.
Computer simulations are included in this paper to demonstrate the proposed method.
PROGRAMMA ATTIVITA’ DIDATTICA A.A. 2016/17
DOTTORATO DI RICERCA IN INGEGNERIA STRUTTURALE E GEOTECNICA
____________________________________________________________
STOCHASTIC DYNAMICS AND MONTE CARLO SIMULATION IN EARTHQUAKE ENGINEERING APPLICATIONS
Lecture Series by
Agathoklis Giaralis, Ph.D., M.ASCE., P.E. City, University of London
Visiting Professor Sapienza University of Rome
A Non Parametric Estimation Based Underwater Target ClassifierCSCJournals
Underwater noise sources constitute a prominent class of input signal in most underwater signal processing systems. The problem of identification of noise sources in the ocean is of great importance because of its numerous practical applications. In this paper, a methodology is presented for the detection and identification of underwater targets and noise sources based on non parametric indicators. The proposed system utilizes Cepstral coefficient analysis and the Kruskal-Wallis H statistic along with other statistical indicators like F-test statistic for the effective detection and classification of noise sources in the ocean. Simulation results for typical underwater noise data and the set of identified underwater targets are also presented in this paper.
In order to improve sensing performance when the noise variance is not known, this paper considers a so-called
blind spectrum sensing technique that is based on eigenvalue models. In this paper, we employed the spiked population
models in order to identify the miss detection probability. At first, we try to estimate the unknown noise variance
based on the blind measurements at a secondary location. We then investigate the performance of detection, in terms
of both theoretical and empirical aspects, after applying this estimated noise variance result. In addition, we study the
effects of the number of SUs and the number of samples on the spectrum sensing performance.
Performance Assessment of Polyphase Sequences Using Cyclic Algorithmrahulmonikasharma
Polyphase Sequences (known as P1, P2, Px, Frank) exist for a square integer length with good auto correlation properties are helpful in the several applications. Unlike the Barker and Binary Sequences which exist for certain length and exhibits a maximum of two digit merit factor. The Integrated Sidelobe level (ISL) is often used to define excellence of the autocorrelation properties of given Polyphase sequence. In this paper, we present the application of Cyclic Algorithm named CA which minimizes the ISL (Integrated Sidelobe Level) related metric which in turn improve the Merit factor to a greater extent is main thing in applications like RADAR, SONAR and communications. To illustrate the performance of the P1, P2, Px, Frank sequences when cyclic Algorithm is applied. we presented a number of examples for integer lengths. CA(Px) sequence exhibits the good Merit Factor among all the Polyphase sequences that are considered.
Mining group correlations over data streamsyuanchung
The document proposes the MGDS algorithm to analyze group correlations over data streams more efficiently. MGDS dynamically maintains statistics from raw stream data in base windows to calculate correlations. It overcomes limitations of existing methods by not storing all historical values, reducing space and time complexity. Experiments show MGDS analyzes correlations faster than naive methods as the number of streams increases, and can accurately analyze correlations with varying size base windows.
LINEAR SEARCH VERSUS BINARY SEARCH: A STATISTICAL COMPARISON FOR BINOMIAL INPUTSIJCSEA Journal
For certain algorithms such as sorting and searching, the parameters of the input probability distribution,in addition to the size of the input, have been found to influence the complexity of the underlying algorithm.The present paper makes a statistical comparative study on parameterized complexity between linear and binary search algorithms for binomial inputs.
The inverse scattering series for tasks associated with primaries: direct non...Arthur Weglein
The inverse scattering series for tasks associated with primaries: direct non-linear inversion of 1D elastic media. In this paper, research on direct inversion for two pa-
rameter acoustic media (Zhang and Weglein, 2005) is
extended to the three parameter elastic case. We present
the first set of direct non-linear inversion equations for
1D elastic media (i.e., depth varying P-velocity, shear
velocity and density). The terms for moving mislocated
reflectors are shown to be separable from amplitude
correction terms. Although in principle this direct
inversion approach requires all four components of elastic
data, synthetic tests indicate that consistent value-added
results may be achieved given only ˆDPP measurements.
We can reasonably infer that further value would derive
from actually measuring ˆDPP , ˆD PS, ˆDSP and ˆDSS as
the method requires. The method is direct with neither
a model matching nor cost function minimization.
Using Subspace Pursuit Algorithm to Improve Performance of the Distributed Co...Polytechnique Montreal
This paper applies a compressed algorithm to improve the spectrum sensing performance of cognitive radio technology.
At the fusion center, the recovery error in the analog to information converter (AIC) when reconstructing the
transmit signal from the received time-discrete signal causes degradation of the detection performance. Therefore, we
propose a subspace pursuit (SP) algorithm to reduce the recovery error and thereby enhance the detection performance.
In this study, we employ a wide-band, low SNR, distributed compressed sensing regime to analyze and evaluate the
proposed approach. Simulations are provided to demonstrate the performance of the proposed algorithm.
ECG Classification using Dynamic High Pass Filtering and Statistical Framewor...CSCJournals
This paper presents a technique for detection of R peak from ECG using statistics of the input signal. In this method, high pass filter is derived from the statistics of given signal. Using Minimum Mean Square Error (MMSE) approach, filter parameters are estimated. For estimation of filter parameters, autocorrelation is used. Then further processing is done on the output of high pass filter to detect R peaks and analysis is carried out from the series of R-R intervals to estimate the time domain and frequency domain parameters. From these parameters, ECG classification is done as Normal Sinus Rhythm and Supraventricular tachycardia (SVT).
Consistent Nonparametric Spectrum Estimation Via Cepstrum ThresholdingCSCJournals
For stationary signals, there are number of power spectral density estimation techniques. The main problem of power spectral density (PSD)estimation methods is high variance. Consistent estimates may be obtained by suitable processing of the empirical spectrum estimates (periodogram). This may be done using window functions. These methods all require the choice of a certain resolution parameters called bandwidth. Various techniques produce estimates that have a good overall bias Vs variance tradeoff. In contrast, smooth components of this spectral required a wide bandwidth in order to achieve a significant noise reduction. In this paper, we explore the concept of cepstrum for non parametric spectral estimation. The method developed here is based on cepstrum thresholding for smoothed non parametric spectral estimation. The algorithm for Consistent Minimum Variance Unbiased Spectral estimator is developed and implemented, which produces good results for Broadband and Narrowband signals.
Similar to A New Enhanced Method of Non Parametric power spectrum Estimation. (20)
Introduction to AI for Nonprofits with Tapp NetworkTechSoup
Dive into the world of AI! Experts Jon Hill and Tareq Monaur will guide you through AI's role in enhancing nonprofit websites and basic marketing strategies, making it easy to understand and apply.
This presentation was provided by Steph Pollock of The American Psychological Association’s Journals Program, and Damita Snow, of The American Society of Civil Engineers (ASCE), for the initial session of NISO's 2024 Training Series "DEIA in the Scholarly Landscape." Session One: 'Setting Expectations: a DEIA Primer,' was held June 6, 2024.
हिंदी वर्णमाला पीपीटी, hindi alphabet PPT presentation, hindi varnamala PPT, Hindi Varnamala pdf, हिंदी स्वर, हिंदी व्यंजन, sikhiye hindi varnmala, dr. mulla adam ali, hindi language and literature, hindi alphabet with drawing, hindi alphabet pdf, hindi varnamala for childrens, hindi language, hindi varnamala practice for kids, https://www.drmullaadamali.com
How to Add Chatter in the odoo 17 ERP ModuleCeline George
In Odoo, the chatter is like a chat tool that helps you work together on records. You can leave notes and track things, making it easier to talk with your team and partners. Inside chatter, all communication history, activity, and changes will be displayed.
How to Build a Module in Odoo 17 Using the Scaffold MethodCeline George
Odoo provides an option for creating a module by using a single line command. By using this command the user can make a whole structure of a module. It is very easy for a beginner to make a module. There is no need to make each file manually. This slide will show how to create a module using the scaffold method.
Executive Directors Chat Leveraging AI for Diversity, Equity, and InclusionTechSoup
Let’s explore the intersection of technology and equity in the final session of our DEI series. Discover how AI tools, like ChatGPT, can be used to support and enhance your nonprofit's DEI initiatives. Participants will gain insights into practical AI applications and get tips for leveraging technology to advance their DEI goals.
বাংলাদেশের অর্থনৈতিক সমীক্ষা ২০২৪ [Bangladesh Economic Review 2024 Bangla.pdf] কম্পিউটার , ট্যাব ও স্মার্ট ফোন ভার্সন সহ সম্পূর্ণ বাংলা ই-বুক বা pdf বই " সুচিপত্র ...বুকমার্ক মেনু 🔖 ও হাইপার লিংক মেনু 📝👆 যুক্ত ..
আমাদের সবার জন্য খুব খুব গুরুত্বপূর্ণ একটি বই ..বিসিএস, ব্যাংক, ইউনিভার্সিটি ভর্তি ও যে কোন প্রতিযোগিতা মূলক পরীক্ষার জন্য এর খুব ইম্পরট্যান্ট একটি বিষয় ...তাছাড়া বাংলাদেশের সাম্প্রতিক যে কোন ডাটা বা তথ্য এই বইতে পাবেন ...
তাই একজন নাগরিক হিসাবে এই তথ্য গুলো আপনার জানা প্রয়োজন ...।
বিসিএস ও ব্যাংক এর লিখিত পরীক্ষা ...+এছাড়া মাধ্যমিক ও উচ্চমাধ্যমিকের স্টুডেন্টদের জন্য অনেক কাজে আসবে ...
A workshop hosted by the South African Journal of Science aimed at postgraduate students and early career researchers with little or no experience in writing and publishing journal articles.
A review of the growth of the Israel Genealogy Research Association Database Collection for the last 12 months. Our collection is now passed the 3 million mark and still growing. See which archives have contributed the most. See the different types of records we have, and which years have had records added. You can also see what we have for the future.
ISO/IEC 27001, ISO/IEC 42001, and GDPR: Best Practices for Implementation and...PECB
Denis is a dynamic and results-driven Chief Information Officer (CIO) with a distinguished career spanning information systems analysis and technical project management. With a proven track record of spearheading the design and delivery of cutting-edge Information Management solutions, he has consistently elevated business operations, streamlined reporting functions, and maximized process efficiency.
Certified as an ISO/IEC 27001: Information Security Management Systems (ISMS) Lead Implementer, Data Protection Officer, and Cyber Risks Analyst, Denis brings a heightened focus on data security, privacy, and cyber resilience to every endeavor.
His expertise extends across a diverse spectrum of reporting, database, and web development applications, underpinned by an exceptional grasp of data storage and virtualization technologies. His proficiency in application testing, database administration, and data cleansing ensures seamless execution of complex projects.
What sets Denis apart is his comprehensive understanding of Business and Systems Analysis technologies, honed through involvement in all phases of the Software Development Lifecycle (SDLC). From meticulous requirements gathering to precise analysis, innovative design, rigorous development, thorough testing, and successful implementation, he has consistently delivered exceptional results.
Throughout his career, he has taken on multifaceted roles, from leading technical project management teams to owning solutions that drive operational excellence. His conscientious and proactive approach is unwavering, whether he is working independently or collaboratively within a team. His ability to connect with colleagues on a personal level underscores his commitment to fostering a harmonious and productive workplace environment.
Date: May 29, 2024
Tags: Information Security, ISO/IEC 27001, ISO/IEC 42001, Artificial Intelligence, GDPR
-------------------------------------------------------------------------------
Find out more about ISO training and certification services
Training: ISO/IEC 27001 Information Security Management System - EN | PECB
ISO/IEC 42001 Artificial Intelligence Management System - EN | PECB
General Data Protection Regulation (GDPR) - Training Courses - EN | PECB
Webinars: https://pecb.com/webinars
Article: https://pecb.com/article
-------------------------------------------------------------------------------
For more information about PECB:
Website: https://pecb.com/
LinkedIn: https://www.linkedin.com/company/pecb/
Facebook: https://www.facebook.com/PECBInternational/
Slideshare: http://www.slideshare.net/PECBCERTIFICATION
ISO/IEC 27001, ISO/IEC 42001, and GDPR: Best Practices for Implementation and...
A New Enhanced Method of Non Parametric power spectrum Estimation.
1. Signal Processing an International Journal (SPIJ), Volume (4): Issue(1) 38
K.Suresh Reddy, S.Venkata Chalam & B.C.Jinaga
A New Enhanced Method of Non Parametric power spectrum
Estimation.
K.Suresh Reddy reddysureshk375@rediffmail.com
Associate Professor, ECE Department,
G.Pulla Reddy Engineering College,
Kurnool,518 002 AP, India.
Dr.S.Venkata Chalam sv_chalam2005@yahoo.com
Professor, ECE Department,
Ace college of Engineering,
Hyderabad, 500 003, AP, India..
Dr.B.C.Jinaga bcjinaga@jntu.ac.in
OSD, JNTU,
Hyderabad, AP, India.
Abstract
The spectral analysis of non uniform sampled data sequences using Fourier
Periodogram method is the classical approach.In view of data fitting and
computational standpoints why the Least squares periodogram (LSP) method is
preferable than the “classical” Fourier periodogram and as well as to the frequently-
used form of LSP due to Lomb and Scargle is explained. Then a new method of
spectral analysis of nonuniform data sequences can be interpreted as an iteratively
weighted LSP that makes use of a data-dependent weighting matrix built from the
most recent spectral estimate. It is iterative and it makes use of an adaptive (i.e.,
data-dependent) weighting, we refer to it as the iterative adaptive approach
(IAA).LSP and IAA are nonparametric methods that can be used for the spectral
analysis of general data sequences with both continuous and discrete spectra.
However, they are most suitable for data sequences with discrete spectra (i.e.,
sinusoidal data), which is the case we emphasize in this paper. Of the existing
methods for nonuniform sinusoidal data, Welch, MUSIC and ESPRIT methods
appear to be the closest in spirit to the IAA proposed here. Indeed, all these
methods make use of the estimated covariance matrix that is computed in the first
iteration of IAA from LSP. Comparative study of LSP with MUSIC and ESPRIT
methods are discussed.
Keywords: A Nonuniform sampled data, periodogram, least-squares method, iterative adaptive approach,
Welch, Music and Esprit spectral analysis.
1. INTRODUCTION
Let the data sequence { }N
nnty 1
)( =
consists of N number of samples whose spectral analysis is our
goal. We assume that the observations { }N
nnt 1=
are given, ),...1()( NnRty n =ε and that a possible
2. Signal Processing an International Journal (SPIJ), Volume (4): Issue(1) 39
K.Suresh Reddy, S.Venkata Chalam & B.C.Jinaga
nonzero mean has been removed from{ }N
nnty 1
)( =
, so that
∑=
=
N
n
nty
1
0)( . We will also assume
throughout this paper that the data sequence consists of a finite number of sinusoidal components
and of noise, which is a case of interest in many applications. Note that, while this assumption is not
strictly necessary for the nonparametric spectral analysis methods discussed in this paper, these
methods perform most satisfactorily when it is satisfied.
2. MOTIVATION FOR THE NEW ESTIMATOR
There are two different non parametric approaches to find the spectral analysis of nonuniform data
sequences. First is the classical periodogram approach and the second is Least Squares
periodogram approach. The proposed enhanced method of Iterative adaptive approach is explained.
2.1 Classical Periodogram Approach: The classical periodogram estimate for the power spectrum
of non uniformly sampled data sequence { }N
nnty 1
)( =
of length N can be interpreted by
2
)(
1
)( njwt
nFP ety
N
P −
=ω (1)
Where ω is the frequency variable and where, depending on the application, the
normalization factor might be different from 1/N (such as 1/N
2
, see, e.g., [1] and [2]). It can be
readily verified that can be obtained from the solution to the following least-squares (LS) data fitting
problem:
2
)()( ωβω
∧
=Fp ,
2
1
)(
)((min)( ∑=
−
∧
−=
N
n
tj
n
n
ety ω
ωβ
ωβωβ (2)
In the above (2), if we keep
)(
)()( ωφ
ωβωβ j
e= , the LS criterion can be written as
∑
∑
=
=
++
+−
N
n
n
n
N
n
n
t
tty
1
22
2
1
))((sin)(
))](cos()()([
ωφωωβ
ωφωωβ
(3)
Minimization of the first term in (3) makes sense, given the sinusoidal data assumption made
previously. However, the same cannot be said about the second term in (3), which has no data
fitting interpretation and hence only acts as an additive data independent perturbation on the first
term.
2.2 The LS Periodogram: It follows from the discussion in the previous subsection that in the case
of real-valued (sinusoidal) data, considered in this paper, the use of Fourier Periodogram is not
completely suitable, and that a more satisfactory spectral estimate should be obtained by solving the
following LS fitting problem:
2
1
])cos()([min ∑=
+−
N
n
nn tty φωα
α
(4)
The dependence of α and ω can be eliminated using a = α cos (φ) ; b= -α sin(φ) (5)
so that LS criterion can be written as
2
1
,
])sin()cos()([min ∑=
−−
N
n
nnn
ba
tbtaty ωω (6)
3. Signal Processing an International Journal (SPIJ), Volume (4): Issue(1) 40
K.Suresh Reddy, S.Venkata Chalam & B.C.Jinaga
The solution to the minimization problem in (6) is well known to be rR
b
a 1−
∧
∧
=
(7)
Where [ ])sin()cos(
)sin(
)cos(
1
nn
N
n n
n
tt
t
t
R ωω
ω
ω
∑=
= (8)
and )(
)sin(
)cos(
1
n
N
n n
n
ty
t
t
r ∑=
=
ω
ω
(9)
The power of the sinusoidal frequency component ω Can be given as
rRr
N
b
aRba
N
t
t
ba
N
T
N
n n
n
1
^
^
^^
2
1
^^
1
1
)sin(
)cos(1
−
=
=
=
∑ ω
ω
(10)
Hence the periodogram for Least Squares Criterion can be given as
)()()(
1
)( ωωωω rRr
N
p T
LSP = (11)
The LSP has been discussed, for example, in [3]–[8], under different forms and including various
generalized versions. In particular, the papers [6] and [8] introduced a special case of LSP that has
received significant attention in the subsequent literature.
2.3 Iterative Adaptive Approach: The algorithm for the proposed estimate is discussed as with the
notations. Let denote the step size of the grid considered for the frequency variable, and let
ω
ω
∆
= max
K denote the number of the grid points needed to cover the frequency interval ,
where denotes the largest integer less than or equal to x ; also, let ωω ∆= kk for k=1,…,K.
=
)(
.
.
)(
)(
2
1
tny
ty
ty
Y
,
=
)(
)(
k
k
k
b
a
ω
ω
θ , [ ]kkK scA = ,
=
=
)sin(
.
)sin(
,
)cos(
.
)cos( 11
nn
k
k
nn
k
k
t
t
s
t
t
c
ω
ω
ω
ω
(12)
Using this notation we can write the Least squares criterion in (6) as follows in the vector form at,
kωω =
2
KKAY θ−
(13)
Where denotes the Euclidean norm. The LS estimate of in (7) can be rewritten as
( ) .
1^
YAAA T
kk
T
kk
−
=θ (14)
4. Signal Processing an International Journal (SPIJ), Volume (4): Issue(1) 41
K.Suresh Reddy, S.Venkata Chalam & B.C.Jinaga
In addition to the sinusoidal component with frequency kω ,the data of Y also consists of other
sinusoidal components with frequencies different from .kω as well as noise. Regarding the latter,
we do not consider a noise component of explicitly, but rather implicitly via its contributions to the
data spectrum at ; for typical values of the signal-to-noise ratio, these noise contributions to
the spectrum are comparatively small. Let us define
( ).
,1
∑≠=
=
K
KPP
T
PPPk ADAQ ; (15)
+
=
10
01
2
)()( 22
pp
P
aa
D
ωω
(16)
which can be thought of as the covariance matrix of the other possible components in Y, besides the
sinusoidal component with frequency kω considered in (13).
In some applications, the covariance matrix of the noise component of Y is known (or,
rather, can be assumed with a good approximation) to be
∑
=
2
2
1
...0
.....
.....
.....
0...
Nσ
σ
, with given{ }N
nn 1
2
=
σ (17)
In such cases, we can simply add ∑ to the matrix kQ in (16).Assuming kQ that is available, and
that it is invertible, it would make sense to consider the following weighted LS (WLS) criterion,
instead of (13),
][][ 1
kkk
T
kk AYQAY θθ −− −
(18)
It is well known that the estimate of obtained by minimizing (18) is more accurate, under quite
general conditions, than the LS estimate obtained from (13).Note that a necessary condition for
to exist is that (2K-1)>N, which is easily satisfied in general.
The vector that minimizes (18) can be given by
( ) ( ).11
^ 1
YQAAQAQ k
T
kkk
T
kk
−−
−
= (19)
Similar to that of (11) the IAA estimate which makes us of Weighted Least Squares an be given by
kk
T
k
T
kIAA AA
N
P
^^
)(
1
θθ= (20)
The IAA estimate in (20) requires the inversion of NXN matrix kQ
for k=1, 2,…, K and also N≥1
which is computationally an intensive task.
To show how we can simply reduce the computational complexity of (19), let us introduce
the matrix
( ) T
kkkk
K
p
T
PPp ADAQADA +== ∑=1
ψ (21)
A simple calculation shows that
( ).111
kk
T
kkkkk AQADIAAQ −−−
+=ψ (22)
To verify this equation, premultiply it with
The ψ in (21) and observe that kk
T
kkkkkk AQADAAAQ 11 −−
+=ψ
( )kk
T
kkkk AQADAIA 1−
+= (23)
Inserting (22) in (19) yields the another expression for the IAA estimate
5. Signal Processing an International Journal (SPIJ), Volume (4): Issue(1) 42
K.Suresh Reddy, S.Venkata Chalam & B.C.Jinaga
( ) ( )YAAA T
kk
T
kk
111 −−−
∧
= ψψθ (24)
This is more efficient than in (19) computationally.
2.4 Demerits of Fourier Periodogram and LSP:
The spectral estimates obtained with either FP or LSP suffer from both local and global (or distant)
leakage problems. Local leakage is due to the width of the main beam of the spectral window, and it
is what limits the resolution capability of the periodogram. Global leakage is due to the side lobes of
the spectral window, and is what causes spurious peaks to occur (which leads to “false alarms”) and
small peaks to drown in the leakage from large peaks (which leads to “misses”). Additionally, there
is no satisfactory procedure for testing the significance of the periodogram peaks. In the uniformly
sampled data case, there is a relatively well-established test for the significance of the most
dominant peak of the periodogram; see [1], [2], and [13] and the references therein. In the
nonuniform sampled data case, [8] (see also [14] for a more recent account) has proposed a test
that mimics the uniform data case test mentioned above. However, it appears that the said test is
not readily applicable to the nonuniform data case; see [13] and the references therein. As a matter
of fact, even if the test were applicable, it would only be able to decide whether are white
noise samples, and not whether the data sequence contains one or several sinusoidal components
(we remark in passing on the fact that, even in the uniform data case, testing the existence of
multiple sinusoidal components, i.e., the significance of the second largest peak of the periodogram,
and so forth, is rather intricate [1], [2]). The only way of correcting the test, to make it applicable to
nonuniform data, appears to be via Monte Carlo simulations, which may be a rather computationally
intensive task (see [13]) The main contribution of the present paper is the introduction of a new
method for spectral estimation and detection in the nonuniform sampled data case, that does not
suffer from the above drawbacks of the periodogram (i.e., poor resolution due to local leakage
through the main lobe of the spectral window, significant global leakage through the side lobes, and
lack of satisfactory tests for the significance of the dominant peaks). A pre- view of what the paper
contains is as follows.
Both LSP and IAA provide nonparametric spectral estimates in the form of an estimated
amplitude spectrum (or periodogram ). We use the frequencies and amplitudes corresponding to
the dominant peaks of (first the largest one, then the second largest, and so on) in a Bayesian
information criterion see, e.g., [19] and the references therein, to decide which peaks we should
retain and which ones we can discard. The combined methods, viz. LSP BIC and IAA BIC,
provide parametric spectral estimates in the form of a number of estimated sinusoidal components
that are deemed to fit the data well. Therefore, the use of BIC in the outlined manner not only
bypasses the need for testing the significance of the periodogram peaks in the manner of [8] (which
would be an intractable problem for RIAA, and almost an intractable one for LSP as well—see [13]),
but it also provides additional information in the form of an estimated number of sinusoidal
components, which no periodogram test of the type discussed in the cited references can really
provide.
Finally, we present a method for designing an optimal sampling pattern that minimizes an
objective function based on the spectral window. In doing so, we assume that a sufficient number of
observations are already available, from which we can get a reasonably accurate spectral estimate.
We make use of this spectral estimate to design the sampling times when future measurements
should be per- formed. The literature is relatively scarce in papers that ap- proach the sampling
pattern design problem (see, e.g., [8] and [20]). One reason for this may be that, as explained later
on, spectral window-based criteria are relatively in- sensitive to the sampling pattern, unless prior
information (such as a spectral estimate) is assumed to be available—as in this paper. Another
reason may be the fact that measure- ment plans might be difficult to realize in some applications,
due to factors that are beyond the control of the experimenter. However, this is not a serious
problem for the sampling pattern design strategy proposed here which is flexible enough to tackle
cases with missed measurements by revising the measurement plan on the fly.
The amplitude and phase estimation (APES) method, proposed in [15] for uniformly
sampled data, has significantly less leakage (both local and global) than the periodogram. We follow
here the ideas in [16]–[18] to extend APES to the nonuniformly sampled data case. The so-obtained
generalized method is referred to as RIAA for reasons explained in the Abstract.
6. Signal Processing an International Journal (SPIJ), Volume (4): Issue(1) 43
K.Suresh Reddy, S.Venkata Chalam & B.C.Jinaga
2.5 The Iterative Adaptive Algorithm: The proposed algorithm for power spectrum estimation can
be explained as follows
• Initialization: Using the Least Squares method in (13) obtain the initial estimates of
{ }kθ which
are denoted by
0^
kθ .
• Iteration: Let
∧ i
kθ denote the estimates of { }kθ at the i
th
iteration (i=0, 1, 2…), and let
∧ i
ψ denote the estimate of ψ obtained from
∧ i
kθ .
• For i=0, 1, 2.., Compute:
= −
−
−
+∧
yAAA
i
T
kk
i
T
k
i
k
1
^
1
1
^1
)()( ψψθ for k=1,…K.
Until a given number of iterations are performed.
• Periodogram calculations:
Let
I
k
^
θ denotes the estimation of { }kθ Obtained by the iterative process (I denote
iteration number at which iteration is stopped). Using
I
k
^
θ
compute the IAA periodogram as
( ) ,
1
)(
=
∧∧ I
kk
T
k
TI
kkIAA AA
N
P θθω for k=1,… K.
7. Signal Processing an International Journal (SPIJ), Volume (4): Issue(1) 44
K.Suresh Reddy, S.Venkata Chalam & B.C.Jinaga
3. PROPOSED SYSTEM AND SIMULATED DATA:
The system model for the proposed algorithm is shown in Figure 1.
FIGURE 1: Proposed system model for the simulated data.
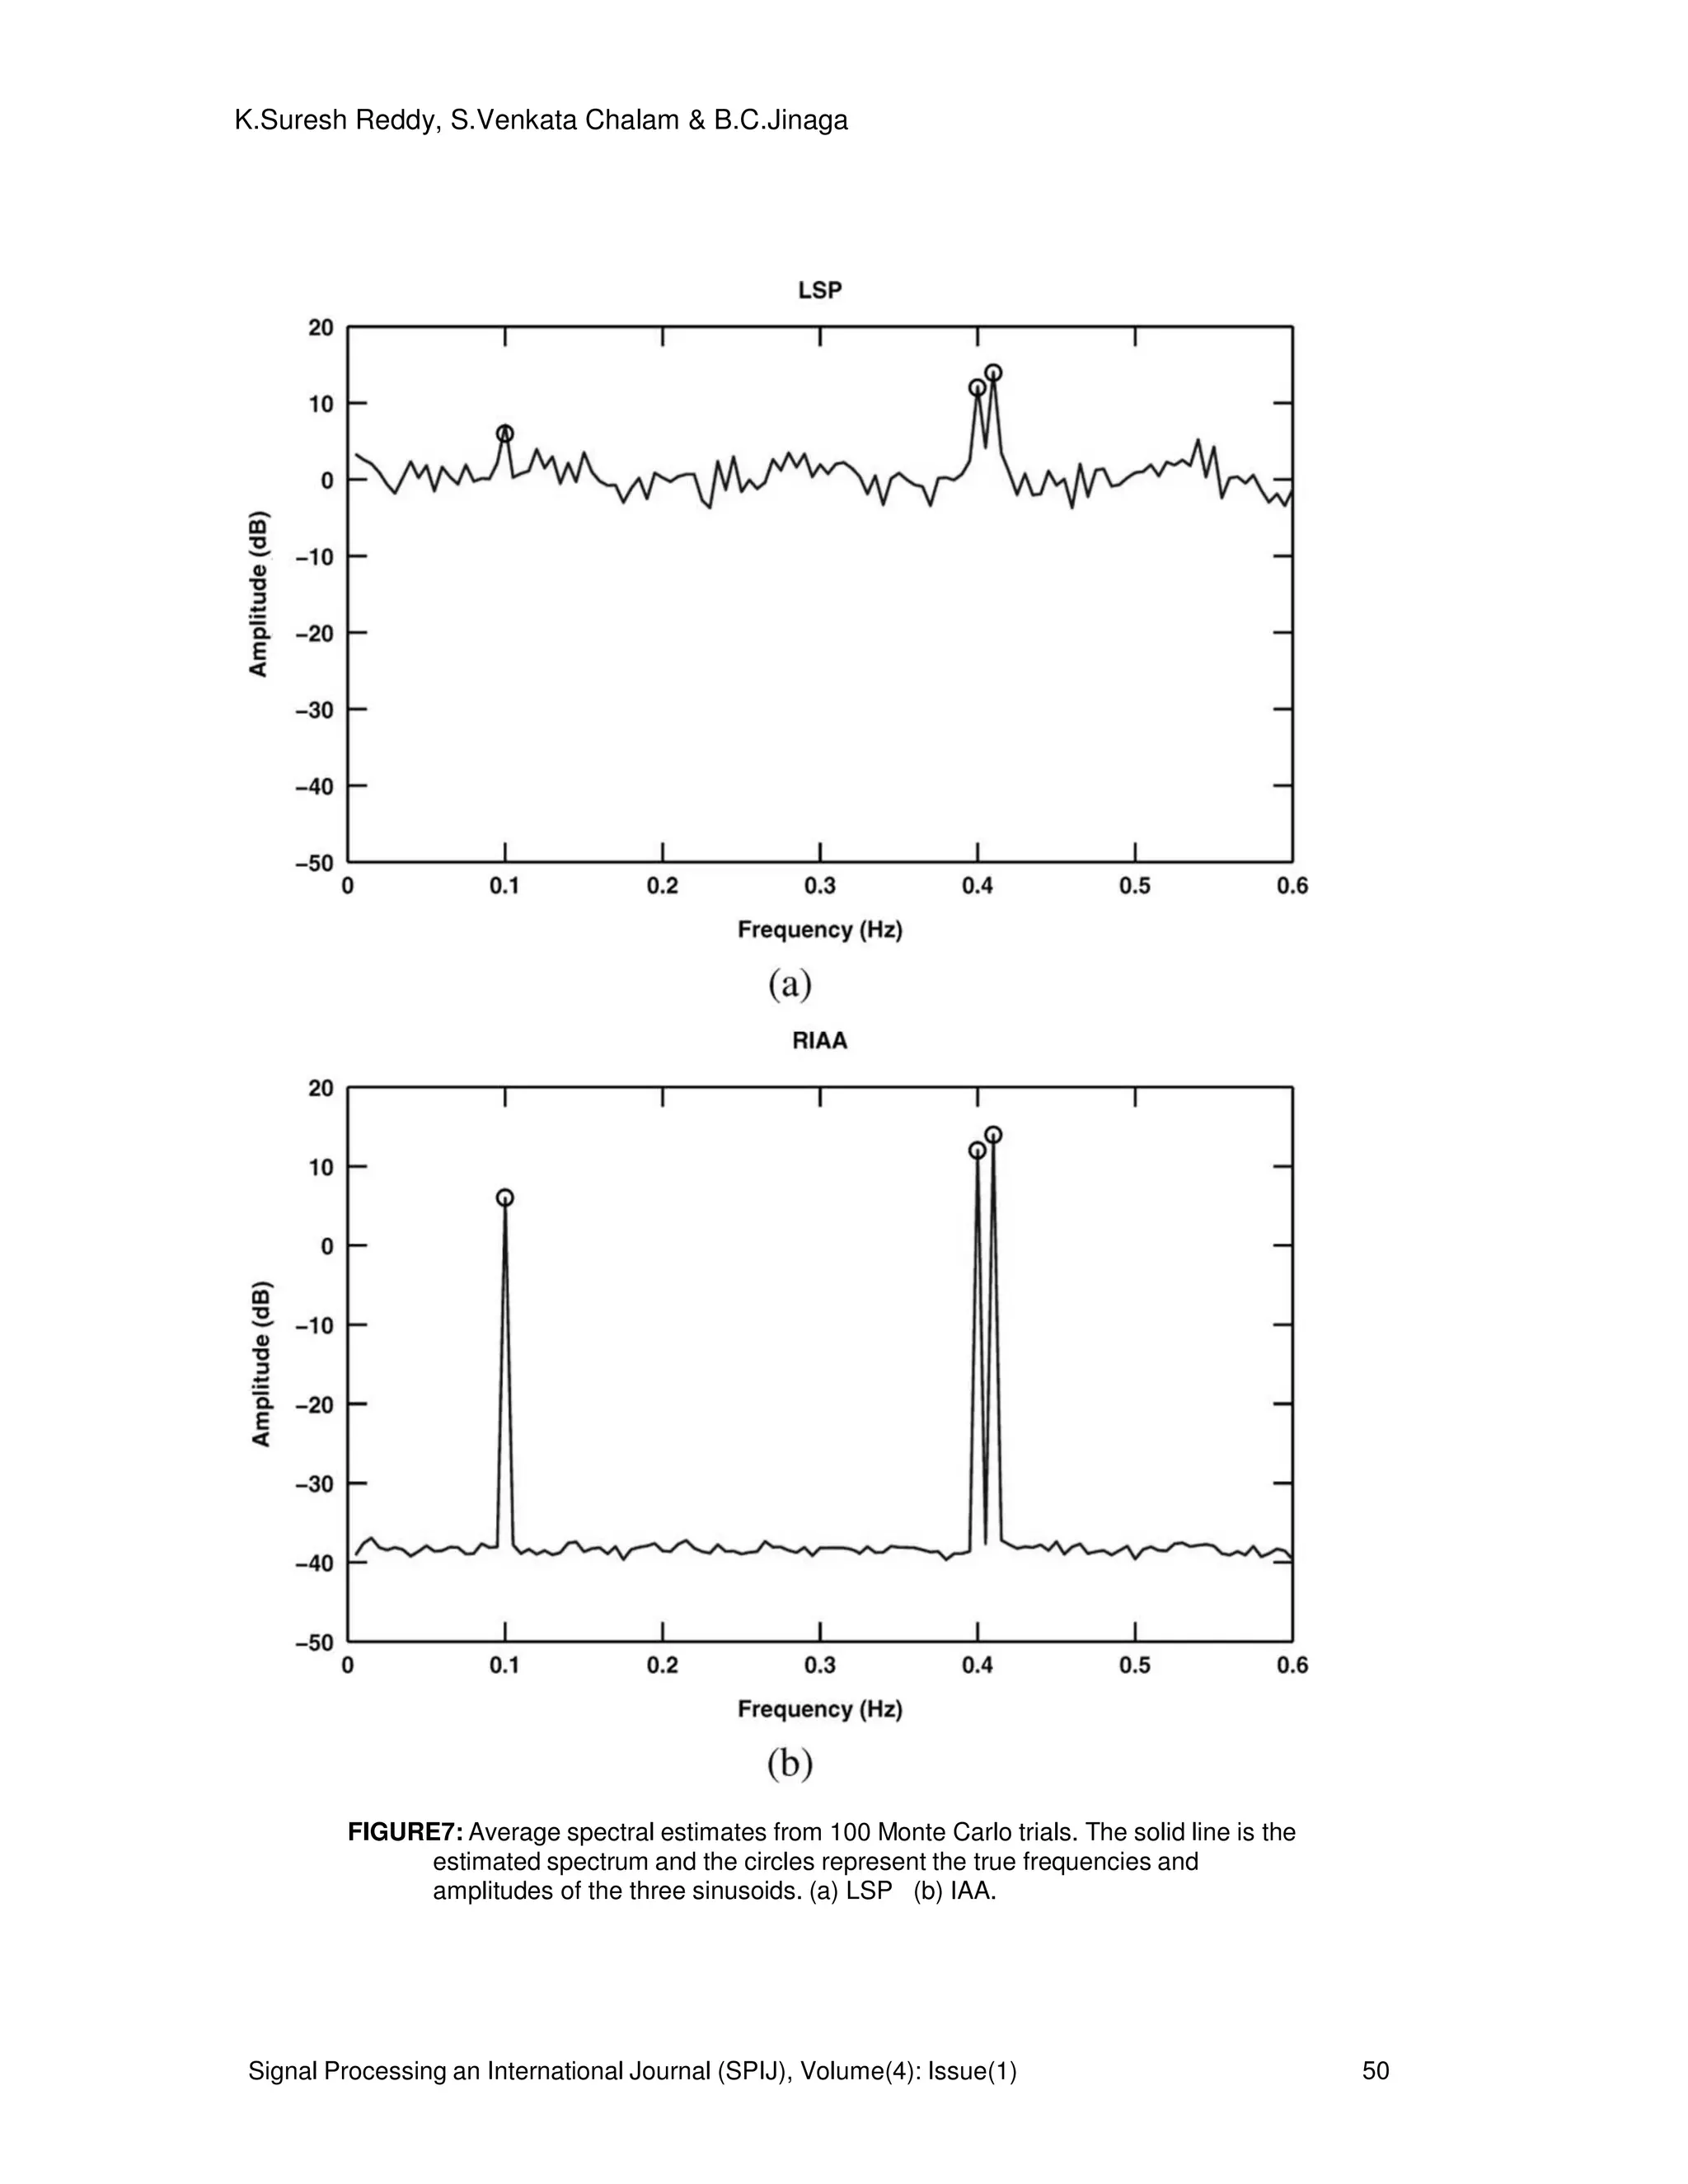
The system model for the proposed algorithm is shown in Figure 1. We consider a data
sequence consisting of M=3 sinusoidal components with frequencies 0.1, 0.4 and 0.41 Hz, and
amplitudes 2,4 and 5, respectively. The phases of the three sinusoids are independently and
uniformly distributed over [ ]π2,0 and the additive noise is white normally distributed with mean
of 0 and variance of
2
σ =0.01. We define the signal-to-noise ratio (SNR) of each sinusoid as
= 2
2
10
2/
log10
σ
αm
mSNR dB m=1,2,3. (25)
Where mα is the amplitude of the m
th
sinusoidal component hence SNR1=23 dB, SNR2=29 dB and
SNR3= 31 dB in this simulation example. The input data sequence for the system model is as
follows
)()4.02cos(4)4.02cos(3)1.02cos(2)( twttttx +++= πππ (26)
Where )(tw zero mean Gaussian is distributed white noise with variance of 0.01 and the sampling
pattern follows a Poisson process with parameter
1
1.0 −
= sλ , that is, the sampling intervals are
exponentially distributed with mean 10
1
==
λ
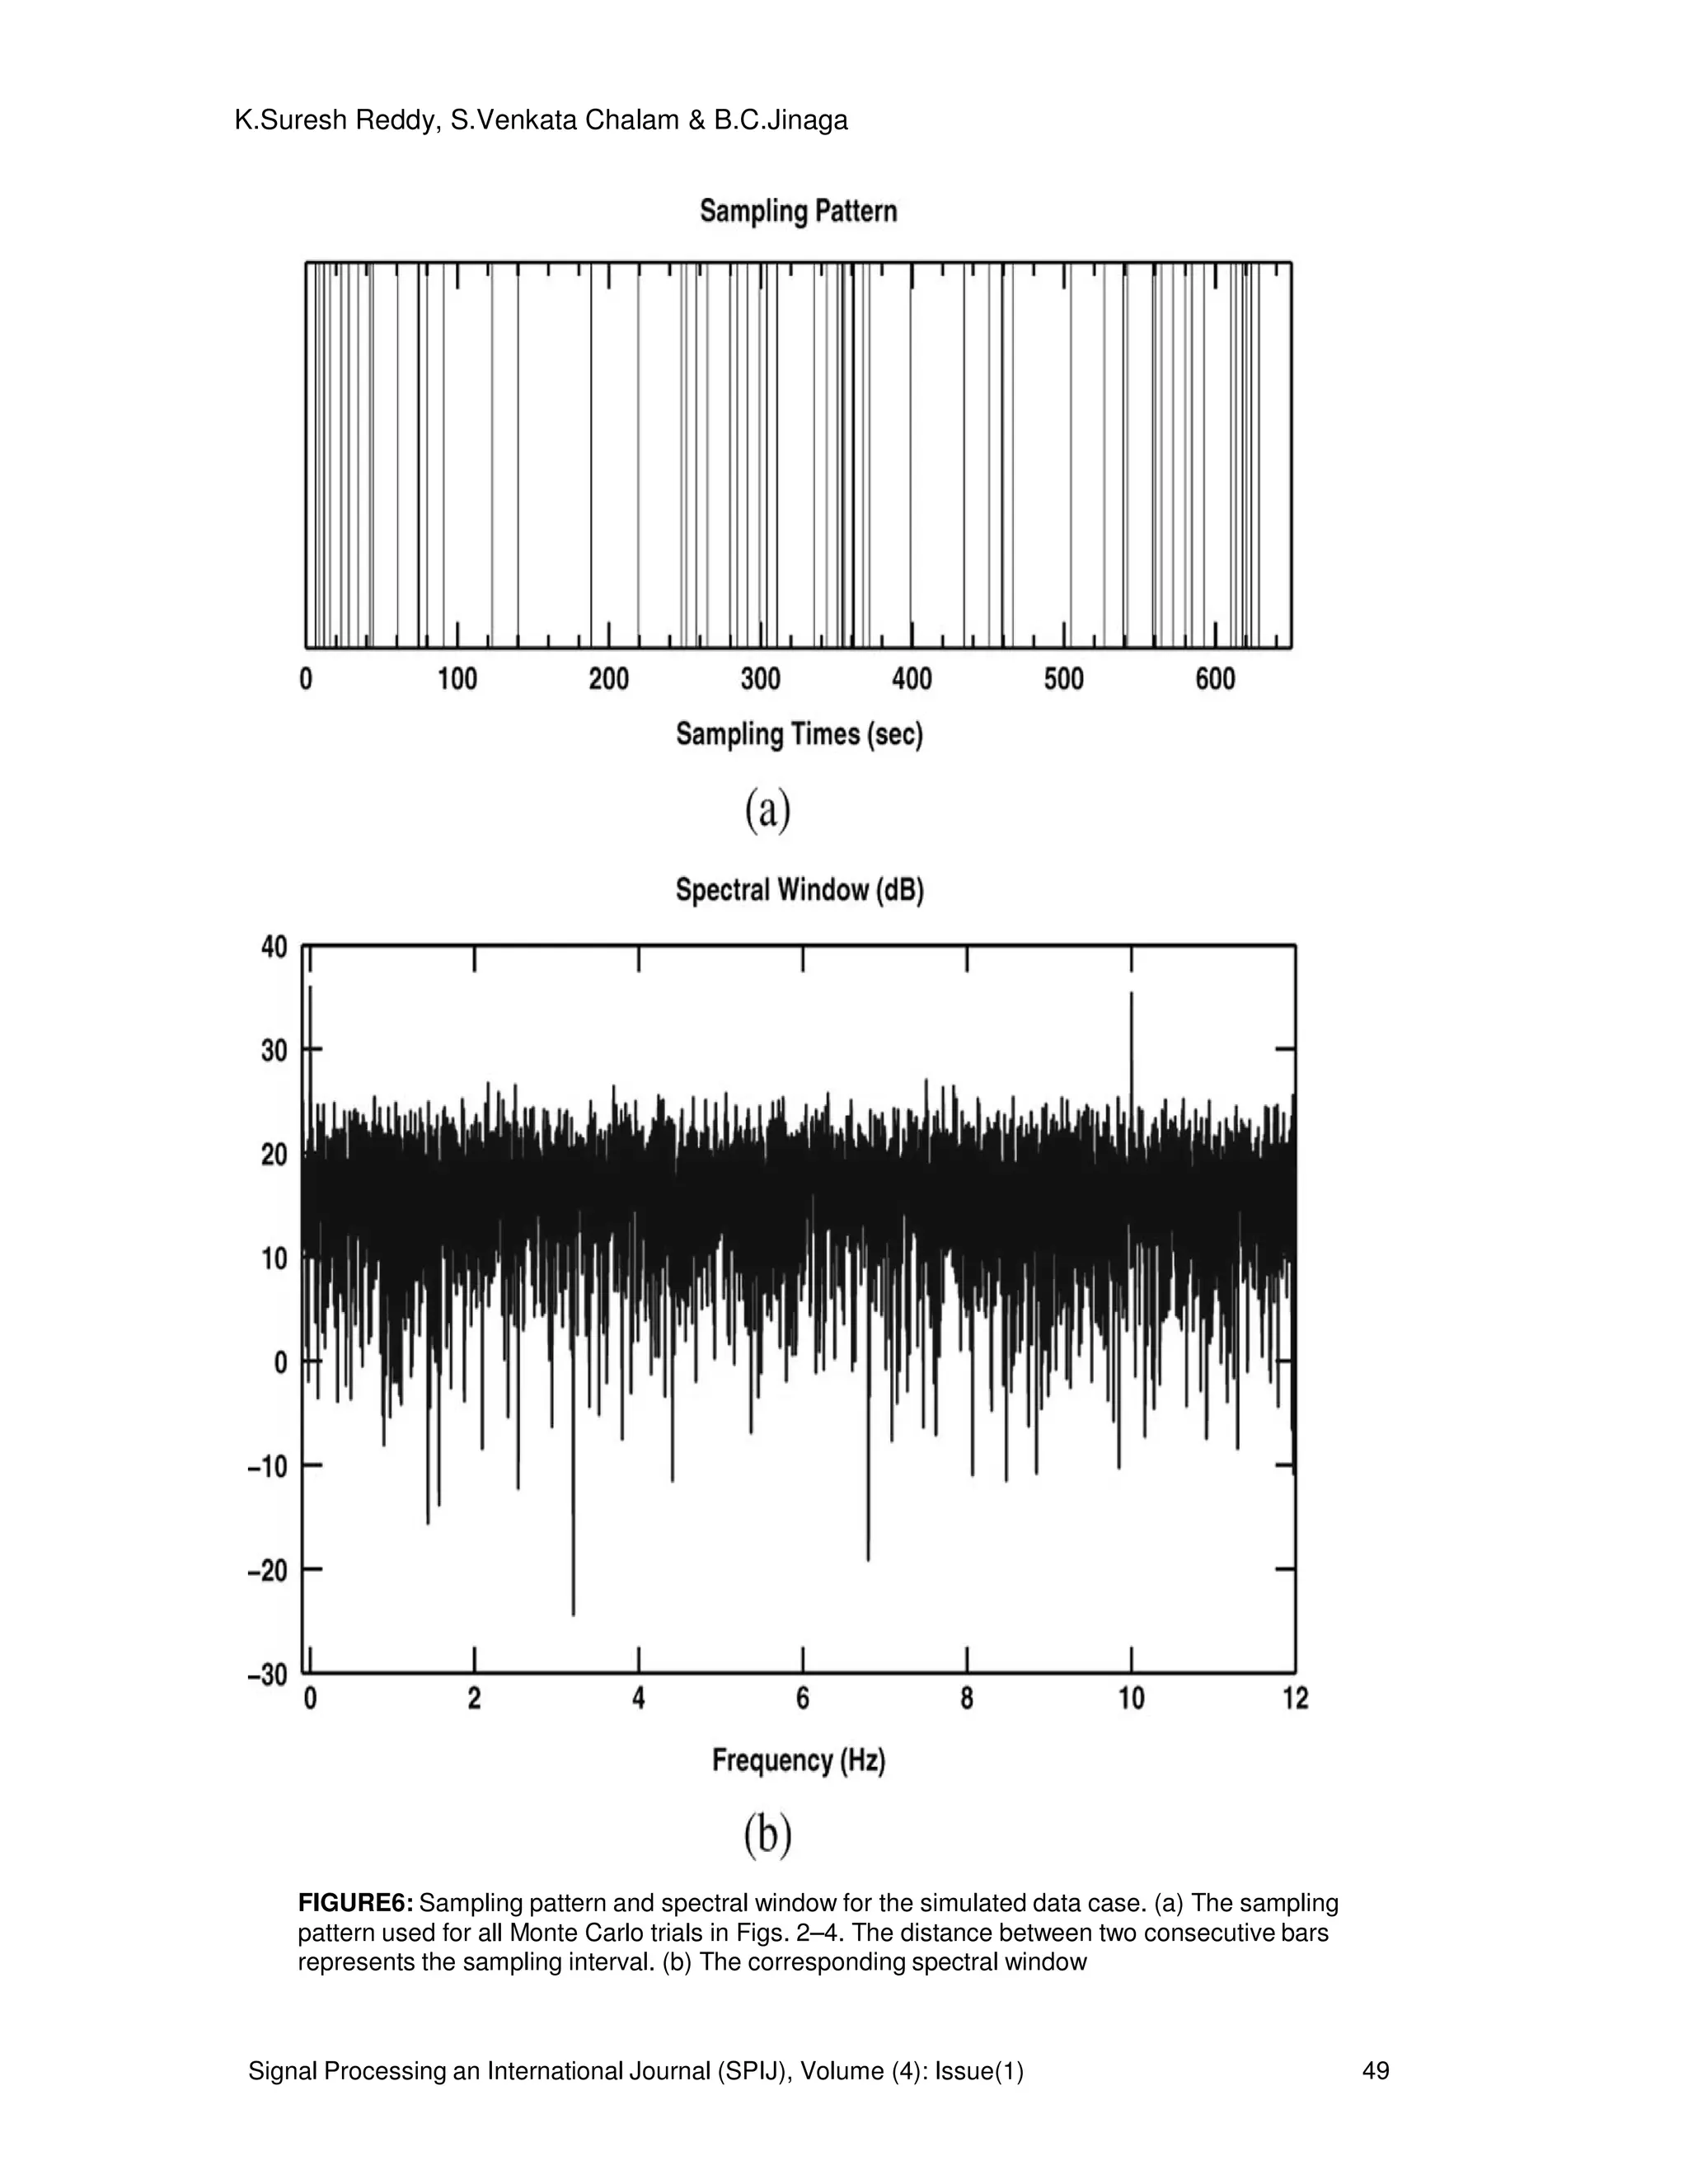
µ s. We choose N=64 and show the sampling pattern
in Fig. 3(a). Note the highly irregular sampling intervals, which range from 0.2 to 51.2 s with mean
value 9.3 s. Fig. 3(b) shows the spectral window corresponding to Fig. 3(a). The smallest frequency
at which the spectral 00 〉f at which the spectral window has a peak close to
2
N is approximately
10 Hz. Hence 2/0max ff = =5Hz. The step f∆ of the frequency grid is chosen as 0.005 Hz. However,
they are most suitable for data sequences with discrete spectra (i.e., sinusoidal data), which is the
case we emphasize in this paper. Of the existing methods for nonuniform sinusoidal data, Welch,
MUSIC and ESPRIT methods appear to be the closest in spirit to the IAA.
AR (P)
Filter
Periodogram
Analysis
Input data
x (n)
White
Noise w (n)
Periodogram
Using IAA
Periodogram
Using LSP
Y(n)
Non Parametric Spectrum
Pxx
(ω)
PIAA
(ω)
PLS ω)
+
8. Signal Processing an International Journal (SPIJ), Volume (4): Issue(1) 45
K.Suresh Reddy, S.Venkata Chalam & B.C.Jinaga
4. RESULT ANALYSIS:
The results in Fig. 2 presents the spectral estimates averaged over 100 independent
realizations of Monte-Carlo trials of periodogram and Welch estimates. Fig. 4 presents the
spectral estimates averaged over 100 independent realizations of LSP and IAA estimates. Fig. 5
presents the spectral estimates averaged over 100 independent realizations of Monte- Carlo trials
of Music and Esprit estimates. LSP nearly misses the smallest sinusoid while IAA successfully
resolves all three sinusoids. Note that IAA suffers from much less variability than LSP from one
trial to another. The plots were taken with the help MATLAB programming by the authors. LSP
and IAA are nonparametric methods that can be used for the spectral analysis of general data
sequences with both continuous and discrete spectra. However, they are most suitable for data
sequences with discrete spectra (i.e., sinusoidal data), which is the case we emphasize in this
paper. Of the existing methods for nonuniform sinusoidal data, Welch, MUSIC and ESPRIT
methods appear to be the closest in spirit to the IAA proposed here. Indeed, all these methods
make use of the estimated covariance matrix that is computed in the first iteration of IAA from
LSP. MUSIC and ESPRIT, on the other hand, are parametric methods that require a guess of the
number of sinusoidal components present in the data, otherwise they cannot be used
furthermore.
9. Signal Processing an International Journal (SPIJ), Volume (4): Issue(1) 46
K.Suresh Reddy, S.Venkata Chalam & B.C.Jinaga
FIGURE 2: Average spectral estimates from 100 Monte Carlo trials of Fourier periodogram
10. Signal Processing an International Journal (SPIJ), Volume (4): Issue(1) 47
K.Suresh Reddy, S.Venkata Chalam & B.C.Jinaga
FIGURE 3: Average spectral estimates from 100 Monte Carlo trials of Welch estimates.
11. Signal Processing an International Journal (SPIJ), Volume (4): Issue(1) 48
K.Suresh Reddy, S.Venkata Chalam & B.C.Jinaga
FIGURE 4: Average spectral estimates from 100 Monte Carlo trials of MEM estimates.
12. Signal Processing an International Journal (SPIJ), Volume (4): Issue(1) 49
K.Suresh Reddy, S.Venkata Chalam & B.C.Jinaga
FIGURE6: Sampling pattern and spectral window for the simulated data case. (a) The sampling
pattern used for all Monte Carlo trials in Figs. 2–4. The distance between two consecutive bars
represents the sampling interval. (b) The corresponding spectral window
13. Signal Processing an International Journal (SPIJ), Volume(4): Issue(1) 50
K.Suresh Reddy, S.Venkata Chalam & B.C.Jinaga
FIGURE7: Average spectral estimates from 100 Monte Carlo trials. The solid line is the
estimated spectrum and the circles represent the true frequencies and
amplitudes of the three sinusoids. (a) LSP (b) IAA.
14. Signal Processing an International Journal (SPIJ), Volume(4): Issue(1) 51
K.Suresh Reddy, S.Venkata Chalam & B.C.Jinaga
(a)
(b)
FIGURE8: Average spectral estimates from 100 Monte Carlo trials. (a) Music estimate
and (b) Esprit estimate.
15. Signal Processing an International Journal (SPIJ), Volume(4): Issue(1) 52
K.Suresh Reddy, S.Venkata Chalam & B.C.Jinaga
FIGURE9: Average spectral estimates from 100 Monte Carlo trials of Lomb
periodogram.
. 4. CONSLUSIONS:
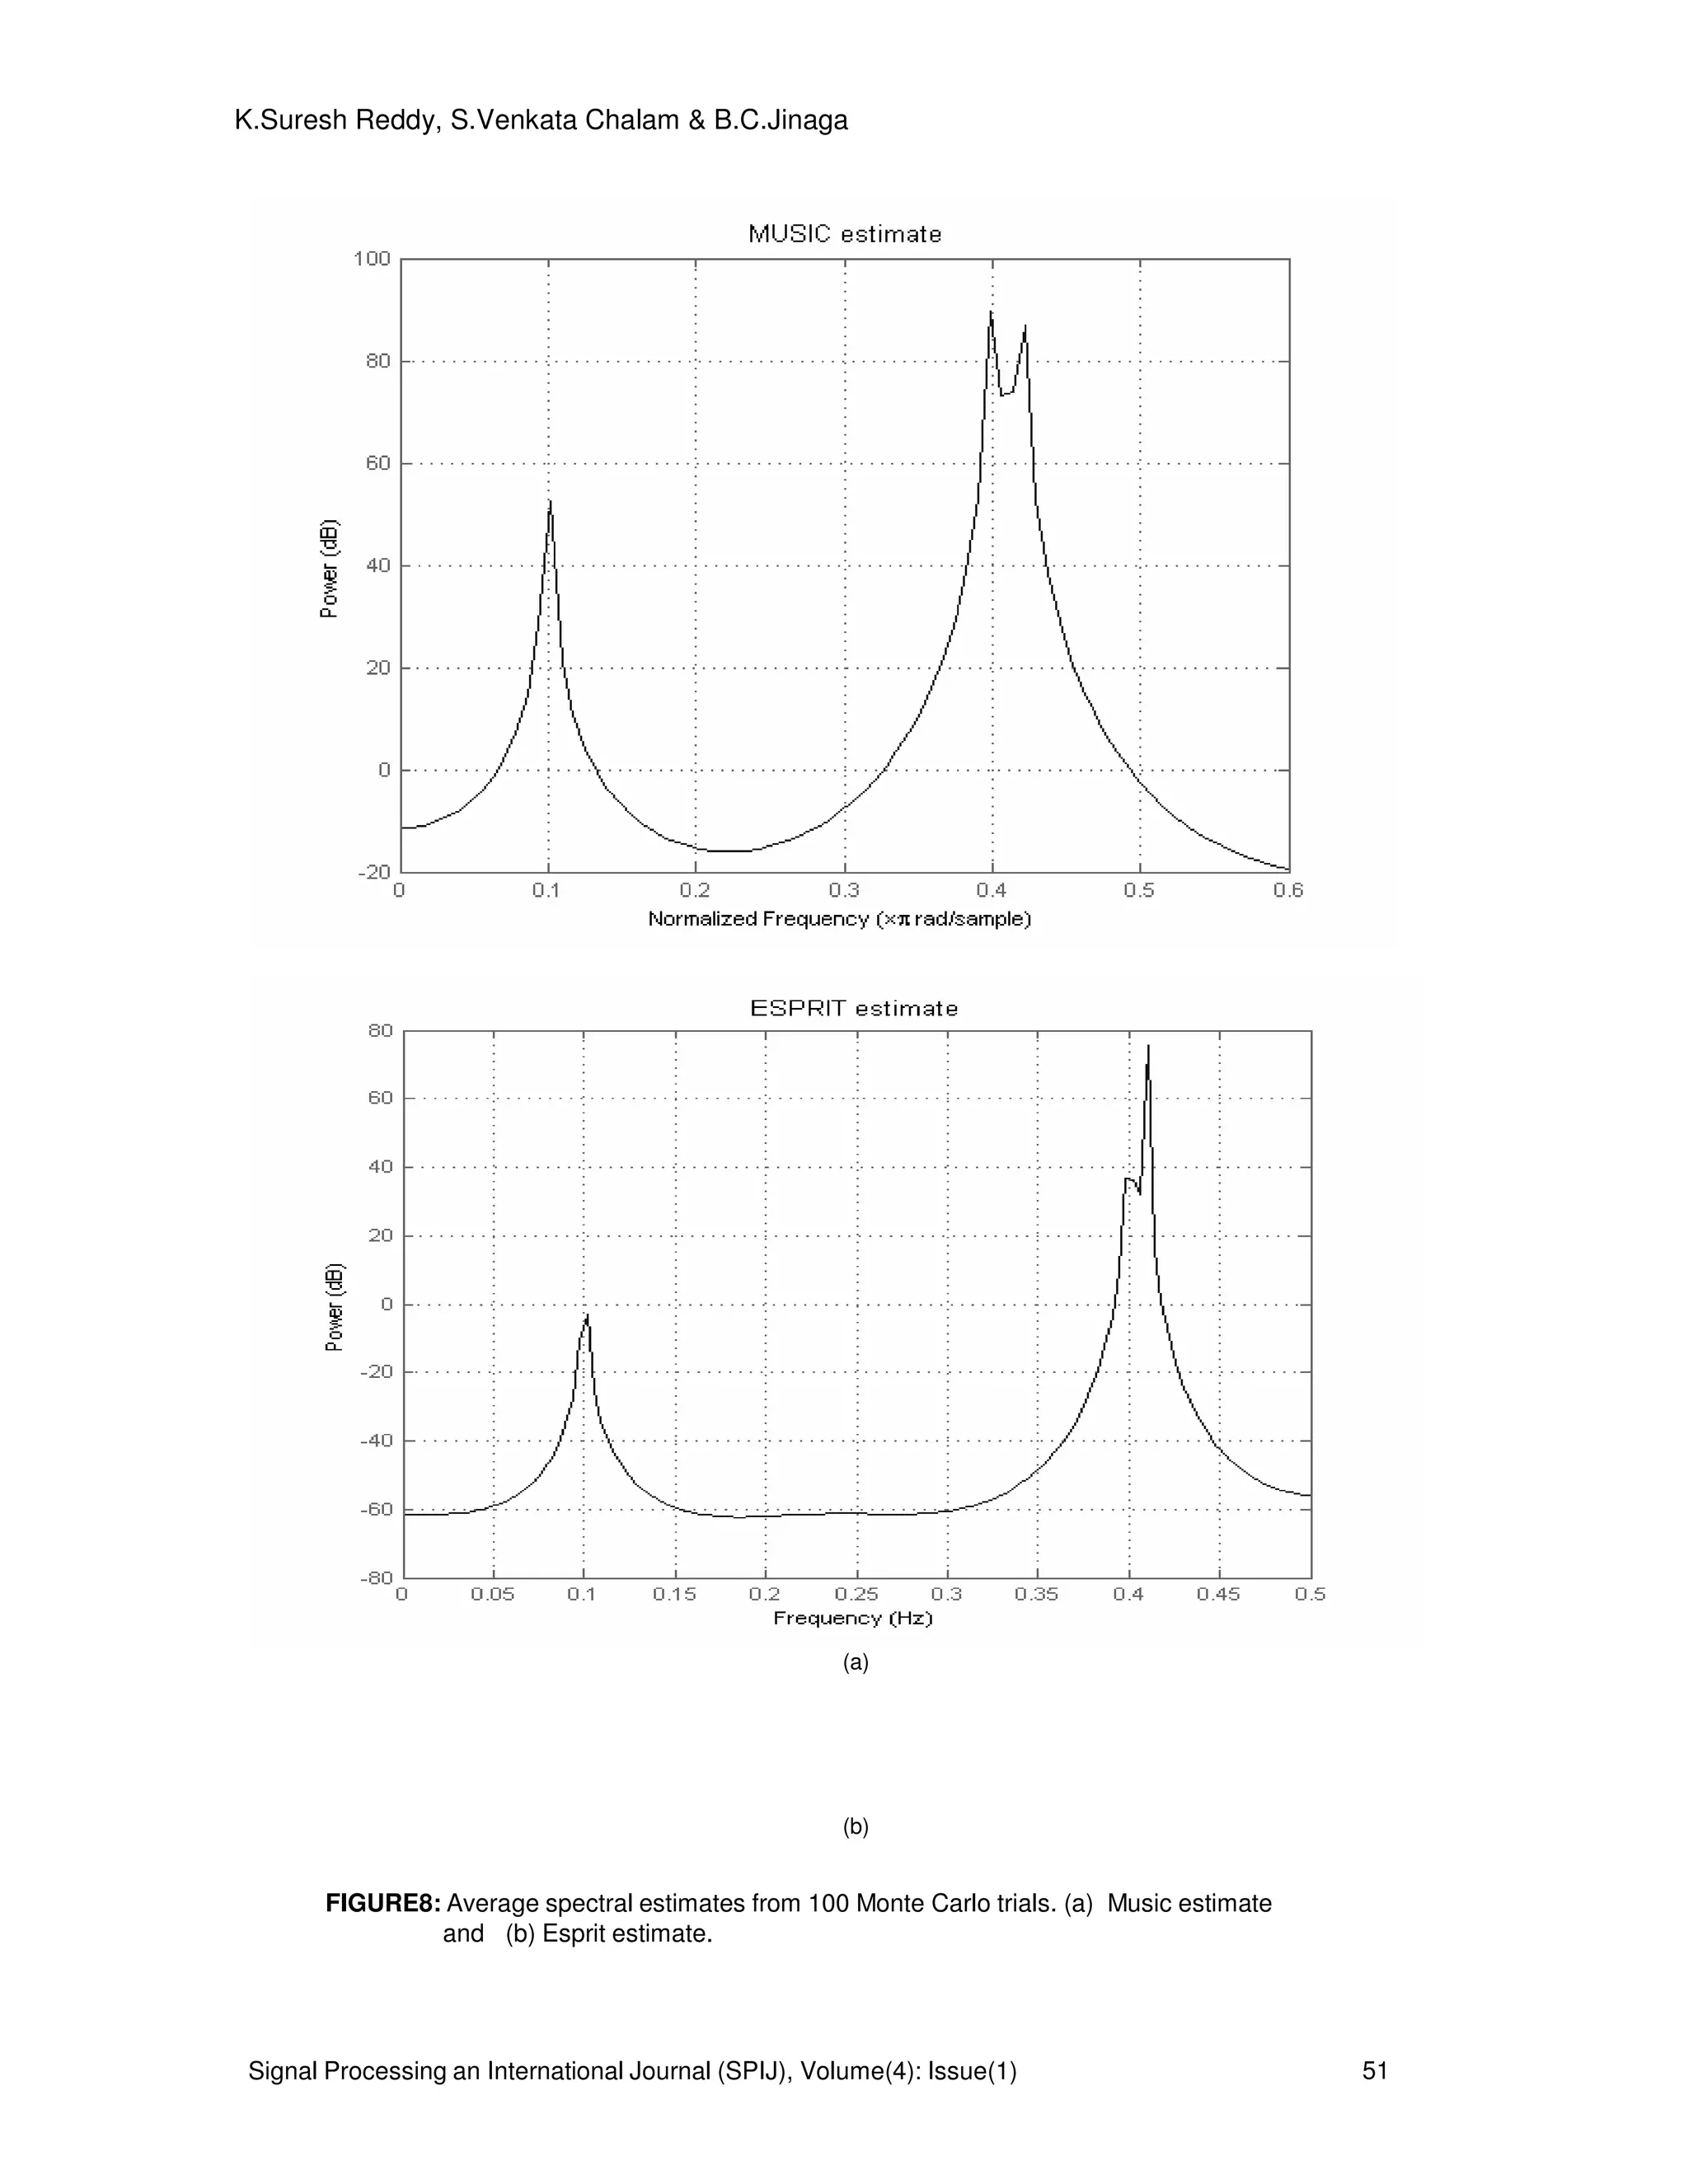
Of the existing methods for nonuniform sinusoidal data, the MUSIC and ESPRIT
methods appear to be the closest in spirit to the IAA proposed here (see the cited paper for
explanations of the acronyms used to designate these methods). Indeed, all these methods
make use of the estimated covariance matrix that is computed in the first iteration IAA from
LSP. In fact Welch (when used with the same covariance matrix dimension as IAA) is
essentially identical to the first iteration of IAA. MUSIC and ESPRIT.In the case of a single
sinusoidal signal in white Gaussian noise, the LSP is equivalent to the method of
maximum likelihood and therefore it is asymptotically statistically efficient. Consequently, in
this case LSP can be expected to outperform IAA. In numerical computations we have
observed that LSP tends to be somewhat better than IAA for relatively large values of N or
SNR; however, we have also observed that, even under these conditions that are ideal for
LSP, the performance of IAA in terms of MSE (mean squared error) is slightly better (by a
fraction of a dB) than that of LSP when or SNR becomes smaller than a certain threshold.
5. REFERENCES
[1] Stoica,P and R.L. Moses, Introduction to Spectral Analysis, Prentice-Hall, 1997, pp. 24-26.
[2] Welch, P.D, "The Use of Fast Fourier Transform for the Estimation of Power Spectra: A
Method Based on Time Averaging Over Short, Modified Periodogram," IEEE Trans.
Audio electro acoustics, Vol. AU-15 (June 1967), pp. 70-73.
[3] Oppenheim, A.V., and R.W. Schafer, Discrete-Time Signal Processing, Prentice-Hall,
1989, pp. 730-
742.
[4] B. Priestley, Spectral Analysis and Time Series, Volume 1: Univariate Series, New York:
Academic, 1981.
[5] P. Stoica and R. L. Moses, Spectral Analysis of Signals Upper Saddle River,
NJ: Prentice-Hall, 2005.
[6] F.J.M.Barning,“The numerical analysis of the light-curve of12 lacerate,” Bull.
16. Signal Processing an International Journal (SPIJ), Volume(4): Issue(1) 53
K.Suresh Reddy, S.Venkata Chalam & B.C.Jinaga
Astronomy. Inst Netherlands, vol. 17, no. 1, pp. 22–28, Aug. 1963.
[7] P. Vanicek, “Approximate spectral analysis by least-squares fit,” Astro- phys. Space Sci.,
vol. 4, no. 4, pp. 387–391, Aug. 1969.
[8] P. Vanicek, “Further development and properties of the spectral anal- ysis by
least- squares,” Astrophys. Space Sci.vol. 12, no. 1, pp. 10–33, Jul. 1971.
[9]N. R. Lomb, “Least-squares frequency analysis of unequally spaced data,” Astrophysics
. Space Sci., vol. 39, no. 2, pp. 447–462, Feb. 1976.
[10] S. Ferraz-Mello, “Estimation of periods from unequally spaced obser- vations,”
Astronom. J., vol.86, no.4, pp. 619–624, Apr.
1981.
[11] J. D. Scargle, “Studies in astronomical time series analysis. II—Statis- tical aspects of
spectral analysis of unevenly spaced data,” Astrophys. J., vol. 263, pp 835–853,
Dec.
1982.
[12] W. H. Press and G. B. Rybicki, “Fast algorithm for spectral analysis of unevenly
sampled data,” Astrophys. J., vol. 338, pp. 277–280, Mar.1989.
[13] J. A. Fessler and B. P. Sutton, “Nonuniform fast Fourier transforms using min-max
interpolation,” IEEE Trans. Signal Process., vol. 51, no. 2, pp. 560–574, Feb.
2003.
[14] N. Nguyen and Q. Liu, “The regular Fourier matrices and nonuniform fast
Fourier transforms,” SIAM J. Sci. Comput., vol. 21, no. 1,pp. 283–293, 2000.
[15] L. Eyer and P. Bartholdi, “Variable stars: Which Nyquist frequency?,”Astron. Astrophys.
Supp Series, vol. 135, pp. 1–3, Feb. 1999.
[16] F. A. M. Frescura, C. A. Engelbrecht, and B. S. Frank, “Significance tests for
periodogram peaks,” NASA Astrophysics Data System, Jun. 2007
[17] P. Reegen, “SigSpec—I. Frequency- and phase resolved significance in Fourier space,”
Astron Astrophys., vol. 467, pp. 1353–1371, Mar.2007.
[18] J. Li and P. Stoica, “An adaptive filtering approach to spectral estimation and SAR
imaging,”Trans., vol. 44, no. 6,pp. 1469–1484, Jun. 1996.
[19] T. Yardibi, M. Xue, J. Li, P. Stoica, and A. B.Baggeroer, “Iterative adaptive approach for
sparse signal representation with sensing applications,” IEEE Trans. Aerosp. Electron
. Syst., 2007.
[20] P. Stoica and Y. Selen, “Model-order selection: A review of information criterion rules,”
IEEE Signal Process. Mag., vol. 21, no. 4, pp.36–47, Jul. 2004.
[21] E. S. Saunders, T. Naylor, and A. Allan, “Optimal placement of a limited number of
observations for period searches,” Astron. Astrophys.,vol. 455, pp. 757–763, May 2006.