The document discusses a modal shift model for Japan's logistics network that analyzes shifting cargo transportation from roads to rail and marine transport. Key findings include:
1) The authors used logit models to analyze how transport distance, time, cost, freight size, and other factors influence shippers' choice of transport mode.
2) The models found it is feasible to shift a significant portion of current truck transport to rail or marine container transport.
3) Shifting more transport to rail and marine could improve loading efficiency and reduce CO2 emissions.
Bidding Strategies for Carrier in Combinatorial Transportation AuctionWaqas Tariq
In combinatorial auction for truckload transportation service procurement, we introduce the bidding strategy for carrier facing the hard valuation problem to all possible routes. The model uses a bid-to-cost ratio of carriers surveyed in Thailand to represent the bidding behavior in combinatorial freight procurement. This model facilitates carrier to value the bid price for interested packages that involve with pattern of transportation service under different competitive environment. The results of analysis with hypotheses in regression model reveal that pattern of transportation service, number of competitors, pattern of transportation service with number of competitors and a pre-empty backhaul to new lane distance ratio do impact significantly on bid price of carrier in combinatorial transportation auction. To find optimal bid price for interested packages in the incomplete information game, the empirical study in stochastic optimization problem with Monte Carlo method can present the best solution for bidder in order to acquire the maximum expected profit in the auction. The results obtained from optimal solution also show that they are more than the average benefit in the competition market considerably.
This document describes a distributed simulation model of maritime logistics in an iron ore supply chain. The model is composed of multiple simulation models representing individual ports and navigation routes. Each port is modeled generically to represent any iron ore port. The port and navigation models interact through a distributed simulation framework to simulate material and information flow throughout the entire supply chain. The model is intended to support fleet management decisions for a large mining company.
Exploring Queuing Theory to Minimize Traffic Congestion Problem in Calabar-Hi...Premier Publishers
Traffic congestion has been a serious problem that drivers are facing especially in Calabar – highway by IBB road intersection. In this paper, emphasis is placed on model formation and derivation of some parameters that will help to facilitate the flow of vehicles in this intersection to reduce traffic congestion. The channel considered in this research is multiple queue single servers. We derived variance waiting time of vehicles in the queue and in the system, expected number of vehicles in the queue and in the system waiting for service, expected waiting time of vehicles in the queue and in the system. We also determine the time each vehicle spends in the queue waiting for service and the mean queue length for all the channels in each section. The result shows fair traffic congestion in Calabar – highway by IBB road intersection especially in the morning and evening hours for all the locations.
International Refereed Journal of Engineering and Science (IRJES) is a peer reviewed online journal for professionals and researchers in the field of computer science. The main aim is to resolve emerging and outstanding problems revealed by recent social and technological change. IJRES provides the platform for the researchers to present and evaluate their work from both theoretical and technical aspects and to share their views.
www.irjes.com
This document summarizes a study of traffic flow characteristics for heterogeneous traffic in India. Speed, flow, and time headway data were collected from a six-lane urban road and analyzed. Headways between different vehicle combinations were found to best fit several statistical distributions. Speed-flow curves were plotted to determine the speed at which optimal flow occurs, though the study was limited by only using one hour of data. The results provide insight into modeling headways and understanding traffic flow in heterogeneous, mixed traffic conditions.
This document discusses performance measures for two-way, two-lane highways and identifies shortcomings in the current Highway Capacity Manual methodology. It summarizes alternative performance measures that have been suggested in research to address the discrepancies, such as Percent Impeded and Average Travel Speed. The document also reviews empirical models that have been developed to predict level of service based on these alternative measures and identifies additional measures used in different studies and countries. It concludes by recommending further research is needed to determine the best headway threshold for differentiating platoons and to identify the most suitable level of service measure for different road environments as the HCM may not always be applicable.
This document summarizes a study on performance measures for two-way, two-lane highways. It discusses the measures and methodologies used over time in the Highway Capacity Manual (HCM), including their shortcomings identified in other research. Alternative performance measures proposed in other studies are also reviewed. The document aims to provide an extensive literature review on capacity and level of service for two-way, two-lane highways, comparing different performance measures and factors affecting capacity estimations.
This document provides a review and analysis of the optimal speed model. It discusses:
1) The theoretical models that support the optimal speed model including microscopic, mesoscopic, and macroscopic traffic flow models.
2) Problems with the original optimal speed model including unrealistic behavior, instability, and stop-and-go waves.
3) A proposed double boundary optimal velocity function model that allows vehicles to operate within a range of speeds and spacings rather than at a single optimal point. This addresses issues with the original model.
5A_3_GIS based spatial modelling for improving the sustainability of aggregat...GISRUK conference
This document summarizes a PhD thesis that uses GIS and spatial modeling to analyze the sustainability of aggregate mineral supply in the UK. The research aims to:
1) Build a GIS model to represent consumption, supply, and transport networks of aggregates.
2) Develop a spatial interaction model to simulate aggregate flows via different transport methods.
3) Evaluate environmental and social impacts like carbon footprint to compare policy scenarios for aggregate delivery.
Robust Counterpart Open Capacitated Vehicle Routing (RC-OCVRP) Model in Opti...IJECEIAES
In this paper, the Robust Counterpart Open Capacitation Vehicle Rounting Problem (RC-OCVRP) Model has been established to optimize waste transport in districts Sako and districts Sukarami, Palembang City. This model is completed with the aid of LINGO 13.0 by using Branch and Bound solver to get the optimum route. For Sako districs, the routes are as follows: working area 1 is TPS 1-TPS 2-TPS 3-TPA with distance 53.39 km, working area 2 is TPS 1-TPS 2-TPS 3-TPA with distance 48.14 km, working area 3 is TPS 1-TPA with a distance of 22.98 km, and working area 4 is TPS 1-TPS 2TPS 3-TPS 4-TPA with 45.45 km distance, and obtained the optimum route in Sukarami districts is as follows: working area 1 is TPS 1-TPS 2-TPA 44.39 km, working area 2 is TPS 1-TPS 2-TPS 3-TPA with distance 49.32 km, working area 3 is TPS 1-TPS 3-TPA-TPS 2-TPA with distance 58.57 km, and working area 4 is TPS 1-TPA with a distance of 24.07 km, working area 5 is TPS 1-TPS 3-TPA-TPS 2-TPS 4-TPA with a distance of 77.66 km, and working area 6 is a TPS 1-TPS 2-TPS 3-TPA with a distante 44.94 km.
Integrating Tabu Search and MPOSH Heuristic for Solving a Multiple-Period Oil...drboon
Multi-period oil station replenishment problem is one type of vehicle routing problem that has constraints such as number of truck, capacity of truck’s compartments and capacity of tank space in each station. Generally, the objective of vehicle routing problem is to minimize the transportation cost. Solving the large problem to find the best solution is complex and difficult. Because, in the large problem, many conditions and parameters are calculated, then the computer calculation is time consuming. In this study, the Multi-Period Oil Station Replenishment Heuristic (MPOSH), and integration between MPOSH and Tabu Search called Tabu MPOSH are constructed for performance tests. The problems are investigated with varied sizes, such as: number of stations are 5, 10, 20, 50, and 75 stations, and the demand frequencies in each station are 5, 10, and 20 days, the trucks used in transportation are 2 to 38 trucks, and the demands are two values (maximum and minimum). The results show the hybrid between MPOSH and Tabu Search or Tabu MPOSH with number of run 350 cycles (iterations) yields the better solution than others. Observantly, setting the higher iterations will improve the solution results. The solved information shows number of days for delivery, number of trucks, and stations of trips in each day.
33A Meta-heuristic Approach to Rail-Truck Intermodal Transportation of Hazard...idescitation
The phenomenal growth of intermodal transporta-
tion over the past three decades, partly driven by the increas-
ing demand for chemical around the world, has not been
matched by a comparable level of academic activity, especially
in the context of hazardous materials. In this work, we pro-
posed a bi-objective optimization model and a tabu-search
based solution methodology to plan rail-truck intermodal
transportation of hazardous materials (hazmat). The frame-
work was applied to solve realistic size problem instances,
which were analyzed to gain managerial insights, to identify
non-dominated elements of the risk-cost frontier, and to pro-
vide building blocks to develop public policy instruments.
The document discusses various formulations of the Vehicle Routing Problem with Backhauls (VRPB). It begins by providing background on the VRPB and its history. It then describes several common variants of the VRPB that have been studied in literature, including the Vehicle Routing Problem with Backhauls (VRPB), Mixed Vehicle Routing Problem with Backhauls (MVRPB), Multiple Depot Mixed Vehicle Routing Problem with Backhauls (MDMVRPB), Vehicle Routing Problem with Backhauls and Time Windows (VRPBTW), and others. For each variant, the document outlines key characteristics and constraints and references relevant literature and studies.
At the 2014 annual Dispersion Modellers user group meeting guest speaker Sean Beevers spoke on the topic: 'Update on progress with the development of a hybrid personal exposure model'
Multi depot Time-dependent Vehicle Routing Problem with Heterogeneous FleetArian Razmi Farooji
The document summarizes a study comparing NSGA II and MOSA algorithms for solving a multi-depot vehicle routing problem with time-dependent travel times and a heterogeneous fleet. The problem involves routing vehicles from multiple depots to serve customers within time windows while minimizing costs and number of routes. NSGA II and MOSA were tested on randomly generated small, medium, and large problems. Results showed that on average, MOSA performed better than the model on small problems, while NSGA II performed comparably to the model.
This document outlines a thesis project for developing a platform to calculate optimal public transportation routes. The platform includes an Android app that allows users to input an origin, destination, and preferences to receive the shortest route. It will use an algorithm to find the time-dependent shortest path considering schedules and current traffic. The architecture involves Android and RESTful APIs to communicate between the client, service provider, and multiple transportation providers. Future work could improve route accuracy with real-time traffic and location data and support more complex routing queries.
Presentation by Tom Worsley, Visiting Research Fellow, delivered as part of the annual series of Beesley lectures, organised by the Institute of Economic Affairs at the Institute of Directors in London.
8 capacity-analysis ( Transportation and Traffic Engineering Dr. Sheriff El-B...Hossam Shafiq I
This document discusses concepts related to transportation capacity analysis including:
- Definitions of level of service (LOS) categories A through F and their characteristics.
- How capacity is defined as the maximum hourly rate of vehicles that can pass a point under prevailing conditions.
- Procedures from the Highway Capacity Manual (HCM) for calculating capacity for basic freeway sections and the impacts of factors like lane width, lateral clearance, and free flow speed.
- The relationships between capacity, LOS, and transportation design and how capacity analysis can inform design.
This document proposes a framework to measure and compare the performance of container ports using ship GPS traces and maritime open data rather than relying on statistics reported by port authorities. The framework identifies container handling events from ship GPS traces, estimates the number of containers handled during each event using information about ships and terminals, and aggregates the events to calculate key performance indicators like throughput, berth utilization and productivity. These indicators allow comparison of ports at terminal, port and regional levels. The document evaluates the framework using real-world GPS and open data from major ports worldwide.
This document provides emissions data from chassis dynamometer testing of five 2003-2005 model year heavy-duty trucks. Carbon dioxide (CO2) emissions were found to correlate well with dispersed axle power, with an R2 of 0.86. Nitrogen oxides (NOx) emissions did not correlate as well with power, with an R2 of only 0.53, due to increasingly complex engine emissions controls affecting the linear dependence of NOx on power. The average ratio of NOx to CO2 emissions for the 2003-2005 model year trucks was found to be 0.0051, agreeing reasonably well with estimated certification standards, and lower than the average ratio of 0.0141 found for 1994-2002 model year
This document summarizes research into improving models for predicting traffic-actuated phase times in traffic signal timing design. Existing models make simplifying assumptions that result in inaccurate phase time predictions. The research aims to develop an improved methodology by accounting for operational effects like progression and queue blockage. Experimental results indicate the new methodology more accurately calculates actuated phase times, which could lead to better traffic signal timing plans and reduced congestion.
This document discusses traffic stream flow models and the variables used to describe traffic flow conditions. It introduces concepts like traffic flow, concentration, speed, spacing, headway, and gap. Flow-density relationships are presented, including the Greenshield linear model that shows the relationship between density, flow, and speed in traffic. Car following rules are discussed as the basis for models that determine safe spacing between vehicles based on speed.
Vehicle route scheduling and transportation cost minimization in a latex indu...IJRES Journal
The vehicle route scheduling problem is concerned with the determination of routes and schedules for a fleet of vehicles to satisfy the demands of a set of customers. The goal of vehicle routing is to schedule multiple suppliers from various places. Vehicle routing has existed since the advent of the Industrial age, when large-scale production became possible. As the complexity and scale of the manufacturing world increased, the task of optimizing vehicle routing grew. The vehicle routing problem is a combinatorial optimization and integer programming problem seeking to service a number of customers with a fleet of vehicles. Often the context is that of delivering goods located at a central depot to customers who have placed orders for such goods or vice-versa. Implicit is the goal of minimizing the cost of distributing the goods. Many methods have been developed for searching for good solutions to the problem, however even for the smallest problems, finding global minimum for the cost function is computationally complex. The paper presents an optimization algorithm using Particle Swarm Optimization (PSO) for the vehicle routing that would enable the logistic manager of a latex industry to minimize the transportation cost and maximize the collection using minimum number of vehicles.
This document defines microscopic traffic stream parameters such as speed, density, flow, time headway, space headway, and spacing. It establishes the relationships between these parameters and provides the basic traffic flow equation relating flow, density, and speed. Examples are also given to demonstrate calculating traffic flow parameters from given data.
This document discusses traffic flow fundamentals, including different types of traffic flow and key variables used to describe traffic flow. It covers uninterrupted and interrupted flow, and variables such as flow rate, speed, density, time headway, spacing, and time occupancy. Empirical relationships between flow, speed, and density are presented, including the Greenshields speed-density model and equations relating volume to density. Examples are provided to demonstrate calculations for various traffic flow measures.
This document summarizes research on integrating traffic and emission models to simulate the impacts of traffic on emissions. It describes:
1) Developing an approach to combine traffic simulation and emission models in a distributed way.
2) Proposing a method to calibrate microscopic emission models using aggregate emission measures.
3) Applying the integrated models to evaluate how different traffic demands and signal controls impact emissions.
In this presentation, a new routing model was introduced in the form of integer linear programming by combining the concepts of time windows and multiple demands and by considering the two contradictory goals of minimizing travel: cost and maximizing demand coverage.
Ports in Short Sea Shipping. A critical assessment of the European Maritime T...Ancor Suárez Alemán
This dissertation examines ports and their role in European maritime transport policy through 5 chapters. Chapter 1 provides a critical review of recent EU maritime policies and their aims to promote more sustainable and competitive transport. Chapter 2 develops a theoretical model to analyze port and road transport costs. Chapter 3 discusses using time spent in port as a measure of port efficiency. Chapter 4 considers incentives for improving port efficiency. Chapter 5 presents a case study examining what determines the potential success of short sea shipping. The dissertation aims to better understand how ports can be encouraged to support the goals of EU maritime transport policy.
This document presents a bottom-up methodology to estimate vehicle emissions in Beijing, China at the grid level. The methodology combines vehicle emission factors based on speed from the MOBILE5B-China model with vehicle activity data from a travel demand model. Applying this approach, total emissions of HC, CO and NOx in Beijing's urban area in 2005 were estimated to be 13.33×10⁴, 100.02×10⁴ and 7.55×10⁴ tons respectively. The grid-based estimates provide a more accurate spatial distribution of emissions compared to typical macro-scale approaches used in China.
Shiyu Yan delivered this presentation at a joint ESRI-UCD conference tilted 'Energy research to enable climate change mitigation' on 17 September 2019.
Photos from the conference are available to view on the ESRI website here: https://www.esri.ie/events/esri-ucd-conference-energy-research-to-enable-climate-change-mitigation
A comparison of_north_american_and_european_railwa★ Carlos Soler
This document compares railway systems in North America and Europe and discusses how their differences impact optimization models for railway freight planning. Key differences include higher fixed costs and lower train capacities in Europe due to shared tracks with passenger rail. As a result, European models must balance transportation and consolidation costs more, focusing on high train utilization rather than individual car routes. The document argues that Europe could benefit from concepts like decentralized planning used in North America but models need to reflect Europe's unique circumstances. Abolishing the "pure strategy" requirement in European models may increase flexibility and efficiency.
Macroscopic Traffic Flow model for nepalese roadsHemant Tiwari
This research deals with the calibration of various conventional macroscopic traffic flow models of Nepalese Roads and recommend the best suitable model after undergoing calibration and validation process.
A Computational Study Of Traffic Assignment AlgorithmsNicole Adams
The document summarizes a study comparing algorithms for solving traffic assignment problems. It classified algorithms as link-based (using link flows), path-based (using path flows), or origin-based (using link flows from origins). It reviewed literature on algorithms like Frank-Wolfe (link-based), path equilibration (path-based), and origin-based algorithm. It chose to implement representative algorithms from each class: Frank-Wolfe, conjugate Frank-Wolfe, bi-conjugate Frank-Wolfe (link-based), path equilibration, gradient projection, projected gradient, improved social pressure (path-based), and Algorithm B (origin-based) to compare their performance on benchmark problems.
A Computational Study Of Traffic Assignment AlgorithmsAlicia Buske
This document summarizes a research study that compares different algorithms for solving traffic assignment problems. The study performs a literature review of prominent traffic assignment algorithms, classifying them based on how the solution is represented (link-based, path-based, origin-based). It then implements representative algorithms from each class and conducts computational tests on benchmark networks of varying sizes. The results are analyzed to compare algorithm performance and identify the impact of different algorithm components on running time.
The International Journal of Engineering and Science (The IJES)theijes
The International Journal of Engineering & Science is aimed at providing a platform for researchers, engineers, scientists, or educators to publish their original research results, to exchange new ideas, to disseminate information in innovative designs, engineering experiences and technological skills. It is also the Journal's objective to promote engineering and technology education. All papers submitted to the Journal will be blind peer-reviewed. Only original articles will be published.
The papers for publication in The International Journal of Engineering& Science are selected through rigorous peer reviews to ensure originality, timeliness, relevance, and readability.
A decade of Australasian Public Transport projects paper for ATRF 2011martinse
This paper outlines factors behind escalating costs for public transport projects in Australia and New Zealand along with indicative per-km costs for heavy rail, light rail and bus rapid transit.
International Journal of Computational Engineering Research(IJCER)ijceronline
International Journal of Computational Engineering Research(IJCER) is an intentional online Journal in English monthly publishing journal. This Journal publish original research work that contributes significantly to further the scientific knowledge in engineering and Technology.
Presentation by Prof. Gerard De Jong delivered on on 20 March 2014 at International Freight Transport Modelling Workshop 2014 http://bit.ly/1o0vxAh
www.its.leeds.ac.uk/people/g.de+jong
This document summarizes a study that analyzed the built environment of two ferry terminals in Mokpo, South Korea in terms of passenger walkability and satisfaction. The researchers conducted an audit survey to measure the built environment features, then used importance-performance analysis to identify poorly walkable sections. They found passengers' satisfaction with the walking path environment varied by age and residence. In particular, there were significant differences in satisfaction between groups when embarking and disembarking the ferry. The study aims to help improve ferry terminal design for passenger convenience and walking experience.
This document provides an overview of transportation engineering, including the objectives of the course and various modes of transportation. It describes the main modes as road, rail, maritime, air, and pipelines. It also defines a transportation system as consisting of fixed facilities, flow entities, and a control system. Transportation planning is discussed as a process involving survey, analysis, forecasting, evaluation, adoption, implementation and ongoing studies to develop an efficient system.
Analysis of rc bridge decks for selected national a nd internationalstandard ...eSAT Journals
Abstract
The paper presents the comparison of the effect of different standard loadings on a set of reinforced concrete bridge decks using the
finite-element method. The parameters investigated include the aspect ratio (span/width) and type of loading. The investigations are
conducted on two lane slab bridge decks of span 5m to 9.5m and two lane T beam bridge decks of span 7.5m to 20m. A total of 36
bridge models were analyzed. The variation of different critical structural response parameters such as deflection, longitudinal
bending moment, transverse moment, shear force and torsional moments are evaluated for IRC loading (IRC Class A and 70R
loadings), AASHTO loading (HL93) and Euro standard loading (LM1). The results shows that the maximum difference in deflection
and longitudinal bending moment for the two IRC standard loading ranges from 5 to 15%. While the difference between
corresponding values for the AASHTO loading in the range of 5 to 17%. The maximum axle load of euro standard loading is found to
be 2.2 times higher than IRC class A loading maximum axle load hence the values of structural response parameters are increased by
1.7 to 1.8 times. Therefore there is a need for adopting simplified and more realistic standard loads in the future.
Keywords: Bridges, Concrete deck slabs; Finite element method; T-beam bridge decks; Aspect ratio; Live load, IRC code,
AASHTO code and Euro code.
Analysis of rc bridge decks for selected national a nd internationalstandard ...eSAT Journals
The document analyzes the effects of different national and international standard loadings on reinforced concrete bridge decks using finite element modeling. 36 bridge deck models of slab bridges and T-beam bridges were analyzed under loadings from IRC, AASHTO, and Eurocode standards. The results show maximum differences of 5-15% in deflection and bending moment between IRC loadings, and 5-17% difference for AASHTO loading compared to IRC. Eurocode loading causes increases of 1.7-1.8 times for slab bridges and 1.3-2.2 times for T-beam bridges over IRC due to higher load magnitudes. Transverse and torsional responses also vary significantly between standards.
Analysis of rc bridge decks for selected national and internationalstandard l...eSAT Publishing House
IJRET : International Journal of Research in Engineering and Technology is an international peer reviewed, online journal published by eSAT Publishing House for the enhancement of research in various disciplines of Engineering and Technology. The aim and scope of the journal is to provide an academic medium and an important reference for the advancement and dissemination of research results that support high-level learning, teaching and research in the fields of Engineering and Technology. We bring together Scientists, Academician, Field Engineers, Scholars and Students of related fields of Engineering and Technology
Similar to A modal shift for the logistics network system in japan (20)
Industrial Tech SW: Category Renewal and CreationChristian Dahlen
Every industrial revolution has created a new set of categories and a new set of players.
Multiple new technologies have emerged, but Samsara and C3.ai are only two companies which have gone public so far.
Manufacturing startups constitute the largest pipeline share of unicorns and IPO candidates in the SF Bay Area, and software startups dominate in Germany.
Part 2 Deep Dive: Navigating the 2024 Slowdownjeffkluth1
Introduction
The global retail industry has weathered numerous storms, with the financial crisis of 2008 serving as a poignant reminder of the sector's resilience and adaptability. However, as we navigate the complex landscape of 2024, retailers face a unique set of challenges that demand innovative strategies and a fundamental shift in mindset. This white paper contrasts the impact of the 2008 recession on the retail sector with the current headwinds retailers are grappling with, while offering a comprehensive roadmap for success in this new paradigm.
How to Implement a Real Estate CRM SoftwareSalesTown
To implement a CRM for real estate, set clear goals, choose a CRM with key real estate features, and customize it to your needs. Migrate your data, train your team, and use automation to save time. Monitor performance, ensure data security, and use the CRM to enhance marketing. Regularly check its effectiveness to improve your business.
Taurus Zodiac Sign: Unveiling the Traits, Dates, and Horoscope Insights of th...my Pandit
Dive into the steadfast world of the Taurus Zodiac Sign. Discover the grounded, stable, and logical nature of Taurus individuals, and explore their key personality traits, important dates, and horoscope insights. Learn how the determination and patience of the Taurus sign make them the rock-steady achievers and anchors of the zodiac.
Implicitly or explicitly all competing businesses employ a strategy to select a mix
of marketing resources. Formulating such competitive strategies fundamentally
involves recognizing relationships between elements of the marketing mix (e.g.,
price and product quality), as well as assessing competitive and market conditions
(i.e., industry structure in the language of economics).
Zodiac Signs and Food Preferences_ What Your Sign Says About Your Tastemy Pandit
Know what your zodiac sign says about your taste in food! Explore how the 12 zodiac signs influence your culinary preferences with insights from MyPandit. Dive into astrology and flavors!
Top mailing list providers in the USA.pptxJeremyPeirce1
Discover the top mailing list providers in the USA, offering targeted lists, segmentation, and analytics to optimize your marketing campaigns and drive engagement.
B2B payments are rapidly changing. Find out the 5 key questions you need to be asking yourself to be sure you are mastering B2B payments today. Learn more at www.BlueSnap.com.
SATTA MATKA SATTA FAST RESULT KALYAN TOP MATKA RESULT KALYAN SATTA MATKA FAST RESULT MILAN RATAN RAJDHANI MAIN BAZAR MATKA FAST TIPS RESULT MATKA CHART JODI CHART PANEL CHART FREE FIX GAME SATTAMATKA ! MATKA MOBI SATTA 143 spboss.in TOP NO1 RESULT FULL RATE MATKA ONLINE GAME PLAY BY APP SPBOSS
Navigating the world of forex trading can be challenging, especially for beginners. To help you make an informed decision, we have comprehensively compared the best forex brokers in India for 2024. This article, reviewed by Top Forex Brokers Review, will cover featured award winners, the best forex brokers, featured offers, the best copy trading platforms, the best forex brokers for beginners, the best MetaTrader brokers, and recently updated reviews. We will focus on FP Markets, Black Bull, EightCap, IC Markets, and Octa.
FIA officials brutally tortured innocent and snatched 200 Bitcoins of worth 4...jamalseoexpert1978
Farman Ayaz Khattak and Ehtesham Matloob are government officials in CTW Counter terrorism wing Islamabad, in Federal Investigation Agency FIA Headquarters. CTW and FIA kidnapped crypto currency owner from Islamabad and snatched 200 Bitcoins those worth of 4 billion rupees in Pakistan currency. There is not Cryptocurrency Regulations in Pakistan & CTW is official dacoit and stealing digital assets from the innocent crypto holders and making fake cases of terrorism to keep them silent.
Best practices for project execution and deliveryCLIVE MINCHIN
A select set of project management best practices to keep your project on-track, on-cost and aligned to scope. Many firms have don't have the necessary skills, diligence, methods and oversight of their projects; this leads to slippage, higher costs and longer timeframes. Often firms have a history of projects that simply failed to move the needle. These best practices will help your firm avoid these pitfalls but they require fortitude to apply.
A modal shift for the logistics network system in japan
1. 18
th
International Conference on Production Research
A MODAL SHIFT MODEL FOR THE LOGISTICS NETWORK SYSTEM
IN JAPAN
S. Yun, N. Katayama, S. Yurimoto
Faculty of Logistics Systems, Ryutsu Keizai University
120 Ryugasaki, Ibaraki 301-8555, Japan
Abstract
The possibility of a shift away from road to railway and marine transportation is discussed by analyzing the
behavior of cargo shippers and by clarifying the factors involved in the choice of transport mode in terms of
transport distance, time, cost, freight lot size and other related factors. The analysis procedures were
conducted using logit models. As a result, factors influencing the modal choice could be identified and it was
found that a considerable portion of currently existing transportation could be converted to container
transport by ship or rail. The scale of feasibility for this shift and the considerable reduction of CO2 emissions
gained by this shift were estimated. Furthermore the influence on modal split of changes in transport cost
and freight lot size was investigated by means of sensitivity analysis.
Keywords:
Modal shift, Logit model, CO2 emissions, Freight transport, Logistics network
1 INTRODUCTION
The volume of Japan’s domestic cargo transportation for
fiscal 2002 came to 5.9 billion tons, or 570.7 billion ton-
kilometers, of which trucks carried 90.6% in tonnage, or
54.7% in terms of ton-kilometer. The breakdown in modal
share is as follows: 48.0% by commercial trucks, 42.6% by
private trucks, 1.0% by rail, 8.4% by marine, 0.0% by air in
ton, and 46.0% by commercial trucks, 8.7% by private
trucks, 3.9% by rail, 41.2% by marine, 0.2% by air in ton-
kilometers. Figure 1 shows the changes in modal split of
freight transport in major countries. Freight transport in
Japan has been characterized by an increase in truck
operations for domestic freight traffic. Trucks carry nearly
half of freight tonnage, especially over short-distance
hauling, though these vehicles are less efficient and cause
more damage to the environment. The prevalence of less
efficient trucks is one of the major causes of energy
inefficiency in the traffic sector. A conversion from trucks to
railway or ships would make it possible to bring about
improved cargo efficiency. In view of the environment and
transport efficiency factors, a shift from trucks to railway or
ships is desirable.
In this paper, the possibility of a shift from road to railway
and marine transportation between the Tokyo metropolitan
area and the remote areas of Japan is discussed by
analyzing the behavior of cargo shippers and clarifying the
factors involved in the choice of transport mode by
transport distance, time, cost, freight lot size and other
related factors. The analysis procedures were conducted
using logit models.
As a result, factors influencing the modal choice could be
identified and it was found that a considerable portion of
currently existing transportation could be converted to
container transport by ship or rail. In addition, the scale of
feasibility of this shift was estimated. The greater the
increase in rail and marine transport, the more the loading
efficiency would improve, and this in turn would lead to a
reduction in CO2 emissions. The influence on modal split of
changes in transport cost and freight lot size was
investigated by means of sensitivity analysis. Finally, the
CO2 emission reduction brought about by changes in
transport cost are shown.
There are several earlier papers dealing with modal shift
/split models. Matsuo [1] provides the modal shift model
between trucks and ferry ships at middle and long distance
transportation, and applies discriminant analysis to the
model. Motsuo and Fukuda [2] discuss logit models
between trucks and ferry ships for rough data between
prefectures. Tanaka, Shibazaki and Watabe [3] present a
logit model between Hokkaido and prefectures in Kanto
area. Most studies have focused on modal share and its
variation. However, they have not explicitly clarified the
evaluation of the environmental influences by a modal shift.
2 LOGIT MODELS
In this study, logit models for freight traffic to estimate
cargo owner behavior were built and these models were
applied to predict the modal split between road traffic and
railway containers, and also between truck and ferry traffic
for each relevant origin-destination pair. The models used
the assumption that a cargo owner would choose the mode
offering the maximum benefit to the firm, a factor that can
be measured by utility. The basic principle of the logit
model is that people behave rationally: they are constantly
trying to maximize their utility [4]. This utility can be
described with a utility function, which is divided into two
components: strict utility and a stochastic element. The
higher the utility, the more likely that alternative will be
chosen. The models are also used to test the effects of
some policies related to the development of freight
transportation systems.
A disaggregate model such as a logit model is based on
individual behavior. Therefore it takes into account
important characteristics of the decision-maker that make a
richer model specification possible. A better understanding
of intermodal competition is accomplished due to the fact
that these models use the actual attributes of modes and
characteristics of the goods to be transported for
generating estimates. The principal limitations of
disaggregate models are the considerable amount of data
required, difficulties compiling this data on individual mode
choices, and the complexity of defining all attributes that
determine choice. Fortunately, data using a three-day-
survey collected from the 7th Physical Distribution Census,
which was carried out in fiscal year 2000 [5], could
2. 0
10
20
30
40
50
60
70
80
Japan
(1990)Japan
(1995)Japan
(2002)U
SA
(1990)U
SA
(1995)U
SA
(2000)
U
K
(1990)
U
K
(1995)
U
K
(2000)
G
erm
any
(1990)
G
erm
any
(1995)
G
erm
any
(2000)
%
Railway Truck Ship
Figure 1: Changes in modal split of freight transport in major countries.
be obtained. These data are based on the origin-destination
zones divided into 227 areas by mode.
The probability of choosing freight mode i in the logit model
can be expressed as follows.
)exp()exp(
)exp(
jnin
in
in
VV
V
P
+
= (1)
knkiin aV ∑= θ (2)
• inP : the probability of choosing mode i by item n.
• kiθ : a parameter for explanatory variable k.
• kna : explanatory variable k of item n.
• inV : utility which is obtained by mode i of item n.
The targeted transport modes are the consolidated truck
freight services, such as parcel delivery services, and the
chartered trucks for road traffic; railroad containers; and
ferry service ships. The models estimate the probability of
choosing a mode between two alternatives for freight traffic
between the Tokyo metropolitan area and the remote areas
of Japan (Hokkaido, Tohoku and Kyushu areas). Figure 2
shows the map of these areas. Table 1 shows the targets
used by logit models. Model 1 targets freight transport
between Hokkaido, Tohoku - Tokyo metropolitan area,
Model 2 targets freight between Hokkaido - Tokyo
metropolitan area. Model 2 does not include Tohoku
because of the small amount of ferry freight between
Tohoku - Tokyo metropolitan area. Model 3 and 4 target
freight between Kyushu - Tokyo metropolitan area. The
targets of modal choice in Model 1 and 3 are truck and
railway container; those of Model 2 and 4 are truck and ferry
ship. The explanatory variables considered in the logit
models included the following:
• Access time from origin of shipment to the nearest freight
station or port used for the mainline transport.
• Access distance from origin of shipment to the nearest
freight station or port used for the mainline ransport.
• Trunk time for mainline transport.
• Trunk distance for mainline transport.
• Egress time from the cargo station or port in destination
area to actual destination.
• Egress distance from the cargo station or port in
destination area to actual destination.
• Total time between origin and destination.
• Total distance between origin and destination.
• Transportation cost.
Figure 2: Tokyo metropolitan area and the remote areas of
Japan (Hokkaido, Tohoku and Kyushu area).
3. 18
th
International Conference on Production Research
Table 1: Logit models.
Model Freight Transport Modal Choice
1 Hokkaido, Tohoku -Tokyo met Truck and railway container
2 Hokkaido - Tokyo met Truck and ferry ship
3 Kyushu - Tokyo met Truck and railway container
4 Kyushu - Tokyo met Truck and ferry ship
Table 2: Explanation variables, parameters and t- values.
Parameter and t-valueExplanation
variable Model 1 Model 2 Model 3 Model 4
Access Time
-0.0537
(-5.23)
-
-0.109
(-4.17)
-0.949
(-4.93)
Total Time -
-0.0322
(-3.27)
- -
Transport Cost
-0.00818
(-8.44)
-0.00377
(-2.85)
-0.00255
(-5.22)
-0.00499
(-7.91)
Log Lotsize
1.35 [train]
(11.8)
-
1.24
(11.7)
1.18
(9.74)
Correction term -3.59 [train] -3.26 [track] -1.65 [train] -2.01 [train]
( ) is t-value [ ] is target
Table 3: Hit ratios and likelihood ratios.
Model 1 Model 2 Model 3 Model 4
Track hit ratio 0.72 0.58 0.81 0.81
Railway hit ratio 0.85 - 0.69 -
Ferry hit ratio - 0.62 - 0.79
Average hit ratio 0.79 0.60 0.76 0.80
Likelihood ratio 0.37 0.08 0.27 0.32
• Freight lot size (logarithmic value).
Appropriate variables were selected from these variables
based on the results of model applications.
3 RESULTS OF APPLICATION OF LOGIT MODELS
A software program, LIMDEP/NLOGIT Ver3.0, was used to
calculate results using this model analysis. The analysis
was conducted for the four models, respectively. Table 2
shows the explanatory variables selected for these models
and their parameters and t-values. Table 3 shows the hit
ratios and likelihood ratios.
From these results, it was found that the factors influencing
mode choice were the freight lot size of the goods, transport
cost and the total transport time between the origin and
destination, and access time to the nearest port or cargo
station.
Freight lot size is an especially significant determinant of
mode choice related to transportation between the Tokyo
and Kyushu areas, whereas transport cost is a common
significant determinant of mode choice for all areas. These
factors have an influence on the selection ratio of a mode.
The larger the lot size of the freight and the less the
transport cost by railway and ferry, the more the share of
railway and ferry containers.
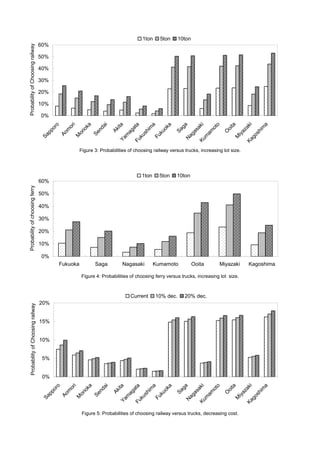
4 SENSITIVITY ANALYSIS
Some sensitivity analyses based on the results of the
applications were carried out. The influence on modal split
of changes in transport cost and freight lot size was first
investigated in the case of cargo shipped from Hokkaido,
Tohoku or Kyushu to Tokyo.
As the freight lot size increases, the probabilities of
choosing railway container versus trucks in a logit model is
shown in Figure 3, and that of ferry ships versus trucks is
shown in Figure 4. In the same way, probabilities of
choosing railway container and ferry ships versus trucks,
5. 18
th
International Conference on Production Research
0%
20%
40%
60%
80%
100%
Sapporo Fukuoka Saga Nagasaki Kumamoto Ooita Miyazaki Kagoshima
ProbabilityofChoosingferry
Current 10% dec. 20% dec.
Figure 6: Probabilities of choosing ferry versus trucks, decreasing cost.
Table 4: CO2 emission coefficients
(2000 year, g-CO2/ton km).
Commercial truck 178
Small-size commercial truck 819
Private truck 372
Small-size private truck 3,049
Railway 21
Ship 40
Air 1,483
when the transport costs by railway and ferry decrease, are
shown in Figure 5 and 6. It can be seen that the influence of
freight lot size is relatively large and this factor is crucial for
the modal shift from road traffic to railway or ships
5 CO2 EMISSION REDUCTION RATES
When transport costs by railway and ferry decrease, logit
models can be used to estimate: CO2 emission reduction
rates derived from transport volume; CO2 emission
coefficients; and the variance in the rates of probability of
choosing railway container or ferry ships versus trucks.
Table 4 shows the CO2 emission coefficients for each
transport mode. CO2 emission coefficients of truck and air
are scores of times more than railway and ship. When
transport costs decrease 10% and 20% from current
transport costs, the CO2 emission reduction rates are
derived for pairs of each origin and destination area. Then
the CO2 emission reduction rates for the freight from each
prefecture to the Tokyo metropolitan area are calculated.
The CO2 emission reduction rates are shown in Figure 7 in
the case of railway versus trucks, and in Figure 8 in the
case of ferry versus trucks.
6 CONCLUSIONS
Various action plans have been put together to achieve the
Kyoto Protocol's targets for the reduction of greenhouse gas
emissions. A modal shift from trucks to rail and marine
transport is considered a means to this end. Japan's official
Outline for Promotion of Efforts to Prevent Global Warming,
formulated to achieve the Kyoto Protocol's targets for the
reduction of greenhouse gas emissions, sets a goal of
reducing 4.4 million tonnes of carbon dioxide emissions
through modal shifting. To achieve this goal, truck
shipments of approximately 20 billion freight tonne-
kilometers need to be switched to railways and coastal
shipping. However, the rail and shipping shares of total
shipments are in a state of continuing decline.
In this paper, the possibility of a modal shift from road to
railway and marine transport, between the Tokyo
metropolitan area and the remote areas of Japan, are
discussed by analyzing the behavior of cargo shippers. The
factors involved in the choice of transport mode by transport
distance, time, cost, freight lot size and other related factors
are clarified. These analyses were conducted using logit
models.
Results of the statistical analyses showed that factors
influencing the modal choice could be identified, and it was
found that a considerable portion of freight could be
converted to container transport by ships or rail. Significant
factors for the modal shift were freight lot size, access time
to the nearest cargo station or port, total time between
origin and destination areas and transport cost.
The influence on modal split of changes in transport cost
and freight lot size was investigated by means of sensitivity
analysis. It was found that when the freight lot size by
railway or ferry increases, modal shift from trucks to railway
or ferry accelerate, especially in the case of large-scale
6. 0.0%
1.0%
2.0%
3.0%
4.0%
5.0%H
okkaido
Aom
ori
Iw
ate
M
iyagi
AkitaYam
agataFukushim
a
Fukuoka
SagaN
agasakiKum
am
oto
O
oita
M
iyazakiKagoshim
a
Reductionrate
10% dec. 20% dec.
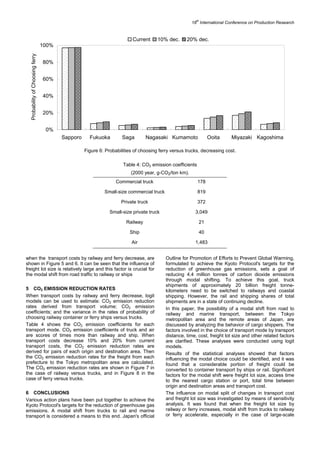
Figure 7: Total CO2 emission reduction rate of choosing railway versus trucks, decreasing cost.
0%
1%
2%
3%
4%
5%
Hokkaido Fukuoka Saga Nagasaki Kumamoto Ooita Miyazaki Kagoshima
Reductionrate
10% reduction 20% reduction
Figure 8: Total CO2 emission reduction rate of choosing ferry versus trucks, decreasing cost.
mainline freight transport. Finally, the CO2 emission
reduction rate was estimated when transport costs
decrease, and the environmental impact of the modal shifts
from road to railway and marine transport was analyzed. In
order to realize the modal shift, relevant objectives capable
of being carried out should be considered.
Specific measures to promote the use of rail cargo include
increasing the number of freight cars that can be joined
together to enable higher-volume transport and the
introduction of "super rail cargo," or express freight
container trains, to drastically reduce shipment times. To
enhance the contribution of waterways, the Ministry of Land,
Infrastructure and Transport will look into policy
restructuring to deregulate new business entry and
consolidate the inter-linkages between domestic coastal
and international shipping. As for awareness-raising, the
ministry is considering various incentives targeted at cargo
shippers and distribution businesses.
7 ACKNOWLEDGMENTS
This research was partially supported by the Ministry of
Education, Culture, Sports, Science and Technology, Grant-
in-Aid for Scientific Research (C), 16510119, 2004 and
Grant-in-Aid from the Japan Institute of Logistics Systems,
2004.
8 REFERENCES
[1] Matsuo T., A Study Middle/Long-Distance Ferryboat
Services and Modal Shift, Journal of Japan Institute of
Navigation, 1995, 92, 249-256 (in Japanese).
[2] Matsuo T., Fukuda H., Improvement of Middle/Long-
Distance Ferryboat Services and Modal Shift, Journal
of Japan Logistics Society, 1997, 5, 63-72 (in
Japanese).
[3] Tanaka J., Shibazaki R., Watabe T., Analyses for the
Transport Share of the Unit Load Freights for the
Inland Trade, Report of National Institute for Land and
Infrastructure Management, 2003, 60(in Japanese).
[4] Ben-Akiva M., Lerman S., 1985, Discrete Choice
Analysis, The MIT Press.
[5] Ministry of Land, Infrastructure and Transport, 2002,
The Report of the 7th National Freight Transportation
Survey, Ministry of Land, Infrastructure and Transport
(in Japanese).